This application note presents an SPE-based analytical method suitable for the determination of common Sudan dyes in chili oleoresin. This application note also presents liquid chromatography using a solid-core analytical column packed with 2.7 μm particles. This type of column allows for efficient separations at lower backpressures and is compatible with both HPLC and UPLC systems.
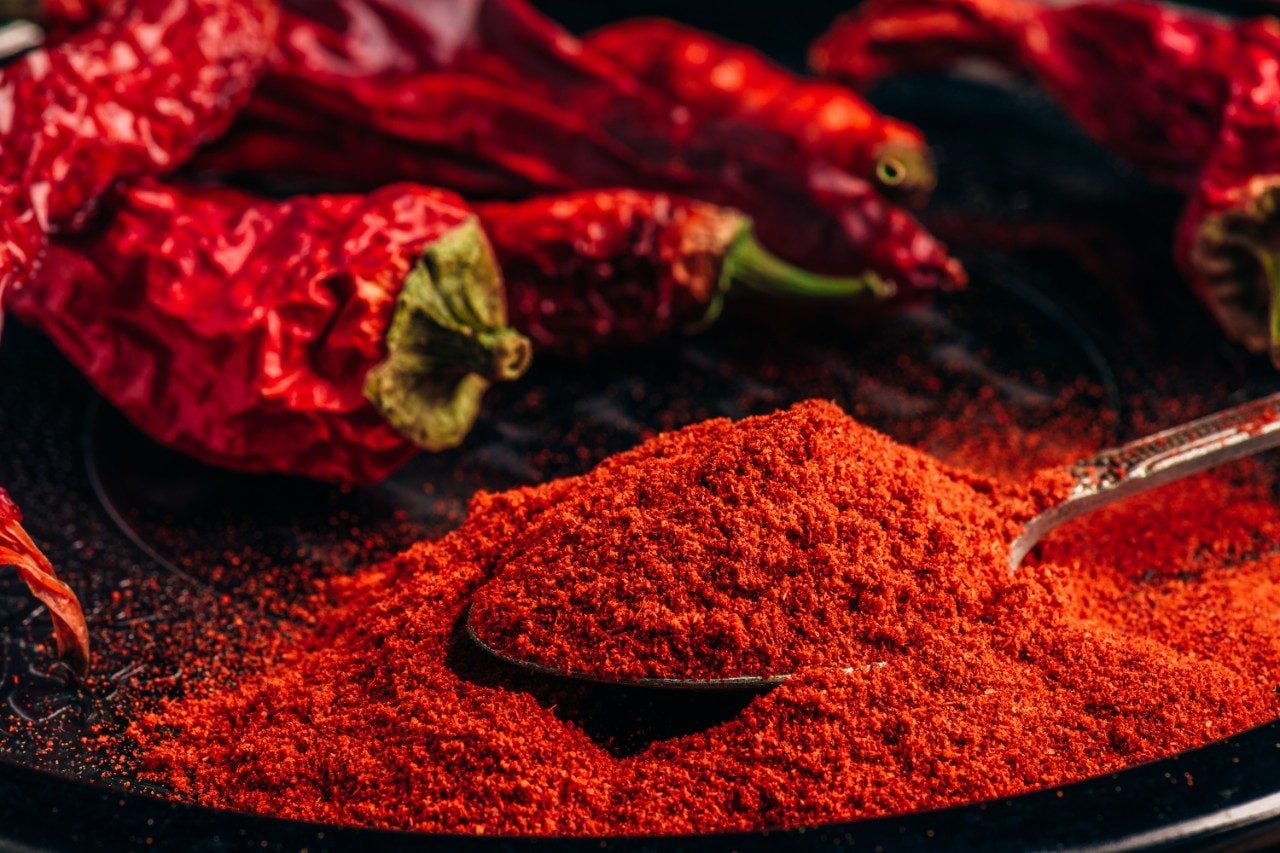
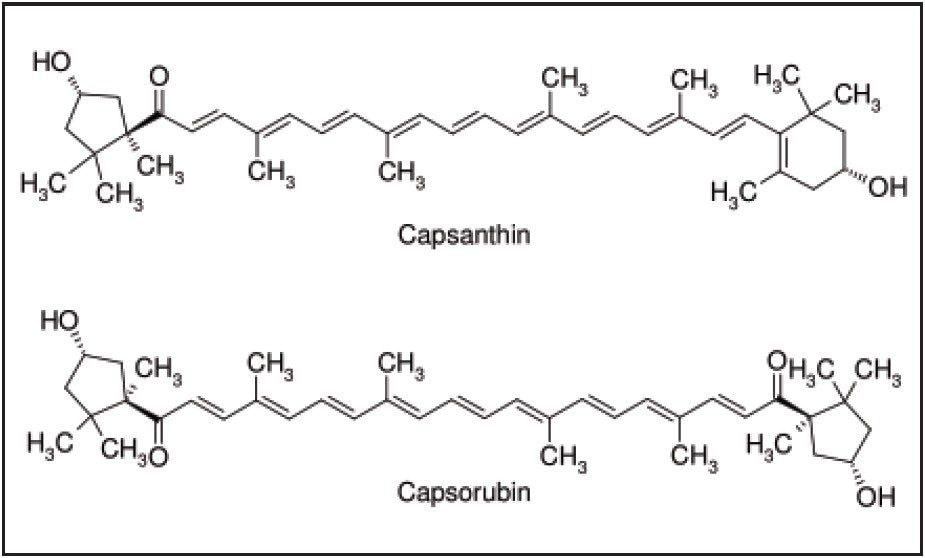
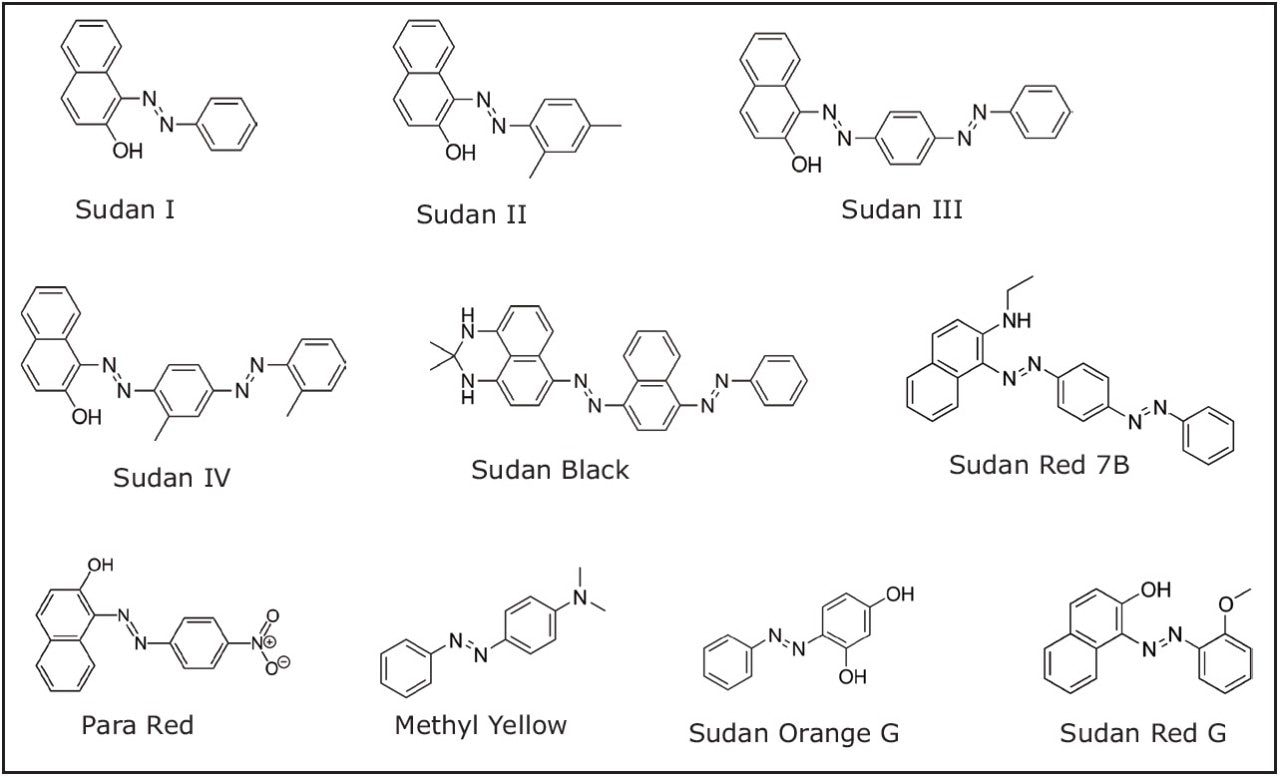
The Sudan dyes are a class of diazo-conjugate, water-insoluble compounds used to impart colors to waxes, oils, solvents and plastics. Many of these dyes individually or in mixtures produce colors very similar to colored compounds found naturally in red chili peppers (two important chili pepper color compound structures are presented in Figure 1). Unfortunately the Sudan dyes, potential carcinogens, are sometimes used to enhance the color of chili based products. Because such use is illegal, the presence of Sudan dyes, at any level, is not permitted in foods. Therefore, sensitive and reproducible methods have been developed for determination of Sudan dyes in typical chili products. However, chili oleoresin is a much more complex sample matrix compared with fresh chili or chili powder. Chili oleoresin is a highly concentrated mixture of natural oils and resins extracted from chili. It is used as both an intense flavoring agent and an intense coloring agent in the food industry. It is also used as a source of capsaicin for medicinal preparations and in pepper spray. Since the oleoresin is used as a food coloring agent, effective analytical methods are required for detection of illegal dyes in this product. This application note presents an SPE-based analytical method suitable for the determination of common Sudan dyes in chili oleoresin. This application note also presents liquid chromatography using a solid-core analytical column packed with 2.7 μm particles. This type of column allows for efficient separations at lower backpressures and is compatible with both HPLC and UPLC systems. Structures for the dyes used in this study are presented in Figure 2.
Chili oleoresin (capsicum) was obtained from a commercial source. A 0.1 g sample of this resin was dissolved in 1 mL hexane. A Sep-Pak Silica Cartridge (6 cc, 500 mg, p/n WAT043400) was preconditioned with 3 mL hexane) and the diluted sample was loaded. The cartridge was washed with 2 mL hexane and then eluted with 2 mL of 5:95 acetonitrile/dichloromethane. The eluate was then evaporated and reconstituted in 150 μL methanol. A vacuum manifold was used for the SPE with minimal vacuum to achieve a 2 mL/min flow rate through the cartridge for all steps.
LC System: |
ACQUITY UPLC H-Class |
Column: |
CORTECS C18 , 2.7 μm, 2.1 x 100 mm (p/n 186007400) |
Mobile phase A: |
0.1% formic in water |
Mobile phase B: |
0.1% formic acid in methanol |
Injection volume: |
5 μL |
Injection mode: |
Partial loop injection |
Column temp.: |
45 °C |
Weak needle wash: |
10:90 methanol: water (600 μL) |
Strong needle wash: |
Methanol (200 μL) |
Seal wash: |
10:90 acetonitrile: water |
Flow rate: |
0.40 mL/min |
Time |
%A |
%B |
%C |
---|---|---|---|
Initial |
80 |
10 |
10 |
0.5 |
40 |
30 |
30 |
5.0 |
0 |
50 |
50 |
9.0 |
0 |
50 |
50 |
9.1 |
80 |
10 |
10 |
12.0 |
80 |
10 |
10 |
Mass spectrometer: |
Xevo TQD |
Ionization mode: |
Electrospray positive |
Source temp.: |
150 °C |
Desolvation temp.: |
500 °C |
Desolvation gas flow: |
1000 L/hr |
Cone gas flow: |
30 L/hr |
Collision gas flow: |
0.15 mL/min |
Data management: |
MassLynx v4.1 |
Results are presented in Table 2. The Sudan dyes determined in this study include phenolics (such as Sudan I), a polyphenolic (Sudan Orange G), and amines (such as Sudan Black). The Sep-Pak Silica cartridge was chosen for SPE cleanup because it effective retained all ten of the target analyte dyes. Although recoveries generally ranged from 75 to 100%, the recovery of the polyphenolic Sudan Orange G was about 50%. This compound is more strongly retained on the silica SPE cartridge compared with the other dyes. Recovery of this compound is improved by increasing the elution volume or increasing the percentage of acetonitrile in the elution solvent. However, either of those steps led to significantly poorer cleanup with higher amounts of highly colored matrix compounds in the final extract. Figure 3 illustrates the cleanup obtained; the vial at left shows a 150 μL aliquot of the 1.0 mL sample dissolved in hexane prior to SPE, the vial at right after SPE with subsequent reconstitution in 150 μL methanol. Not only does the SPE protocol produce a noticeably cleaner extract, but the extract has been concentrated nearly 7 fold.
The CORTECS 2.7 μm Solid-Core Particle Column gave excellent chromatographic performance; the performance was consistent through over 200 injections in sample matrix. Figure 4 shows a typical analysis of a sample spiked at 100 ng/g (ppb). The analysis was performed on an ACQUITY UPLC H-Class System. This system is not only designed to provide excellent performance at UPLC pressures and flow rates, but also under HPLC conditions, such as were used in this study. Because the column backpressure observed for this study was about 3100 psi, there would be no issue performing this analysis on traditional HPLC instruments with upper pressure limits of 4000 psi or higher. For the analyst desiring true UPLC performance, the separation can be transferred to a CORTECS C18, 1.6 μm Solid-Core Column.
720005070, June 2014