• Application Note

Analysis of Ergot Alkaloids in Cereal Samples by Liquid Chromatography-Tandem Quadrupole Mass Spectrometry

Analysis of Ergot Alkaloids in Cereal Samples by Liquid Chromatography-Tandem Quadrupole Mass Spectrometry

  • Jing Zhang
  • Qiaozhen Guo
  • Bing Shao
  • Zhenxia Du
  • Narendra Meruva
  • Simon Hird
  • Beijing Key Laboratory of Diagnostic and Traceability Technologies for Food Poisoning, Beijing Center for Disease Control & Prevention
  • College of Science, Beijing University of Chemical Technology
  • Waters Corporation

Abstract

This application note describes a method for the determination of 25 EAs in cereals using a rapid and simple sample extraction protocol followed by LC-MS/MS on the ACQUITY UPLC System coupled to Xevo TQ-S.

Benefits

Specific, targeted method for determination of a range of ergot alkaloids in cereal samples that is suitable for both official control and food business operators’ due diligence testing. 

Introduction

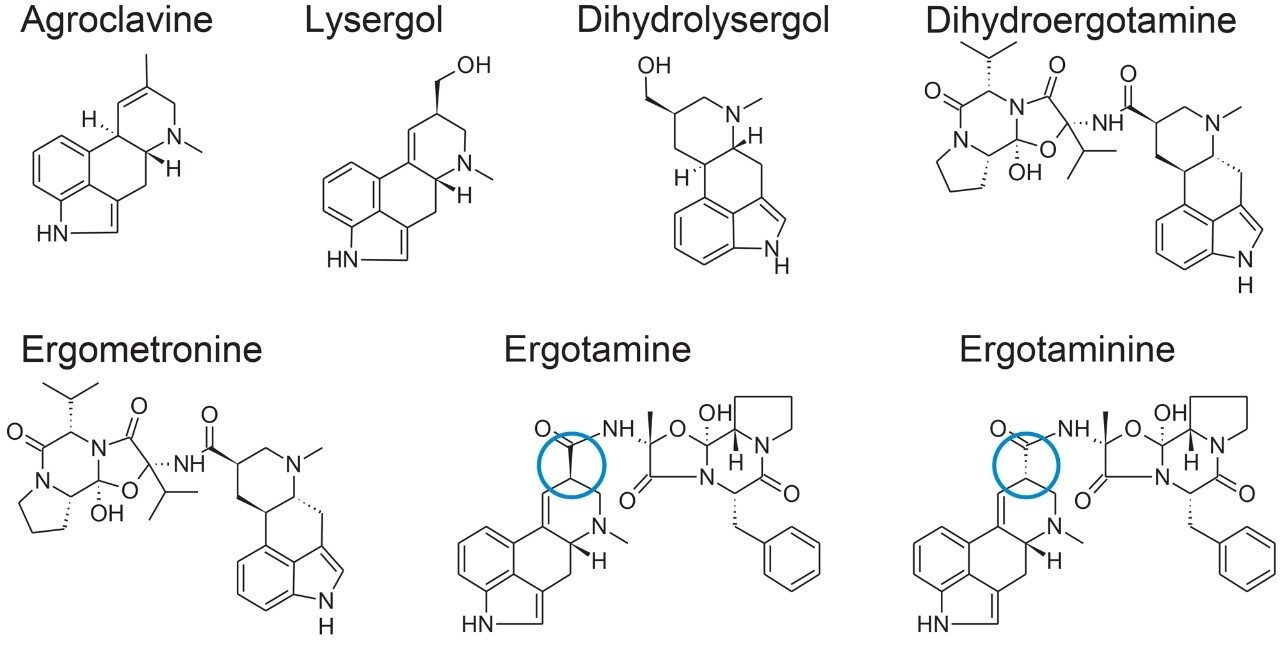
Ergot alkaloids (EAs) are mycotoxins produced by fungi including Claviceps spp. Among the cereal species, rye and triticale that have open florets are known to be especially susceptible, but wheat, barley, oats, and other cereal grains are also potential fungal hosts.1 The fungus replaces the developing grain or seed with the alkaloid-containing wintering body, known as the ergot body or sclerotium. The sclerotia are harvested together with the cereals or grass and can thus lead to contamination of cereal-based food and feed products with EAs. Ingestion of contaminated products can cause a number of harmful effects in humans and livestock. Although ergotism has practically been eliminated as a human disease, it remains an important veterinary problem, particularly in cattle, horses, sheep, pigs, and chicken.2 There are three main classes of EAs: short chain substituted amides of lysergic acid, clavine alkaloids, and ergopeptines, which are peptide EAs comprising (+)-lysergic acid and a tripeptide system containing L-proline. Structures of some of the major EAs are shown in Figure 1, including an example of epimerisation of an ergopeptine at the C8 position to form the corresponding ergopeptinine. Although the ergopeptinines are described as biologically inactive, interconversion can occur under various conditions so analytical methods should include the determination of both epimeric forms.

Figure 1. Representative structures of some of the ergot alkaloids included in this study.

Modern management of ergot is focused on limiting the presence of ergot sclerotia in cereal grain but compliance with maximum levels for ergot sclerotia does not necessarily guarantee the safety of food for the presence of EAs. Currently only a few countries have set limits for the individual EAs in feed (e.g. Canada); but no country has yet set limits in food as most do for other mycotoxins. In 2012, the European Commission started to consider setting maximum levels for EAs as the profile, concentration, and toxicity of EAs and their corresponding epimers vary considerably in different grains and batches of grain.3 New legislation could be agreed upon by the end of 2017. In the meantime, the European Food Safety Authority (EFSA) has recommended that the major ergopeptines and their corresponding epimers be targeted for determination in food and feed to provide data to enable consumer exposure calculations.4 The results of those analyses were used to estimate chronic and acute dietary exposure to EAs in humans and animals in Europe.5 This interest in monitoring is also reflected globally with method development and results of analyses being reported in North America6 and Asia.7 

This application note describes a method for the determination of 25 EAs in cereals using a rapid and simple sample extraction protocol followed by LC-MS/MS on the ACQUITY UPLC System coupled to Xevo TQ-S.

Experimental

All of the cereal samples (rye flour, wheat flour, bread, and noodles) were purchased from local supermarkets and Taobao, the largest internet-based retailer in China. The FAPAS proficiency test sample of EAs in rye flour was obtained from Fera in the UK. The noodles, pasta, and bread were ground and 1.0 g of sample was weighed in a 50 mL polypropylene centrifuge tube, and 10 mL of acetonitrile and 3 mM ammonium carbonate (85:15, v/v) added. After shaking for 30 s, vortexing for 30 s, and centrifuging for 5 min at 9000 rpm below 4 °C, 5 mL of the supernatant was transferred to another tube that contained 150 mg of C18 sorbent  (e.g. WAT035672) for dSPE clean-up. The mixture was vortexed for 30 s and centrifuged for 5 min at 9000 rpm below 4 °C, and  then the upper layer was transferred to a vial for the UPLC-MS/MS analysis.

LC conditions

UPLC system:

ACQUITY UPLC I-Class with FL Sample Manager

Column:

ACQUITY UPLC BEH C18 1.7 μm, 2.1 × 100 mm

Mobile phase A:

3 mM ammonium carbonate (aq.)

Mobile phase B:

Acetonitrile

Flow rate:

0.2 mL/min

Injection volume:

5 μL (partial loop mode from 10 μL loop)

Column temp.:

30 °C

Sample temp.:

4 °C

Run time:

16 min

Gradient:

Time(min)

%A

%B

Curve

0.00

75

25

1.00

60

40

6

5.00

40

60

6

8.00

22

78

6

10.50

10

90

6

11.00

10

90

6

13.00

75

25

6

MS conditions

MS system:

Xevo TQ-S

Source:

Electrospray

Ionization mode:

ESI+

Capillary voltage:

2.5 kV

Desolvation temp.:

500 °C

Desolvation gas flow:

700 L/Hr

Source temp.:

150 °C

Cone gas flow:

150 L/Hr

Cone voltage:

30 V

Collision gas flow:

0.14 mL/min

Nebulizer gas pressure:

7 Bar

Data management

Data were acquired using MassLynx MS Software (v4.1) and processed using TargetLynx XS Application Manager. The selection of MRM transitions and optimization of critical parameters was performed by infusion of individual solutions of all the analytes and evaluation of the data by IntelliStart Software to automatically create acquisition and processing methods. Table 1 summarizes conditions for all MRM transitions including the retention times. The dwell time  was set to 20 ms for each MRM transition.

Table 1. MRM parameters for EAs (quantatitive transitions in bold).

Results and Discussion

Optimization of the LC conditions

The mobile phase composition for the chromatographic separation of the 25 EAs was based on previous work,8,9,10 with minor modifications. Alkaline mobile phases are preferred for the analysis of EAs in order to minimize inter-conversion of the epimers, to avoid protonation, and to improve separation. The flow rate and column temperature were evaluated to obtain the optimum conditions for separation of the EAs with individual ergopeptines eluting immediately before the corresponding ergopeptinines. The resolution was highest when the column was maintained at 30 °C, with the flow rate set to 0.2 mL/min. All 25 EAs were well separated except b-ergocryptine and ergocristine but these can be distinguished by their different MRM transitions.

Optimization of the sample extraction and cleanup steps

Optimization of the sample extraction and cleanup has been previously described.7 An aprotic solvent, acetonitrile, was used to minimize epimerization during extraction. The method was modified from that used by Kokkonen and Jestoi9 but with the introduction of a rapid and cost-effective C18 dSPE cleanup step.

UPLC-MS/MS performance

Excellent sensitivity and selectivity was demonstrated by the response for each of the analyte peaks detected from the analysis of a variety of different cereal samples (see Figure 2). No interfering compounds were detected at the retention times of the analytes in all the tested blank samples.  

Figure 2. Chromatograms showing EAs from analysis of matrix-matched standards of rye flour prepared at 0.1 µg/kg.

To compensate for matrix effects, calculated to be within the range of 78 to 122% in the commodities assessed, matrix-matched standards, at seven concentrations (0.05, 0.10, 0.25, 0.50, 1.0, 2.5, and 5.0 µg/kg), were used for calibration. The response was linear and the correlation coefficients (r) were >0.998 for all EAs tested with residuals <15%. Limits of detection (LOD) and quantification (LOQ) were determined as the analyte concentration corresponding to the mean of 3 and 10 standard deviations (SDs), respectively, of the response measured in an uninfected sample matrix. Although no regulatory limits are set for the content of EAs in food, the results presented in Table 2 indicate that the proposed method would be suitable for the detection of EAs for monitoring purposes.

Table 2. LOD, LOQ, recovery, and repeatability (%RSD) at three concentrations for the 25 EAs in rye flour.
Figure 3. Calibration graphs for a selection of EAs prepared in rye flour extract.

Recovery, repeatability, and accuracy

Recoveries were measured from the analysis of uninfected blank samples (wheat, rye, bread, noodle, and pasta) spiking with  the EAs six times at three different concentrations: 0.1, 0.25, and 1.0 µg/kg. Unlike other mycotoxins regulated in the EU, there  are currently no performance criteria set for the analysis of EAs. Recoveries were within the range 76.5 to 120% with RSDs <15%. A more detailed summary of the performance of the method for the analysis of EAs in rye is shown in Table 2.

Method accuracy was evaluated by measuring the concentration of EAs in a FAPAS proficiency test sample (test no. 22013; EAs in rye flour). The performance of the method was considered “satisfactory” (Z score between +2 and -2) for almost all of the EAs with the exception of that for ergosinine, which was considered “questionable” (Z score between +3 and -3).

Analysis of cereal samples

The method was used to test 123 cereal samples purchased online (15) and at local supermarkets (108), including rye flours (9), wheat flours (52), wheat flour noodles (43), and breads (19). No EAs were detected in the flour samples and related food products purchased from supermarkets. Two rye and three whole wheat flour samples obtained online were found to contain 13 ergopepine and ergopepinine EAs at a concentration range of 1.01 to 593 µg/kg. The analysis of each positive sample was repeated six times  to produce some repeatability data; RSDs were <6%. The profile of EAs varied between samples.

Conclusion

This application note describes the performance of a method for the  analysis of 25 EAs by UPLC-MS/MS, after extraction and dSPE cleanup. The method is simple, time-saving, and inexpensive, providing fast and reliable quantification of EAs in various types of cereal samples. Although no regulatory limits are currently established for the content of EAs in food, these results indicate that the proposed method is likely to be suitable for the determination of EAs for monitoring purposes. Calibration characteristics, linearity, and residuals were excellent over the concentration range studied. This method was successfully validated using replicate spiked blank samples and a FAPAS proficiency test sample of EAs in rye flour and has been used for the surveillance of commercial samples of cereal flours, bread, and noodles in China.

References

  1. Krska R, Crews C. Significance, chemistry and determination of ergot alkaloids: a review. Food Addit. Contam. Part A 2008, 25:722–731.
  2. Coufal-Majewski S, Stanford K, McAllister T, et al. Impacts of cereal ergot in food animal production. Front. Vet. Sci. 2016 3:1–13.
  3. EFSA Panel on Contaminants in the Food Chain (CONTAM). Scientific Opinion on Ergot alkaloids in food and feed. EFSA Journal 2012, 10(7):2798, 158 pp.
  4. European Commission. Commission Recommendation 2012/154/EU of 15 March 2012 on the monitoring of the presence of ergot alkaloids in feed and food.
  5. Tittlemier SA, Drul D, Roscoe M et al. Occurrence of ergot and ergot alkaloids in western Canadian wheat and other cereals. J Agric. Food Chem. 2015, 63: 6644–6650.
  6. EFSA, Arcella D, Gomez Ruiz J, et al. Scientific report on human and animal dietary exposure to ergot alkaloids. EFSA Journal 2017, 15(7):4902, 53 pp.
  7. Guo Q, Shao B, Du Z, et al. Simultaneous determination of 25 ergot alkaloids in cereal samples by ultraperformance liquid chromatography-tandem mass spectrometry. J Agric. Food Chem. 2016, 64:7033–7039.
  8. Krska R, Stubbings G, Macarthur R, et al. Simultaneous determination of six major ergot alkaloids and their epimers in cereals and foodstuffs by LC-MS/MS. Anal. Bioanal. Chem. 2008, 391:563–576.
  9. Kokkonen M, Jestoi M. Determination of ergot alkaloids from grains with UPLC-MS/MS. J Sep. Sci. 2010, 33:2322–2327.
  10. Walker K, Duringer J, Craig AM. Determination of the ergot alkaloid ergovaline in tall fescue seed and straw using a QuEChERS extraction method with high-performance liquid chromatography fluorescence detection. J Agric. Food Chem. 2015, 63:4236–4242.

Acknowledgements

This study was supported by the Science Research Foundation of the Ministry of Science and Technology of the People’s Republic of China  (Grant 2015FY111400).

720006098, October 2017

Back To Top Back To Top