• Application Note

LC-UV-Based Synthetic Peptide Impurity Tracking and Reporting with Compliant-Ready Empower 3 Software

LC-UV-Based Synthetic Peptide Impurity Tracking and Reporting with Compliant-Ready Empower 3 Software

  • Brooke M. Koshel
  • Robert E. Birdsall
  • Ying Qing Yu
  • Waters Corporation

Abstract

In this work, a UPLC-UV-based method is used for determining product purity using Empower 3 Chromatography Data Software (CDS).

This work demonstrates how Empower 3 Software can be easily employed for synthetic peptide impurity tracking in a compliant-ready workflow. Eledoisin was used as a model peptide to demonstrate how acceptance criteria can be used to assess reference sample material and a sample solution. Sample material was identified as having an impurity above the maximum allowed value for individual impurities to demonstrate failure to meet acceptance criteria. Empower reporting can then be used to retrieve and report data. In summary, this work demonstrates how Empower 3 Software offers integrated functionality for processing and reporting synthetic peptide data, thus enabling the assessment of product quality in an efficient, accurate, and compliant-ready manner.

Benefits

  • Integrated tracking and reporting of synthetic peptide impurities using compliant-ready Empower 3 Software
  • Customizable acceptance criteria thresholds based on ICH guidelines and USP standards
  • Integrated reporting of multiple results to readily assess method acceptance criteria

Introduction

The number of peptides in pre-clinical and clinical trials has seen steady growth over the past decade. Where development was previously hindered by factors such as efficient clearance rates and short half-lives, advances in formulation and alternative delivery systems have contributed to a resurgence.1,2 Peptides make up a unique class of pharmaceuticals not readily classified as small molecules or biologics. This becomes especially important in a regulatory framework. The United States Food and Drug Agency (FDA) has revised the definition of a biological product to include a protein (except any chemically synthesized peptide), where the term protein refers to a “defined sequence that is greater than 40 amino acids in size.”3 A chemically synthesized polypeptide must be made completely by chemical synthesis and be less than 100 amino acids in size.3 Effective March 2020, a protein will require submission of an application for a biological product. With this in mind, pursuing a synthetic peptide manufacturing strategy over recombinant strategies may become more appealing in an effort to reduce costs and deliver products to market more quickly.

Analytical characterization and quality control of synthetic peptide products falls into one of four test categories: identification, assay, impurities, and specific tests. Impurities can result from the manufacturing process or from degradation during manufacturing or storage, and are typically determined by HPLC.4-6 Treatment of the HPLC data can suffer from a variety of user-induced pitfalls. Peak area integration, for example, can often be subjective without defined processing methods in place. Also, it is not uncommon to export results to external software for processing, which can introduce transcription errors or incorrect calculations, but can also create an added burden to maintain compliance. Informatics suites that support impurity profiling workflows and offer integrated data analysis options are highly desirable, both for eliminating user error and ensuring compliance.

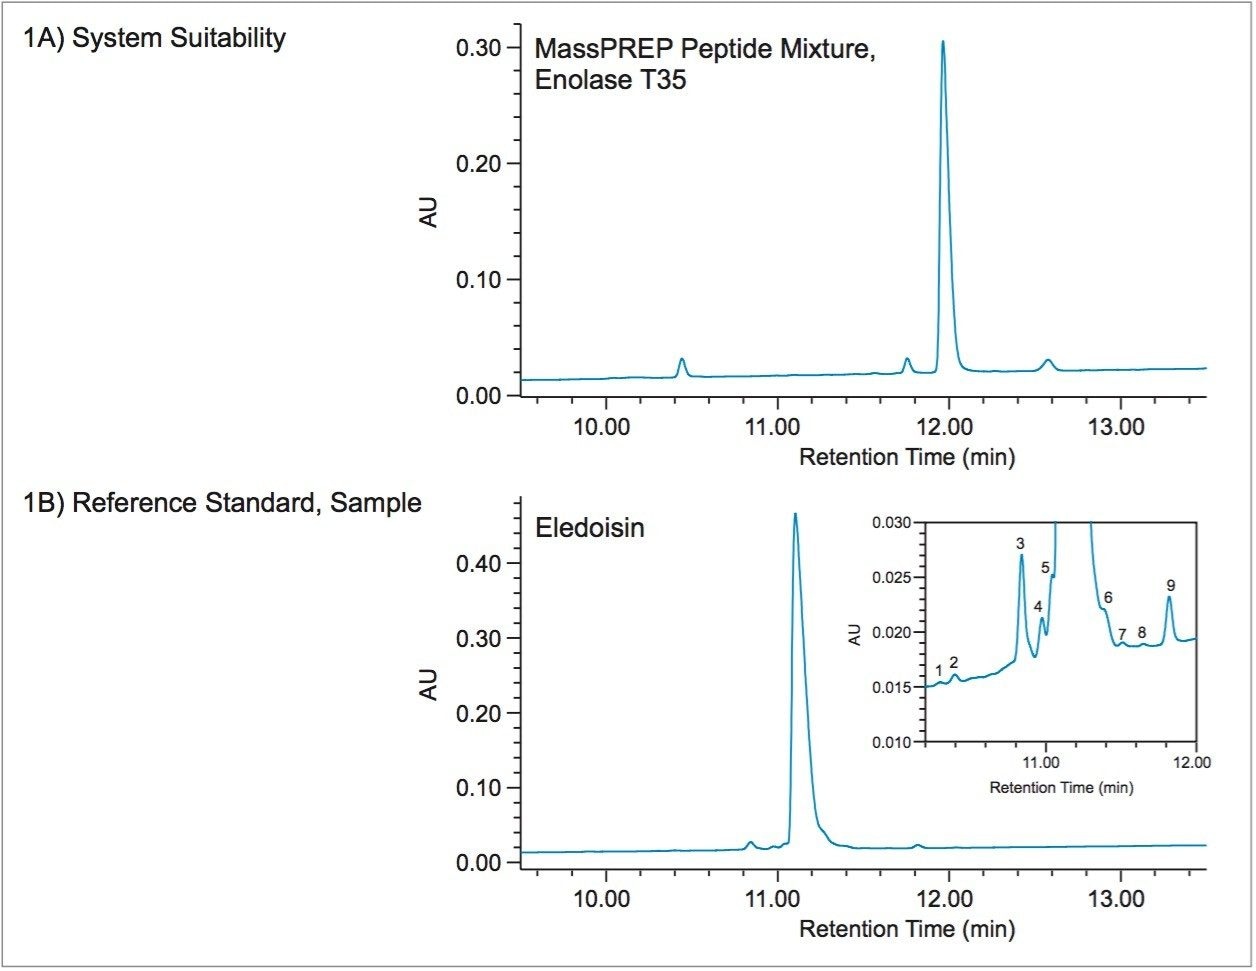
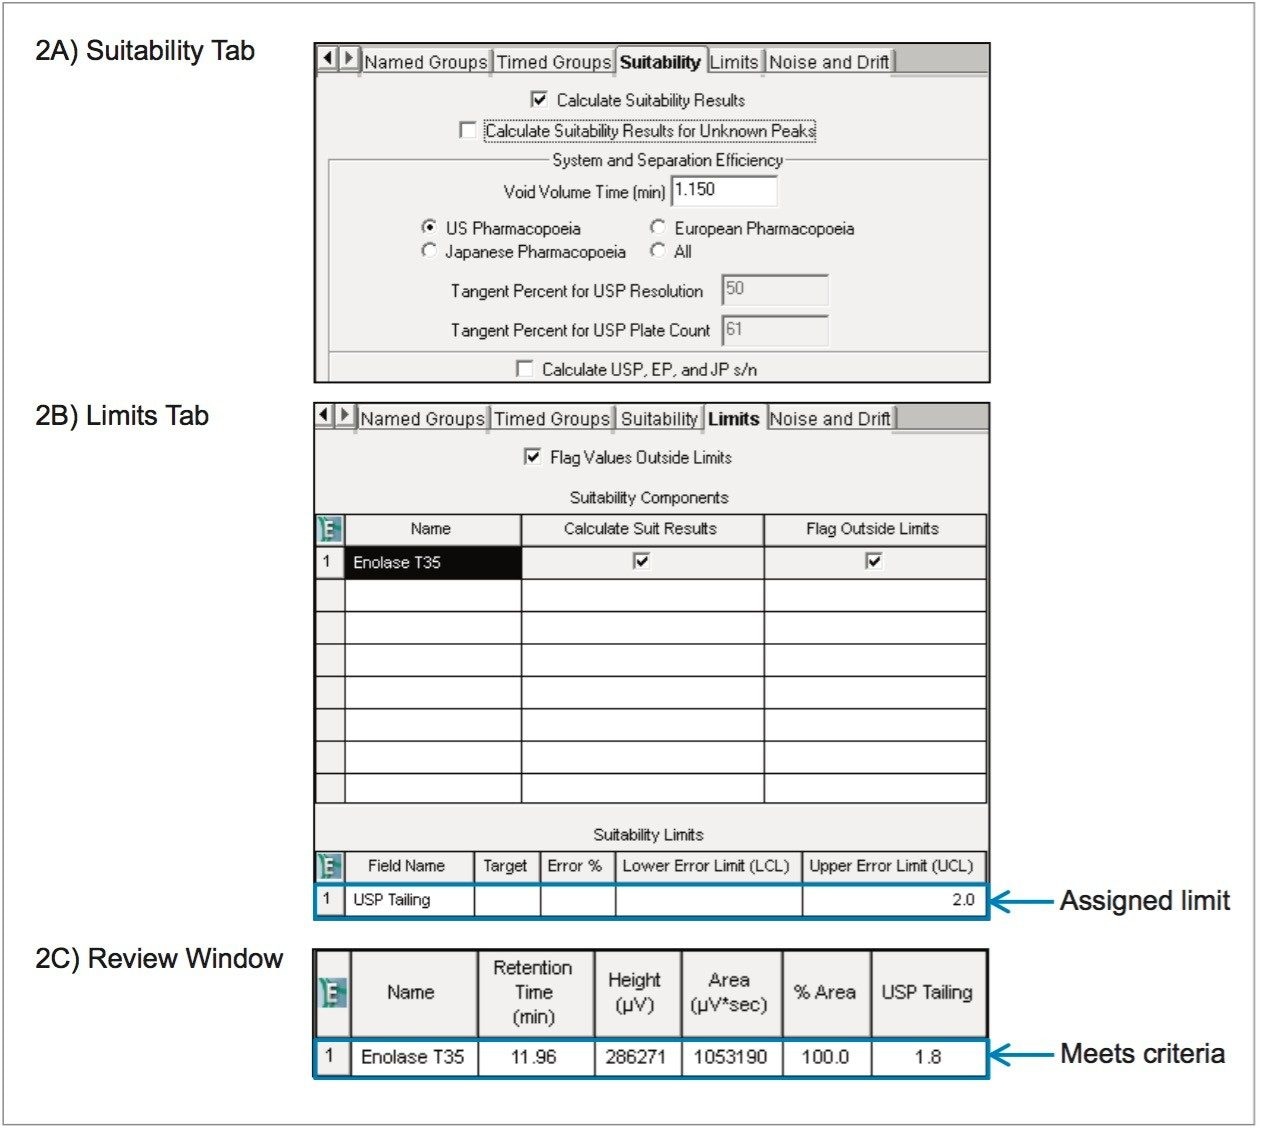
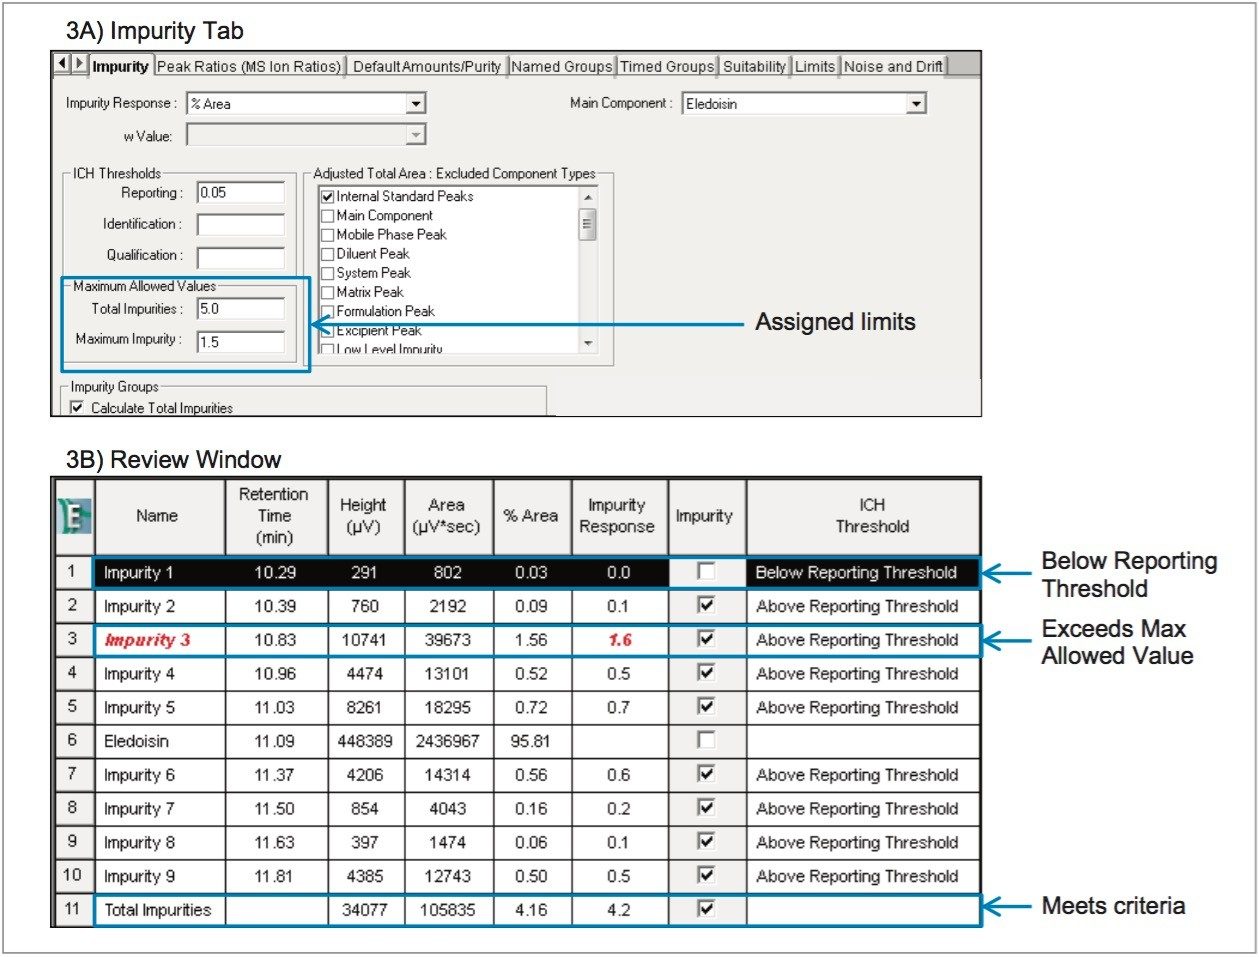
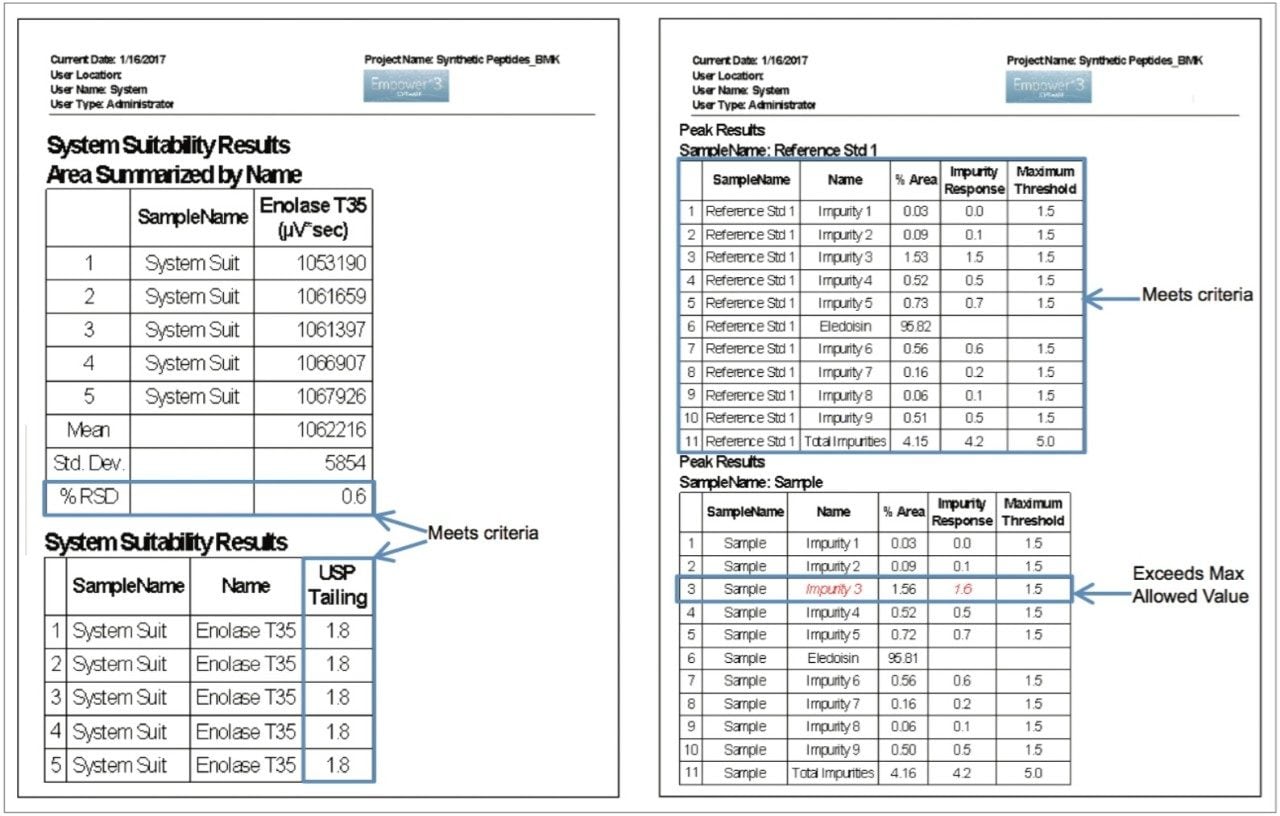
In this work, a UPLC-UV-based method is used for determining product purity in accordance with the International Council for Harmonisation (ICH) and United States Pharmacopeia (USP) functionalities built into Empower 3 Chromatography Data Software (CDS). The peptide used for this study was eledoisin, which is a biologically active peptide that acts as a vasodilator, and is thus used as a clinically relevant model system. Through establishing system suitability and impurity limits within the software, standards or samples not meeting acceptance criteria can be flagged and reported. By developing processing and reporting methods, future  data can be handled in a relatively automated fashion.

Experimental

The synthetic peptide eledoisin (pE-PSKDAFIGLM-amide) was purchased from New England Peptide Inc. (Gardner, MA) at ≥95% purity by HPLC percent area. A stock solution of 2 mg/mL eledoisin in water was further diluted to a working concentration of 0.4 mg/mL. A Waters ACQUITY UPLC Peptide CSH C18 130 Å, 1.7 µm Column was selected for this study based on the high peak capacity separations it can provide for peptides in mobile phases with formic acid ion-pairing.7

LC conditions

LC system:

ACQUITY UPLC H-Class Bio System

Detector:

ACQUITY UPLC Tunable Ultra-Violet (TUV) Detector

Wavelength:

215 nm

Vials:

LCMS Certified Clear Glass 12 x 32 mm Screw Neck Total Recovery Vial (p/n 600000750cv)

Column:

ACQUITY UPLC Peptide CSH C18 130 Å, 1.7 μm, 2.1 mm x 100 mm (p/n 186006937)

Column temp.:

60 °C

Sample temp.:

10 °C

Injection vol.:

5 μL

Mobile Phase A:

H2O with 0.1% (v/v) FA

Mobile Phase B:

Acetonitrile with 0.1% (v/v) FA

Data management:

Empower 3 CDS, SR2

Gradient

Time (min)

Flow rate (mL/min)

%A

%B

%C

%D

Initial

0.200

85.0

15.0

0.0

0.0

2.00

0.200

85.0

15.0

0.0

0.0

22.00

0.200

55.0

45.0

0.0

0.0

22.01

0.200

15.0

85.0

0.0

0.0

24.00

0.200

15.0

85.0

0.0

0.0

24.01

0.200

85.0

15.0

0.0

0.0

30.00

0.200

85.0

15.0

0.0

0.0

Results and Discussion

Verifying assay and instrument performance using Empower 3 system suitability option

Empower 3 Software can be readily tailored to meet user-defined needs. By deploying the system suitability application, the user can verify that both instrument and method requirements are met. To verify performance, a system suitability standard can be used to assess criteria aligned with the FDA.8 In practice, this standard and the associated criteria would undergo careful examination to determine what parameters are appropriate. For our study, more general criteria will be put into place for demonstrative purposes. We recognize the importance of assuring data quality, but we will also assume successful instrument qualification and method validation.9 Because the manufacturing process used to produce synthetic peptides allows for some variation in the final product, a specifically prepared system suitability standard is used. For this study, the Waters MassPREP Peptide Mixture is used as the system suitability standard, with enolase T35 being used to determine suitability.

Figure 1. System Suitability and Reference Standard chromatograms. 1A) Waters MassPREP Peptide Mixture was used as a system suitability solution, where enolase T35 was used to assess if suitability criteria were met. Additional peaks in the chromatogram are peptide fragments that are typical of the sample used. 1B) Eledoisin reference standard solution. Inset shows impurity peaks later used to assess if acceptance criteria is met. Chromatogram is representative of both reference standard solution and sample solution.

A sample set was created with five injections of the system suitability sample at the beginning of the run. The chromatogram for the system suitability standard is shown in Figure 1. To calculate suitability results, this feature must be enabled within the processing method under the Suitability tab (Figure 2A). Suitability results can be calculated according to the United States, European, or Japanese Pharmacopeia. For our example, results are calculated according to the USP. Calculating signal to noise (s/n) in this case is not enabled, as we will select different acceptance criteria parameters. Should the user wish to use s/n as a suitability parameter, detector noise and drift must be enabled in the Noise and Drift tab. Instead, USP Tailing is used with an upper limit set to 2.0, which is selected in the Limits tab (Figure 2B). If peak tailing meets this criterion, the USP Tailing field in the Review window appears in unmodified text (Figure 2C). Should peak tailing exceed this value, it will be flagged in the Review window and appear in red text. 

Capacity factor, resolution, and theoretical plate number are also often used to establish acceptance criteria, but in this case, the default guidelines are less pertinent to our UPLC method.10 A second acceptance parameter will require peak area of the five injections RSD ≤1%, which is in accordance with USP <621>.11 The mean, standard deviation, and RSD can be added as summary calculations and displayed through Empower reporting. By using a component summary, minimum and maximum limits for each of these fields can be incorporated. A final report will be generated after establishing impurity limits for reference standard and sample assessment.

Figure 2. Processing method parameters: calculating system suitability and setting limits. 2A) Suitability tab. Suitability package must be installed and enabled to allow suitability results to be calculated. User must enter an appropriate void volume time, which is needed for capacity factor and selectivity calculations. Results can be calculated according to the United States, European, or Japanese Pharmacopeia. User may also enable s/n calculations if needed. 2B) Limits tab. The Limits tab is used to select which peak(s) is used as a suitability component. The user can then select which parameters are to be used to assess suitability, in this case, USP Tailing is selected with an upper limit of 2.0. 2C) Review window from a single injection of the  system suitability solution. A USP Tailing value of 1.8 meets acceptance criteria. Should peak tailing exceed 2.0, this field would appear in red text. 

Setting maximum allowed values for impurity screening in a reference standard solution and sample solution using Empower 3 impurity tab

Because chemical manufacture of synthetic peptides does not always produce the same impurities from batch to batch, impurities cannot always be easily identified based on relative retention time alone. For this reason, the following acceptance criteria for standard and sample analysis will be used:

Any individual impurity: Not more than (NMT) 1.5%

Total impurities: NMT 5.0%

In practice, more tightly defined acceptance criteria may be used, but these limits are based on the purity of the eledoisin sample. It is also possible to qualify impurities to loosen criteria in a case where a known impurity has been characterized and is known to not be harmful.

Criteria can be built into the processing method through the Impurity tab (Figure 3A). The Impurity Response should be set to % Area with eledoisin selected as the Main Component. The Maximum Allowed Values are those shown above. 

A chromatogram of the eledoisin reference standard is shown in Figure 1B, which is also representative of what a chromatogram of the eledoisin sample would look like. Figure 3B in the Review Window identifies nine impurities that will be reported in the final Empower report. From the view of this chromatogram, Impurity 1 has 0.03% area and is identified as being Below Reporting Threshold in the ICH Threshold field and is not included in Total Impurities. Impurity 3 is below the individual impurity limit for the reference standard, but the sample exceeds 1.5%. Because this value exceeds the maximum allowed value, it is highlighted in red text. Total Impurities is reported as 4.2, which meets the acceptance criteria.

Figure 3. Processing method parameters: setting maximum allowed values for impurity screening of reference standard solution and sample solution. 3A) Impurity tab. Impurity response is determined as peak area percent. ICH Thresholds may be entered, in this case, a reporting limit of 0.05 is used. From the acceptance criteria, any individual impurity is to be NMT 1.5%, and the total impurities must be NMT 5.0% These values are entered into the Maximum Allowed Values fields. The user also has the option of excluding component types from the total area if needed. 3B) Review window from a single injection of the sample solution. From the ICH Threshold field, peaks below the reporting threshold are noted and not included in the total area. Because Impurity 3 (from Figure 1B) exceeds the maximum allowed value for an individual impurity, the value is flagged in red.

Reporting of system suitability, reference standard solution and sample solution peak results using Empower 3 software

Empower 3 reporting can be customized to display data based on a user’s needs. For this example, system suitability results and individual peak tables for the Reference Standard and Sample will be reported to readily highlight any criteria that do not meet specification. Final reporting can be seen in Figure 4. System suitability results show that %RSD for peak area of the five injections is 0.6%, which meets the 1.0% criteria requirement. The acceptance criterion for USP Tailing was set at NMT 2.0, and for each of the five injections peak tailing was 1.8. Tables of peak results can be seen for both the reference standard solution and the sample solution. The reference standard meets criteria for both the total number of impurities as well as the limit of any individual impurity. Impurity 3 in the sample solution exceeds the individual impurity limit and is flagged in red text. Empower 3 Software allows data to be reported in a clear and efficient fashion so that any precautionary actions necessary can be carried out in a more timely manner.

Figure 4. Empower reporting. System Suitability results are summarized to show that both %RSD and USP Tailing criteria are met. The maximum allowable %RSD is recorded in the components summary of the reporting method, and will appear in red text if it is outside of the accepted criteria. All five injections of the System Suitability solution are also shown to meet the USP Tailing requirement of a 2.0 upper limit. Peak results can be summarized to contain data of the user’s choice. Here, % Area, Impurity Response, and the Maximum Threshold are shown. Results are compared for a reference standard solution of eledoisin and a sample solution of eledoisin. The reference standard solution meets both the individual impurity requirement (NMT 1.5%) and the total impurities requirement (NMT 5.0%). The sample solution, however, contains a peak that is outside of the maximum allowed value, which appears in red text.

Conclusion

This work demonstrates how Empower 3 Software can be easily employed for synthetic peptide impurity tracking in a compliant-ready workflow. Eledoisin was used as a model peptide to demonstrate how acceptance criteria can be used to assess reference sample material and a sample solution. Sample material was identified as having an impurity above the maximum allowed value for individual impurities to demonstrate failure to meet acceptance criteria. Empower reporting can then be used to retrieve and report data. In summary, this work demonstrates how Empower 3 Software offers integrated functionality for processing and reporting synthetic peptide data, thus enabling the assessment of product quality in an efficient, accurate, and compliant-ready manner.

References

  1. Uhlig, T. et al. The Emergence of Peptides in the Pharmaceutical Business: From Exploration to Exploitation. EuPA Open Proteomics. 2014; 4: 58–69.
  2. Fosgerau, K., Hoffmann, T. Peptide Therapeutics: Current Status and Future Directions. Drug Discovery Today. 2015; 20(1): 122–128.
  3. HHS, FDA, Biosimilars: Questions and Answers Regarding Implementation of the Biologics Price Competition and Innovation Act of 2009, Guidance for Industry. 2015.
  4. Eggen, I., Gregg, B., Rode, H., Swietlow, A., Verlander, M., Szajek, A. Control Strategies for Synthetic Therapeutic Peptide APIs Part I: Analytical Considerations. -Pharmaceutical Technology. 2014.
  5. Eggen, I., Gregg, B., Rode, H., Swietlow, A., Verlander, M., Szajek, A. Control Strategies for Synthetic Therapeutic Peptide APIs Part II: Raw Materials Considerations. Pharmaceutical Technology. 2014.
  6. Eggen, I., Gregg, B., Rode, H., Swietlow, A., Verlander, M., Szajek, A. Control Strategies for Synthetic Therapeutic Peptide APIs Part III: Manufacturing Process Considerations. Pharmaceutical Technology. 2014.
  7. Lauber, M. A., Koza, S. M., McCall, S. A., Alden, B. A., Iraneta, P. C., Fountain, K. J. High-Resolution Peptide Mapping Separations with MS-Friendly Mobile Phases and Charge-Surface-Modified C18. Analytical Chemistry. 2013; 85: 6936–6944.
  8. HHS, FDA, Analytical Procedures and Methods Validation for Drugs and Biologics, Guidance for Industry. 2015.
  9. USP, General Chapter <1058> Analytical Instrument Qualification, USP39-NF34. Official from December 1, 2016.
  10. FDA, Reviewer Guidance, Validation of Chromatographic Methods. 1994.
  11. USP, General Chapter <621> Chromatography, USP39-NF34. Official from December 1, 2016.

720005968, April 2017

Back To Top Back To Top