• Application Note

Multiresidue Analysis of Pesticides in Fruits and Vegetables Using UPLC-MS/MS

Multiresidue Analysis of Pesticides in Fruits and Vegetables Using UPLC-MS/MS

  • Dimple D. Shah
  • Narendra Meruva
  • Gareth E. Cleland
  • Waters Corporation

Abstract

In this application note, we describe the development of a multi-residue method for the routine determination of 190 pesticide residues in various fruit and vegetable matrices using UPLC-MS/MS. 

Benefits

  • Multi-residue method for 190 pesticides in fruit and vegetable commodities showing excellent recoveries and precision at or below EU MRL
  • Detection of incurred residues confirmed in compliance with SANTE 11945/2015 guidelines
  • Method readily extendable for additional pesticides of interest, using DisQuE variations, MS/MS method database, and easily updated reporting criteria

Introduction

Pesticides are widely used in agricultural farming across the world. Pesticide residue levels in food products are regulated and closely monitored. Most countries have established legislation imposing Maximum Residue Limits (MRLs) for pesticide residues in food commodities which require analytical techniques that are sensitive, selective, accurate, and robust. Multiresidue analysis is challenging due to the low limits of detection required to achieve MRL compliance for a diverse range of pesticides in a wide range of food commodities. There are currently in excess of 1000 pesticides commercially available, and laboratories are under increasing pressure to widen the scope of their analytical methods for routine pesticide monitoring. 

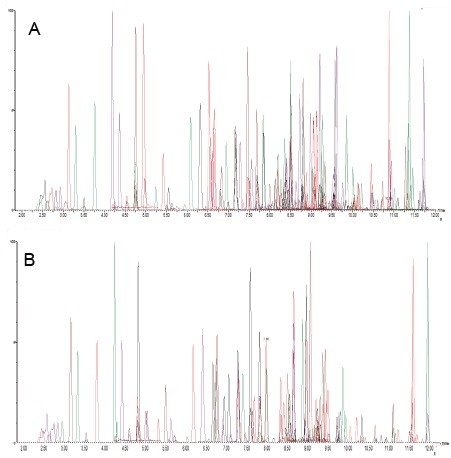
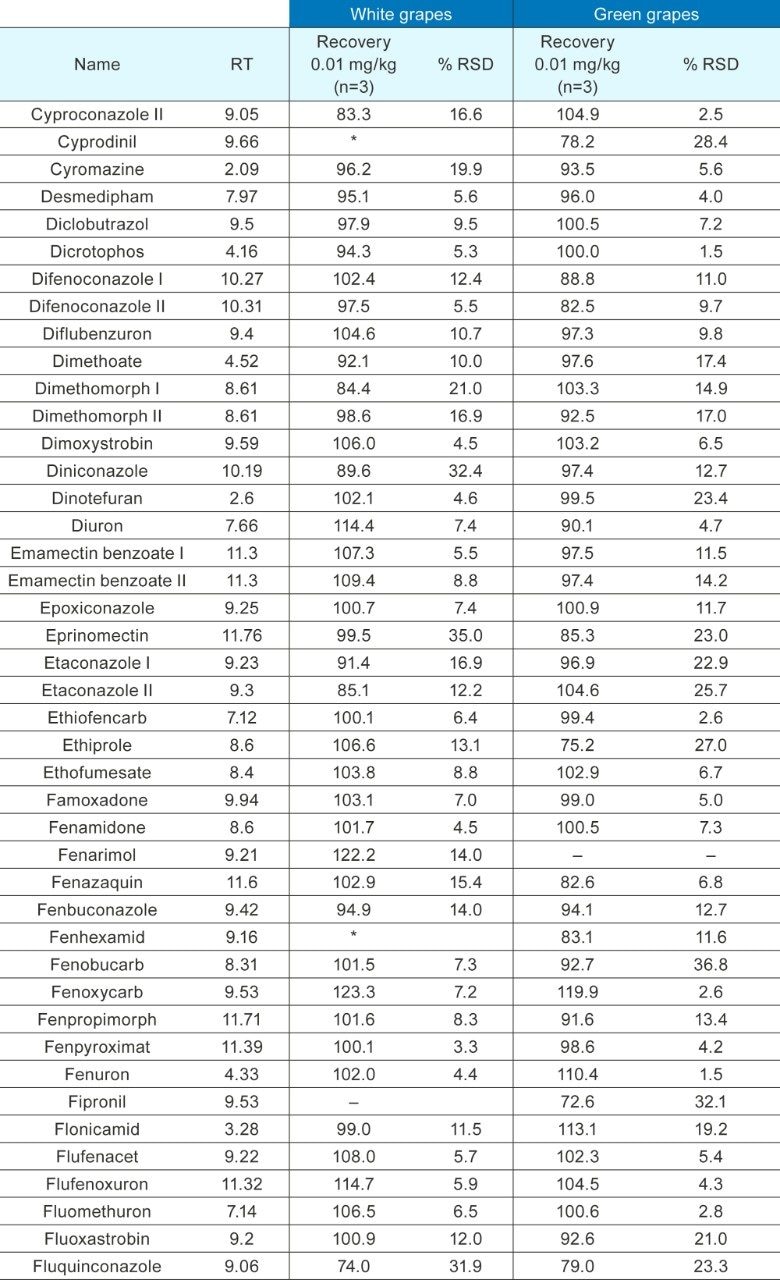
In this application note, we describe the development of a multiresidue method for the routine determination of 190 pesticide residues in various fruit and vegetable matrices using UPLC-MS/MS. White grapes and green beans were selected for this application due to their relatively increased complexity, since they contain chlorophylls which are known to affect the extraction efficiency of pesticides from food matrices. A generic QuEChERS sample extraction procedure was used to extract the pesticides from the fruit and vegetable samples, followed by rapid and high resolution UPLC separation and trace level detection of pesticides using the Xevo TQ-S micro.

Experimental

UPLC Conditions

LC system:

ACQUITY UPLC H-Class

Column:

ACQUITY BEH C18 1.7 μm, 2.1 x 100 mm

Column temp.:

45 °C

Injection volume:

10 μL

Flow rate:

0.45 mL/min

Mobile phase A:

10 mM Ammonium acetate (pH 5) in water

Mobile phase B:

10 mM Ammonium acetate (pH 5) in methanol

Weak needle wash:

50/50 Water/methanol (v/v)

Strong needle wash:

10/90 Methanol/water (v/v)

Seal wash:

90/10 Water/methanol

Gradient

Time (min)

Flow rate (mL/min)

%A

%B

Curve

Initial

0.45

98

2

6

0.25

0.45

98

2

6

12.25

0.45

1

99

6

13

0.45

1

99

6

13.01

0.45

98

2

6

17

0.45

98

2

6

MS Conditions

MS system:

Xevo TQ-S micro

Ionization mode:

ESI+

Capillary voltage:

1.00 kV

Desolvation temp.:

500 °C

Desolvation gas flow:

1000 L/Hr

Source temp.:

150 °C

Two MRM transitions for each compound were obtained from the Quanpedia Database1 which contains a compendium of methods, and monitored for all of the pesticides that were studied. The data were acquired and processed using MassLynx MS Software v.4.1 with TargetLynx XS Application Manager. 

Standards

Restek LC Multiresidue Pesticide Kit (Catalog #31971) was used to make a mix of calibration standards. The stock solution of 10 µg/mL was prepared by combining 100 µL from each ampoule.

Sample Description

The green beans and white grape samples investigated in this study were purchased from a local supermarket.

Sample Preparation

15 g of homogenized samples were extracted with 15 mL of 1% glacial acetic acid in acetonitrile, followed by the addition of QuEChERS AOAC material (DisQuE Pouches, p/n 186006812). The tube was shaken for 1 minute and centrifuged at 3700 rpm for 5 minutes. Then 100 µL of the extract was taken and diluted to 1 mL with water before LC-MS/MS analysis.

To study linearity, solvent and matrix matched standards (MMS) calibration curves were created by spiking the pesticide mix from 0.01 to 0.50 mg/kg (1 ppb to 500 ppb) in solvent and the matrices, respectively.

Results and Discussion

All pesticides were analyzed on an ACQUITY UPLC BEH C18 Column. For each pesticide, two MRM transitions were monitored, and AutoDwell was applied. AutoDwell is a feature used in MassLynx Software to ensure that sufficient points across each chromatographic peak are achieved. A user simply enters the average peak width and number of points required, and the software automatically calculates the dwell time required to achieve the minimum number of points across the peak specified. With the rapid acquisition rate of the Xevo TQ-S micro, 380 MRMs were monitored with a 1 minute wide retention time window with at least 12 data points across the peak. False negatives are potentially avoided by extending the acquisition range. 

Figure 1 shows an overlay of chromatograms (vertically linked) for all pesticides spiked at 10 ppb (0.01 mg/kg) in the green beans and white grapes.

Figure 1. Total ion chromatogram of pesticides in A) green beans, and B) white grapes.

Linearity

Linearity was studied with nine different levels of matrix-matched standards calibration. The concentrations of the calibration levels ranged from 1 to 500 ppb (sample equivalent to 0.001 to 0.5 mg/kg). A majority of the compounds (96%) showed a linear response with correlation coefficients >0.990 in both matrices. Example calibration curves of imidacloprid in white grapes and pyraclostrobin in green beans are shown in Figure 2.

Figure 2. Matrix matched calibration curve of A) imidacloprid in white grapes, and B) pyraclostrobin in green beans.

Recovery

Method recovery was evaluated by spiking the reference standards in the samples and quantifying against the matrix-matched calibration curve. Green bean and white grape samples were pre-spiked with all of the pesticides at 10 ppb (0.01 mg/kg) in triplicate. The samples were extracted and quantified against the matrix matched calibration curve. Recoveries were calculated using TargetLynx XS Software. Recoveries for most of the pesticides (97% in white grapes and 96% in green beans) fell within the acceptable tolerance of 70% to 120% range (DG SANTE/11945/2015)in both samples. The precision in terms of %RSD for most compounds (93%) in green beans and white grapes were less than 20%. The use of a suitable internal standard will significantly improve repeatability for those analytes. Recoveries for all the pesticides in green beans and white grapes are shown in Appendix A. 

Sample Analysis

To determine incurred residues, the white grape and green bean samples were prepared as described in the Sample preparation section and analyzed. From the obtained results, carbendazim, propamocarb, and pyrimethanil were observed in the green bean sample and quantified below 0.07 mg/kg. Boscalid, cyprodinil, fenhexaid, imidacloprid, methoxyfenozide, pyraclostrobin, and trifloxystrobin were observed in the grape sample and quantified at less than 0.25 mg/kg. For accurate quantification of incurred residues, a standard addition technique can be employed. Figure 3 shows an example of an incurred residue found in the green bean sample.

Figure 3. Carbendazim identified in the green bean sample.

In order to avoid false identification, it is important to check the retention time tolerance and ion ratios of the incurred residues. TargetLynx automatically calculates ion ratios and provides accurate quantification for all incurred residues. All of the incurred pesticide residues detected in the green bean and white grape samples were identified in accordance with the criteria specified in the European Commission SANTE document 11945/2015,2 [retention time (± 0.1 minute) and ion ratios (<30%)] and compared against the reference.

Conclusion

  • A broad range of pesticides (190) of interest were successfully analyzed using an easy sample preparation procedure (QuEChERS) and UPLC-MS/MS determination in green bean and white grape samples
  • This method can easily detect all of the listed pesticides at 0.01 mg/kg which is at or below the maximum residue level limit (MRL)
  • More than 95% of the pesticides were detected with recoveries within the range of 70% to 120% using a QuEChERS extraction procedure
  • TargetLynx Application Manager provides efficient and automated data processing tools for calculating recoveries and quantification of incurred residues

References

  1. Quanpedia Database: A Compendium of Compounds and Analyses for Rapid and Simple Multi-Residue LC-MS/MS Method Development. Waters Application Brief, 2012, 720004400.
  2. Guidance Document on the Analytical Quality Control and Method Validation Procedures for Pesticides Residues Analysis in Food and Feed.
  3. SANTE/11945/2015: http://ec.europa.eu/food/plant/docs/pesticides_mrl_guidelines_wrkdoc_11945.pdf.

Appendix A

720006039, Revised December 2020

Back To Top Back To Top