• Application Note

LC-MS/MS Quantification of Intact Insulin-Like Growth Factor I (IGF-I) in Serum

LC-MS/MS Quantification of Intact Insulin-Like Growth Factor I (IGF-I) in Serum

  • Nikunj Tanna
  • Mary E. Lame
  • Mark D. Wrona
  • Erin E. Chambers
  • Waters Corporation

For research use only. Not for use in diagnostic procedures.

Abstract

The novel work described here provides a simple and cost effective sample preparation workflow and LC-MS/MS method, which uses mixed-mode solid-phase extraction (SPE) in a 96-well format and analytical scale LC with a sub-2-um column coupled to a high-performance tandem quadrupole TQ-XS, for the accurate and robust quantification of intact IGF-I, achieving LLOQ’s of 5 ng/mL.

Benefits

  • Direct quantification of intact IGF-I using a Tandem MS
  • Simple, selective and fast sample preparation using Oasis mixed-mode SPE in μElution format, without timeconsuming affinity purification
  • Quantification without sample digestion
  • High sensitivity and accuracy using Xevo TQ-XS Mass Spectrometer
  • CORTECS UPLC Columns for high sensitivity and narrowest peak widths

Introduction

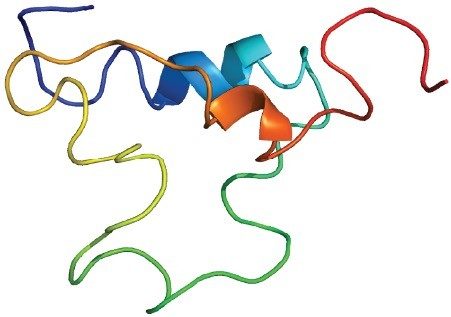
Insulin-like growth factor I (IGF-I) is a 7.6 kDa protein with 3-internal disulfide bonds (Figure 1). It’s secreted by the liver and plays a significant role in mediating the effects of growth hormone (GH).1 Depending on age, gender, and state of health, serum levels can range from 15–750 ng/mL.2 To date, IGF-I quantification is largely performed with immunoassays, such as ligand-binding assays (LBAs). In the past few years, LC-MS/MS for peptide/protein quantification has steadily increased, due to the many benefits it affords, such as shorter development times, high accuracy and precision, multiplexing ability, high analytical selectivity, and ability to readily distinguish between closely related analogues or endogenous interferences. 

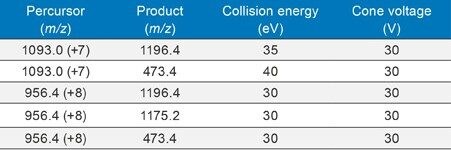
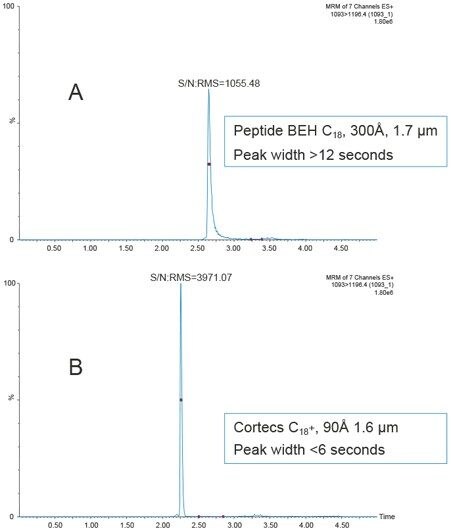
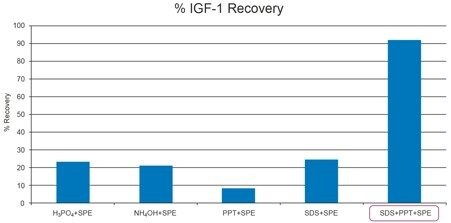
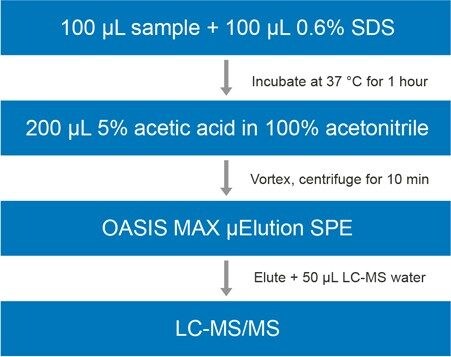
LC-MS-based approaches are not without their challenges. Larger  peptides and proteins, such as IGF-I, can be particularly difficult to analyze by LC-MS/MS, as analytical sensitivity may be low due to poor ionization, insufficient transfer into the gas phase, or poor fragmentation. In addition, IGF-I suffers from non-specific adsorption and strong protein binding, making development of a sample preparation and LC method difficult. A few LC-MS methods do exist; however, these workflows employ either immunoaffinity, enzymatic digestion, nano-flow LC or a combination thereof.2 While these MS workflows offer a viable alternative to standard IGF-I immunoassays, the use of digestion and/or affinity purification make sample preparation complex and laborious, while also adding extra cost to the analysis. The novel work described here provides a simple and cost effective sample preparation workflow and LC-MS/MS method, which uses mixed-mode solid-phase extraction (SPE) in a 96-well format and analytical scale LC with a sub-2-µm column coupled to a high-performance tandem quadrupole TQ-XS, for the accurate and robust quantification of intact IGF-I, achieving LLOQ’s of 5 ng/mL for clinical research.

Figure 1. Insulin-like growth factor I (IGF-I) structure.1

Experimental

Sample preparation

Step 1: Pretreatment and protein precipitation (PPT)

100 µL of mouse plasma and human serum was spiked at various concentrations (5–1,000 ng/mL) with IGF-I (human sequence; Cell Sciences Inc., Cat#CU100). Samples were pretreated with 100 µL of 0.6% sodium dodecyl sulphate (SDS) and incubated for 60 minutes at 37 °C. Following SDS treatment, samples were precipitated with 200 µL of acetonitrile containing 5% acetic acid and centrifuged for 10 minutes at 18,000 G. A 300 µL aliquot of the resulting supernatant was transferred to a 2-mL 96-well plate containing 900 µL of 5% concentrated NH4OH in water (v:v) and mixed.

Step 2: SPE using an Oasis MAX μElution 96-well Plate

Condition:

200 μL methanol

Equilibrate:

200 μL water

Load sample:

Entire diluted PPT supernatant was loaded onto the extraction plate in two steps of ~600 μL each

Wash 1:

200 μL of 5% NH4OH in water

Wash 2:

200 μL 5% methanol containing 1% acetic acid in water

Elute:

2 x 25 μL 60:30:10 methanol/water/acetic acid

Dilute:

50 μL water

LC conditions

LC system:

ACQUITY UPLC I-Class

Detection:

Xevo TQ-XS Mass Spectrometer, ESI+

Column:

CORTECS UPLC C18+, 90Å, 1.6 μm, 2.1 mm x 50 mm

Temp:

60 °C

Sample temp:

5 °C

Injection vol.:

10 μL

Mobile phases:

A: 0.1% Formic acid in H2O

B: 0.1% Formic acid in ACN

Gradient

Time (min)

Flow rate (mL/min)

%A

%B

Curve

0.0

0.400

95

5

6

2.5

0.400

70

30

6

3.5

0.400

50

50

6

3.6

0.400

5

95

6

4.0

0.400

5

95

6

4.1

0.400

95

5

6

5.0

0.400

95

5

6

Data management

LC-MS software:

MassLynx (v4.2)

Quantification Software:

TargetLynx

MS conditions

Capillary:

1.0 kV

Source offset:

30 V

Source temp.:

150 °C

Desolvation temp.:

500 °C

Cone gas flow:

150 L/Hr

Desolvation gas flow:

800 L/Hr

Collision gas flow:

0.15 mL/Min

Nebulizer gas flow:

7 Bar

Results and Discussion

During method development, careful and systematic evaluation of all steps in sample preparation was critical to overcome issues of non-specific adsorption, strong protein binding, poor solubility, and ensure high recovery of IGF-I. Use of novel charged-surface chromatographic column produced narrow peak widths and reduced peak tailing improving overall chromatographic performance versus a traditional C18 column. Poor MS sensitivity, resulting from the size of the molecule and poor fragmentation due to presence of disulphide bonds, were mitigated by fine-tuning MS parameters, while selection of precursor and product ions with high m/z imparted specificity to the assay. 

Mass Spectrometry

LC-MS/MS quantification was performed using the Xevo TQ-XS tandem-quadrupole MS (ESI+). Several multiply charged precursors were observed for IGF-I. The 7+ and 8+ charge states precursors of IGF-I at m/z 1093.0 and 956.4 were the most intense and more importantly, yielded several selective b/y fragment ions which could be used for quantitative analysis. The MRM transition using the 1093.0 (7+) precursor and 1196.4 fragment was chosen as the primary transition for quantification. The 8+ precursor at 956.4 and the same 1196.4 fragment transition was used as a confirmatory transition. Optimized MS conditions and MRM transitions used for IGF-I analysis are listed in Table 1. 

Although many peptides and proteins produce intense fragments below m/z 200, these ions (often immonium ions) result in high background in extracted samples due to their lack of specificity. In this assay, the use of highly specific b/y ion fragments above m/z 1100.0 yielded significantly improved specificity, facilitating the use of simpler LC and SPE methodologies.

Table 1. Final MS conditions used for IGF-I analysis. 

Liquid Chromatography

Chromatographic separation was achieved using an ACQUITY UPLC I-Class System and CORTECS UPLC C18+, 90 Å, 1.6 µm, 2.1 mm x 50 mm Column and 0.1% formic acid in water and acetonitrile. Unlike small molecules, larger peptides and small proteins, suffer from poor mass transfer in and out of fully-porous particles. Thus, use of a sub-2-µm solid-core CORTECS C18+ Column, with its low level positive surface charge, provided significantly narrower peak widths (<6 seconds) than a traditional C18 column  (>12 seconds) and resulted in 4-fold improvement in S/N, improving limits of quantification and precision of the assay. This chromatographic performance is demonstrated in Figure 2.

Figure 2. Comparison of peak shape obtained using (A) traditional ACQUITY UPLC BEH C18 Column or (B) CORTECS C18+ Column for IGF-I. Gradient conditions and column dimension (2.1 x 50 mm) are identical.

Sample Preparation

During method development, poor recovery and reproducibility issues of IGF-I were found to be related to non-specific adsorption, protein binding, and solubility which are common issues to most peptide/protein LC-MS methods. Careful and systematic evaluation of various pretreatment options, as well as careful attention to wash and elution solutions, was critical to the overall SPE recovery and specificity of this method. 

Circulating IGF-I binds very strongly to its binding partner, Insulin-like Growth Factor Binding Protein (IGFBP). Effectively disrupting this binding and preventing reformation of this complex during sample preparation was crucial for successful IGF-I recovery in serum/plasma. Prior to sample extraction, IGF-II, which also binds strongly to IGFBP, was added in excess to prevent IGF-I-IGFBP complex reformation. Various serum pretreatment options were evaluated. Treatment with acid, base, denaturing reagents, and protein precipitation (PPT) alone, or in combination were tested. Traditional pretreatment options with acid, base or PPT with acetonitrile containing 5% acetic acid failed to yield IGF-I recovery greater than 30%. Additionally, precipitation of IGF-I with ratios >1:1 of organic (data not shown) resulted in even lower recovery, due to the undesired precipitation of IGF-I. Pretreatment with the denaturant, sodium dodecyl sulphate (SDS) also resulted in poor recovery (<30%); however SDS denaturation followed by a 1:1 PPT with acetonitrile effectively disrupted protein binding and resulted in >95% IGF-I recovery  prior to SPE (data not shown). Following SDS pretreatment and subsequent PPT, a mixed-mode µElution SPE clean-up strategy with OASIS MAX was employed. IGF-I recovery using the various sample pretreatments in combination with SPE is illustrated in Figure 3. Final sample pretreatment and SPE conditions are described in the experimental section and are illustrated in Figure 4. Total IGF-I recovery (SDS pretreatment, PPT, and SPE) using the described protocol was >90%. Use of a 60% methanol containing 10% acetic acid SPE elution solution was required to fully elute IGF-I, maintain its solubility, and minimize interferences from the serum matrix. In addition to high IGF-I recovery, use of SPE in the µElution format successfully removed the non-MS friendly SDS salt, ultimately improving sensitivity and ensuring system robustness. 

Figure 3. % IGF-I recovery using various sample pretreatment and mixed-mode (Oasis MAX) µElution SPE.
Figure 4. IGF-I final sample preparation workflow.

Linearity, Precision, and Accuracy

Using only 100 µL of serum and the aforementioned sample preparation strategy, quantification limits of 5 ng/mL of IGF-I (human sequence) was achieved in mouse plasma. Calibration curves, in both mouse plasma and human serum, were linear with r2 values >0.99 (1/x2 weighted regression) with mean accuracies of and 101.76, and 99.98, respectively. A summary of standard curve performance is shown in Table 2. In addition, precision and accuracy for both the mouse and human QC samples was excellent with mean % RSDs all <7% and QC accuracy ranges of 93.9–107.7. QC performance is highlighted in Tables 3 (mouse) and 4 (human). Demonstration of QC chromatographic performance is illustrated in Figure 5, Panels A (mouse) and B (human). Endogenous IGF-I human serum level was calculated to be 26.81 ng/mL and is shown in Table 4 and is also illustrated in Figure 5, panel B. 

Table 2. Linear dynamic range and standard curve statistics for IGF-I extracted from mouse and human serum. 
Table 3. Mouse serum IGF-I QC statistics.
Table 4. Human serum IGF-I QC statistics. 
Figure 5. Representative IGF-I chromatograms in mouse (A) and human (B) sera using the 1093.0 >1196.4 MRM transition.

Conclusion

The method described employs a simple pretreatment and SPE sample preparation strategy combined with analytical flow LC and tandemquadrupole MS for the direct analysis and quantification of intact IGF-I from serum/plasma for clinical research.

  • Sample preparation with simple SPE was <1.5 hours, which is 3X faster than the complex sample preparation with protein digestion or affinity chromatography.
  • Protein dissociation followed by PPT and a mixed-mode SPE strategy with OASIS MAX, effectively removes denaturant reagents, and improves sensitivity, specificity, and assay robustness.
  • Use of a solid core, sub-2-μm CORTECS C18+ Column provided excellent chromatographic performance with a 2-fold reduction in peak width and 4-fold improvement in S/N.
  • Low LLOQ’s were achieved without the use of nano-flow LC, increasing robustness and reproducibility of the assay.
  • The analytical sensitivity (5 ng/mL), linear dynamic range (5–1,000 ng/mL), and excellent reproducibility of the method described reliably measures low endogenous and elevated levels of IGF-I.

References

  1. Filipe Lopes, David A. Cowan, Mario Thevis, Andreas Thomas, and Mark C. Parkin; Quantification of Intact Human Insulin-Like Growth Factor-I in Serum by Nano-Ultrahigh-Performance Liquid Chromatography/Tandem Mass Spectrometry; Rapid Commun. Mass Spectrom. 2014, 28, 1426–1432.
  2. Martin Bidlingmaier, Nele Friedrich, Rebecca T. Emeny, Joachim Spranger, Ole D. Wolthers, Josefine Roswall, Antje Körner, Barbara Obermayer-Pietsch, Christoph Hübener, Jovanna Dahlgren, Jan Frystyk, Andreas F. H. Pfeiffer, Angela Doering, Maximilian Bielohuby, Henri Wallaschofski, and Ayman M. Arafat; Reference Intervals for Insulin-like Growth Factor-1 (IGF-I) From Birth to Senescence: Results From a Multicenter Study Using a New Automated Chemiluminescence IGF-I Immunoassay Conforming to Recent International Recommendations; J Clin Endocrinol Metab, May 2014, 99(5):1712–1721.

720006097, December 2017

Back To Top Back To Top