This work discusses the utility of UltraPerformance Liquid Chromatography (UPLC)-based Process Analytical Technology (PAT) systems for monitoring continuous flow reactions locally in near real time. This technology provides rich process understanding, which facilitates rapid and informed decision making.
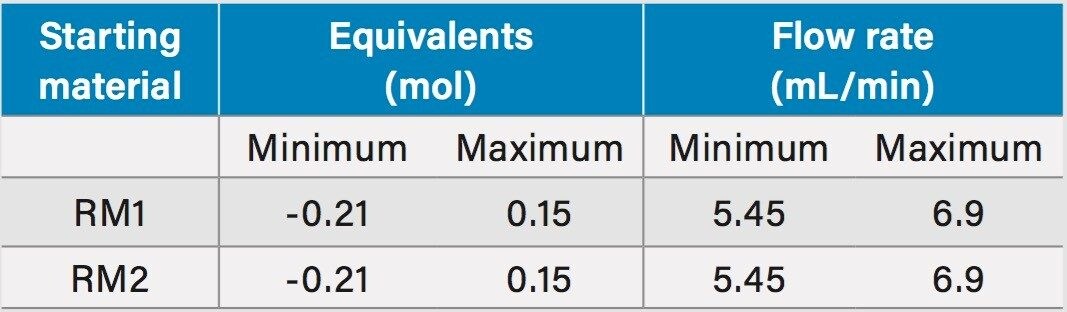
Many pharmaceutical companies are turning to continuous flow chemistry processes over batch chemistry. The benefits of continuous flow reactions include improved product throughput, increased yield, easier process scalability, better temperature control, and a safer manufacturing process. For pharmaceutical and biopharmaceutical companies PAT is a critical component of manufacturing. It is relied upon to provide richer process understanding, consistent product quality with maximum yields, and minimal waste. When the formations of impurities are kept to a minimum, the need of isolation or purification steps on the final product may be avoided. As part of flow reaction development it is important that the process parameters are fully optimized with respect to temperature, pressure, and reactant stoichiometry and the impurity profile obtained is fully understood.
Reaction monitoring by on line spectroscopic techniques such as Raman, near-infrared (NIR) and infrared (IR) are often used because they do not disrupt the process and require little direct intervention. These techniques have the ability to provide real-time information about the reaction progression but suffer from lack of selectivity and produce little quantitative information about intermediates and low level impurities.
High performance liquid chromatography (HPLC) is a more selective and sensitive technique and has the ability to provide quantitative information. It is the most widely used analytical technique in pharmaceutical laboratories. The long run times and complex system operation have historically prevented it from being routinely used for atline or online analysis.
By utilizing online UPLC, quantitative information can be revealed about the final product and low-level impurities in a much shorter time frame while enabling quick changes of process parameters to identify those critical to optimizing flow reaction. This greater understanding of a reaction improves the scale-up process to manufacturing and ensures maximum yield and purity.
Configurable and scaleable, the PATROL UPLC Process Analysis System provides access to real-time, chromatographic-quaity analysis for in-process samples. It is designed for online and/or atline UPLC analysis during process development and can be used to monitor the scale up of the flow reaction from benchtop scale, to pilot scale, through to the final manufacturing scale. It also has the benefits of managing sample specific dilutions in a programmable workflow to provide quantitative results. It can, from a single standard vial, generate multi-point calibration curves with Empower 3 Software. Workflows (sample sets) can be programmed to ensure that system preparation and analyses are performed consistently.
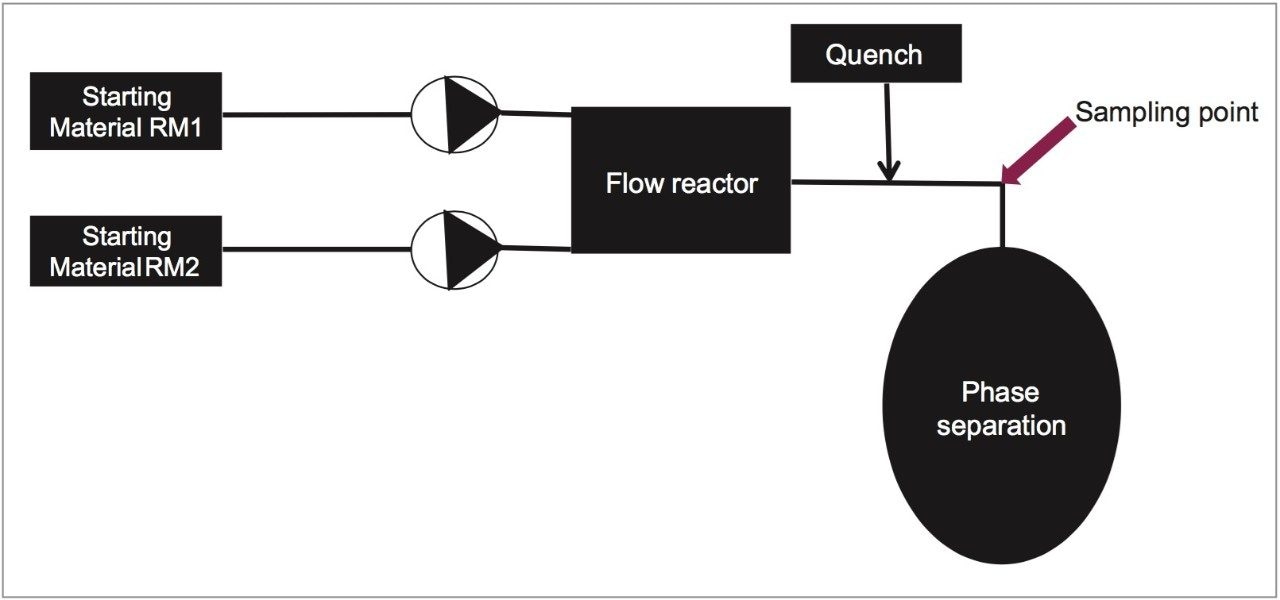
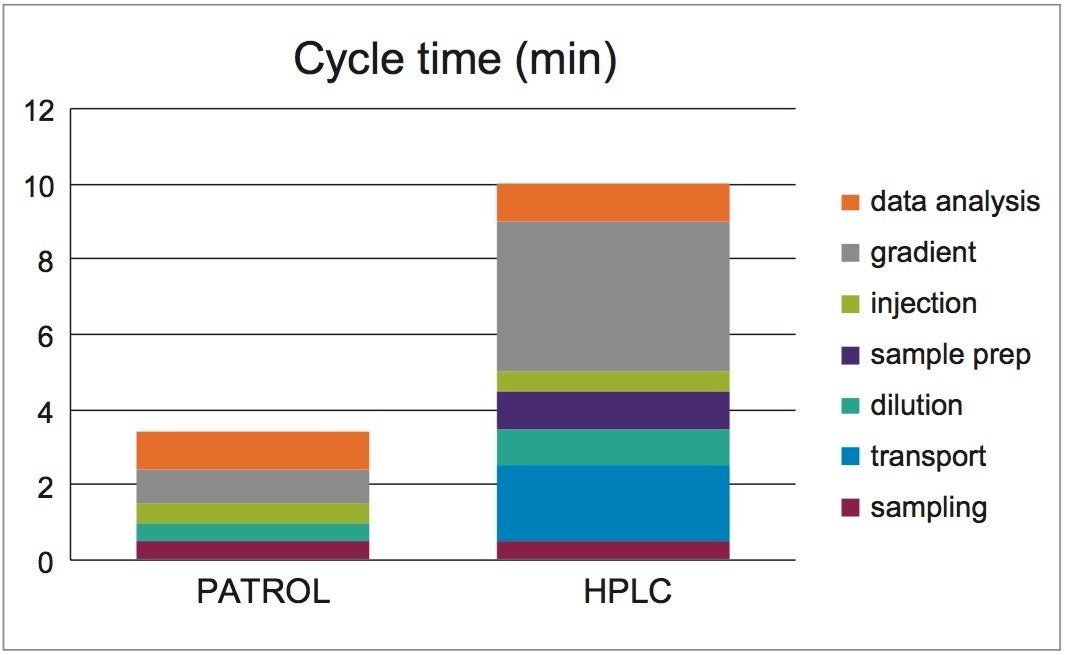
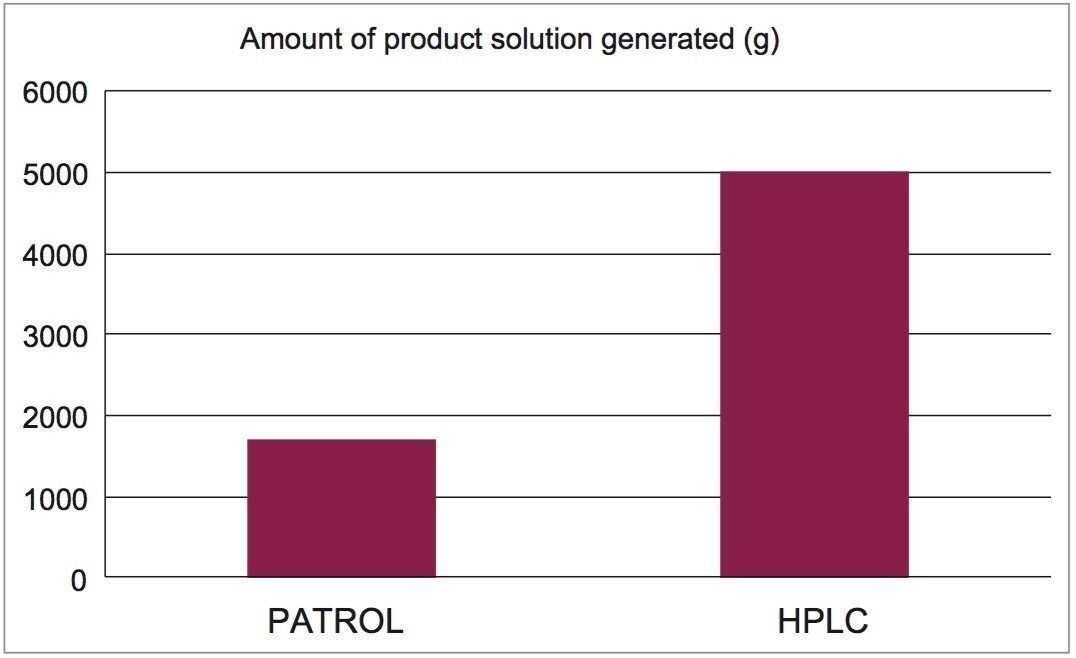
This application note describes the use of a PATROL UPLC Process Analysis System in the manufacture of 160kg of an intermediate pharmaceutical drug substance using a continuous flow process. The reaction has a total residence time of 8 seconds and a flow rate of 500 grams/minute, producing a large amount of product very rapidly. The traditional approach of running an in process test (IPT)/in process control (IPC) by HPLC is not appropriate for these fast processes due to the length of the cycle time required to generate data, as well as potentially excessive amounts of product generation prior to the determination of whether or not process parameter modification is necessary.