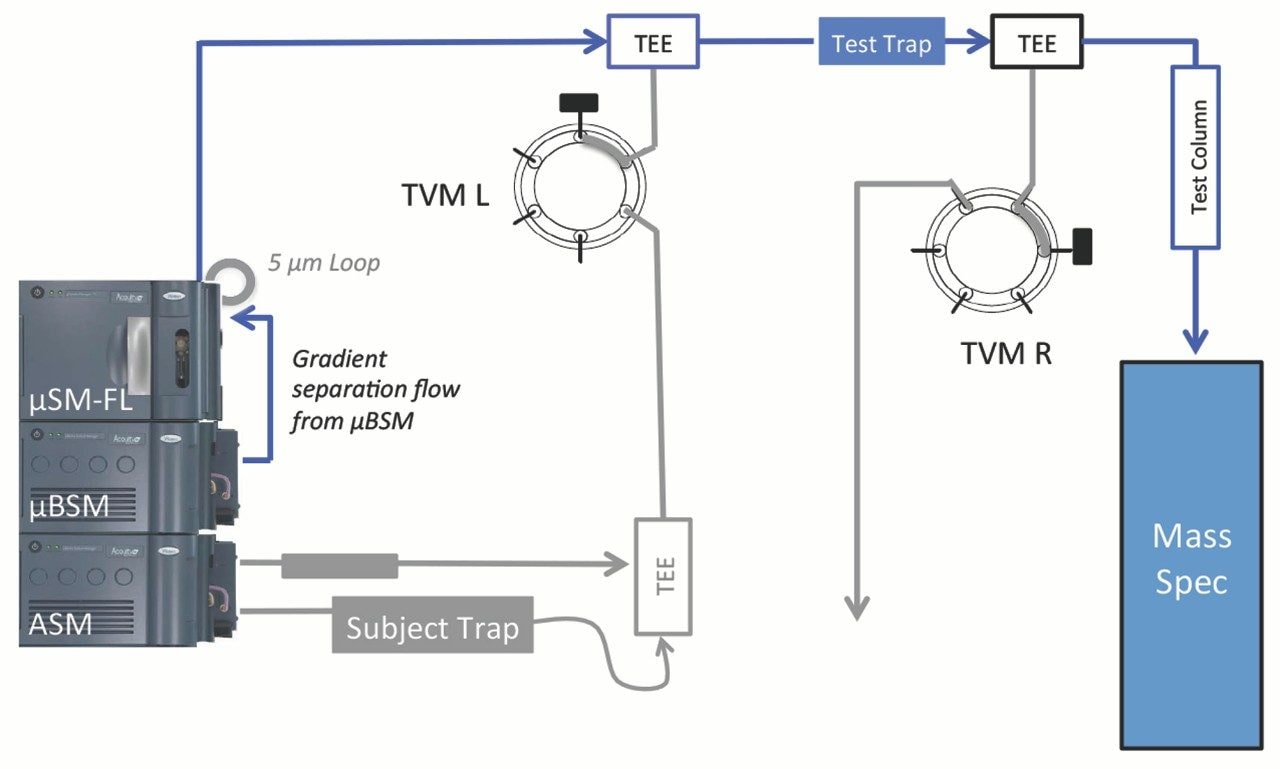
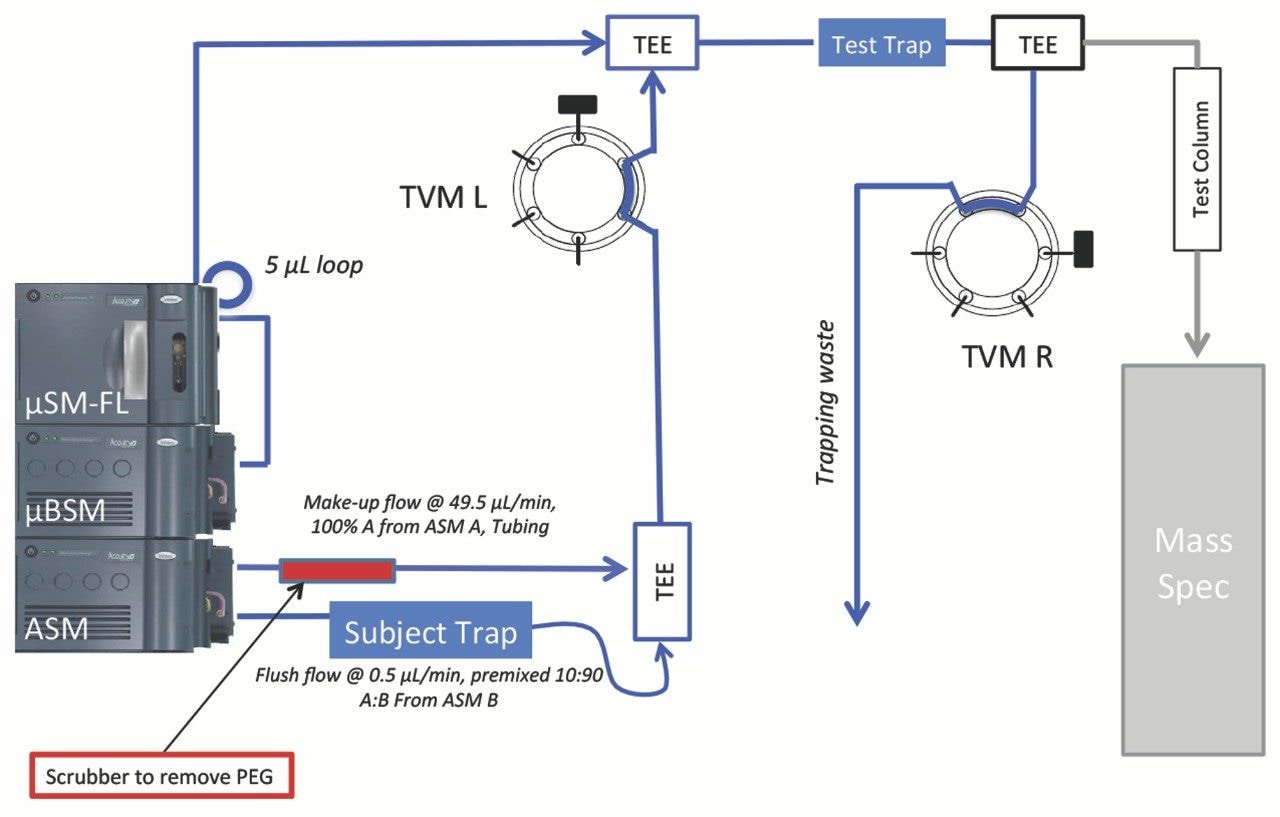
Waters ACQUITY UPLC M-Class Symmetry C18 Trap Columns, 100 Å, 5 µm, 180 µm x 20 mm, 2G, V/M (p/n: 186007496) were evaluated for the level of PEG present post manufacturing. We tested the traps (‘Subject Trap’) using the customized system consisting of an ACQUITY UPLC M-Class System in conjunction with a Xevo G2-XS QTof Mass Spectrometer (Figure 3). Briefly it was a modified trap-and-elute setup that allowed downstream trapping and analysis of PEG flushed from a test subject. The trap-and-elute setup consisted of an ACQUITY UPLC M-Class HSS T3 Column, 1.8 µm, 75 µm x 150 mm (p/n: 186007473), marked as ‘Test Column’, and an ACQUITY UPLC M-Class Symmetry C18 Trap Column, 100 Å, 5 µm, 180 µm x 20 mm, 2G, V/M (p/n 186007496), marked as ‘Test Trap’. A Waters Universal NanoFlow Sprayer MS Source with pre-cut PicoTip Emitters (p/n: 186003916) interfaced the ACQUITY UPLC M-Class System and the Xevo G2-XS QTof MS. PEG standards, used during the method development, and internal standards were prepared using PEG and Leucine Enkephalin (LeuEnk) from the Q-Tof Standards Kit without Bovine (p/n: 700004768). 4 µL of the internal standard was introduced via partial loop injection from a 5 µL loop. The acetonitrile (ACN), water, and formic acid (FA) used were Optima LC-MS grade supplied by Fisher Scientific.
PEG from either the mobile phases or LC components (system PEG) could potentially impact the results leading to false positive results. A Symmetry C18 Column, 100 Å, 3.5 µm, 2.1 mm x 150 mm (p/n: WAT16005), placed on Auxiliary Solvent Manager (ASM) Line A, served as a scrubber column to prevent system PEG from entering the trap-and-elute setup. As the scrubber column can become saturated with PEG, it is important that the column is regularly purged with acetonitrile to remove any collected PEG (22 minutes @ 0.5 mL/min flowrate). It is reconditioned by purging with water (240 minutes @ 49.5 µL/min flowrate) before reconnecting it to the test system.
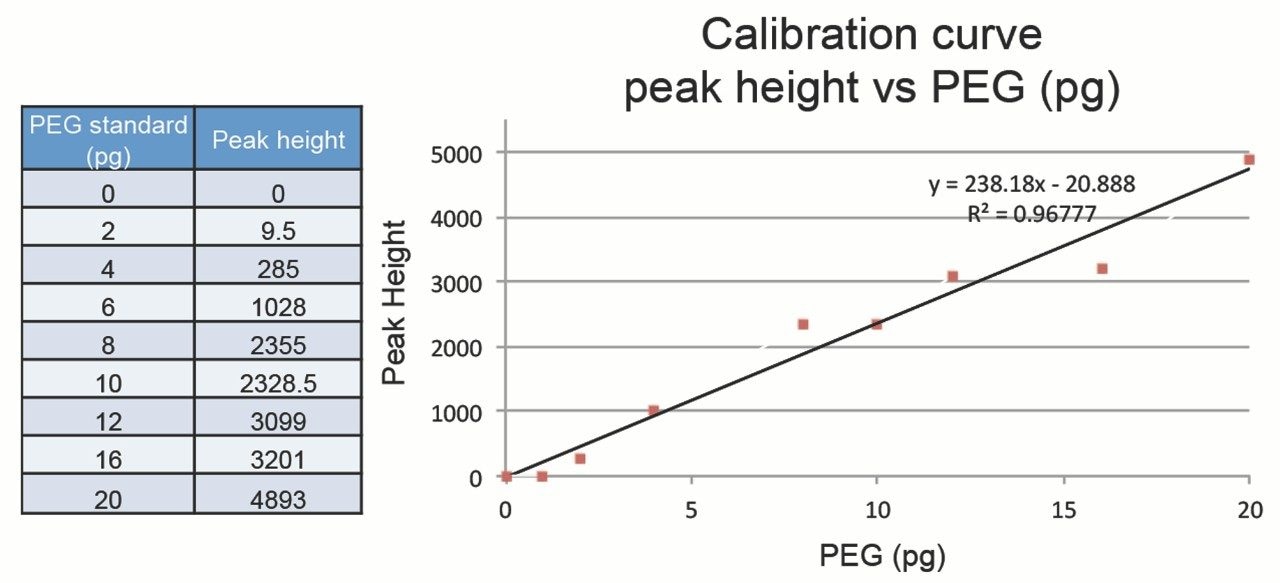
Initial work using the Micro Binary Solvent Manager (µBSM) and the Micro Sample Manager – Fixed Loop (µSM-FL) demonstrated that preparation of a calibration curve was possible using PEG standards of known concentration, see Figure 2. This method was sensitive to PEG concentrations as low as 1 ppb from 4 µL injections, or 4 pg.
Using this test system setup in Figures a and 3b and the method shown in Table 1, it was possible to flush PEG from the test subject (a trap column) and simultaneously quantify it using the downstream trap-and-elute setup. At the start of each run, the Subject Trap was flushed with 10:90 water/ACN at 0.5 µL/min (from ASM line B) to release any PEG in the trap (Figure 3a). The highly organic flush was mixed with water at 49.5 µL/min (from ASM line A) to bring down the ACN concentration to below 1%, assisting any PEG in the flush to be captured at the Test Trap. The flush/trap process lasted for 10 minutes, which was experimentally determined to ensure complete recovery of PEG. It was also extremely important to accurately control the valve switching time and the ratio of the flow rates from two ASM lines in order to capture PEG in the Test Trap. At the end of the flush/trap step, the TVM valves switched the flow path to isolate the Subject Trap and put the Test Column online (Figure 3b). A gradient flow at 0.5 µL/min was supplied from µBSM to start the separation.
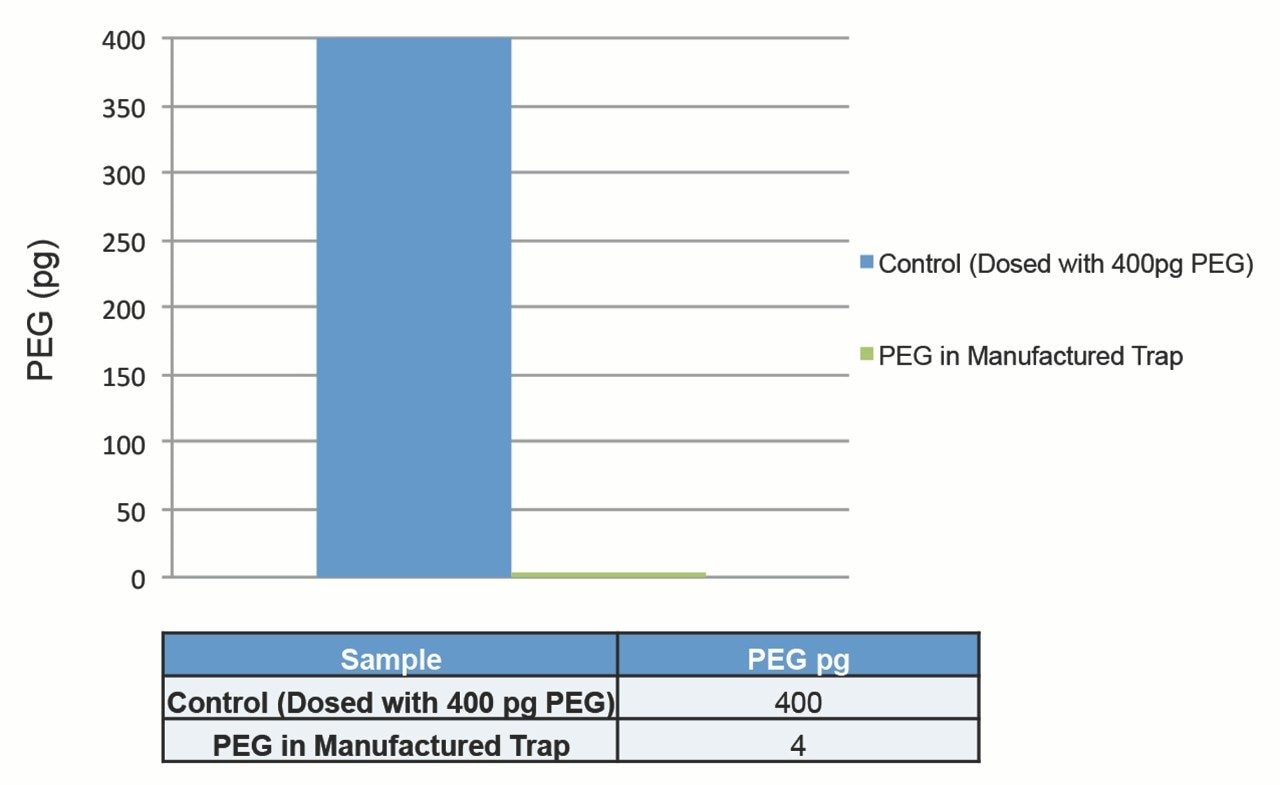
As verification, we dosed the subject trap column with known amounts of PEG and quantitated the PEG using the above described test setup and the method. As the presence of system PEG could potentially impact results, it was important to run blank samples and correct any results for system PEG.
The developed method was applied to test manufactured trap columns. The results shown in Figure 4 are the average of two runs corrected for any system PEG.