• Application Note

Time of Flight Mass Spectrometry as an Invaluable Tool for Specific Identification of Reaction and Degradation Products Within Medicinal Chemistry

Time of Flight Mass Spectrometry as an Invaluable Tool for Specific Identification of Reaction and Degradation Products Within Medicinal Chemistry

  • Michael McCullagh
  • Lena M. von Sydow
  • Waters Corporation
  • AstraZeneca

Abstract

Impurity profiling data is presented which will illustrate the enhanced performance of the Waters Micromass LCT Premier, where Dynamic Range Enhancement (DRE) functionality is used to extend the analytical applicability of orthogonal time of flight mass spectrometry (oa-Tof). The data presented shows the results obtained for the profiling of felodipine and xi-melagatran using the LCT and LCT Premier. The systems used were comprised of a Waters Alliance HT 2795 Separations Module, 2996 Photodiode Array (PDA) Detector, MassLynx Software and Atlantis C18 Column.

Introduction

In the pharmaceutical industry, an impurity is generally considered as any other organic material besides the drug substance or active pharmaceutical ingredient (API).

  • Impurity: an entity of the drug substance or drug product that is not the chemical entity defined as the drug substance, an exipient or other additives to the drug product.

- Classes of impurities are inorganic, organic, biochemical, polymeric

  • Degradation product (ICH): a molecule resulting from a change in the drug substance (bulk material) brought about over time. For the purpose of stability testing of the products in this guidance, such changes could occur as a result of processing or storage (e.g. de-amidation, oxidation, aggregation and proteolysis).

Sources of “impurities” are solvents, synthesis reagents and catalysts. During synthesis, the following can be described as impurities:

  • Intermediates/penultimate intermediates
  • Transformation products: intermolecular interaction, rearrangements
  • Degradation (hydrolysis/oxidation) products
  • Related products: compounds produced with a similar structure (these sound less dangerous, but can be lethal in small quantities due to similar activity structure)
  • By-products: unplanned compounds produced by synthesis
  • Enantiomers

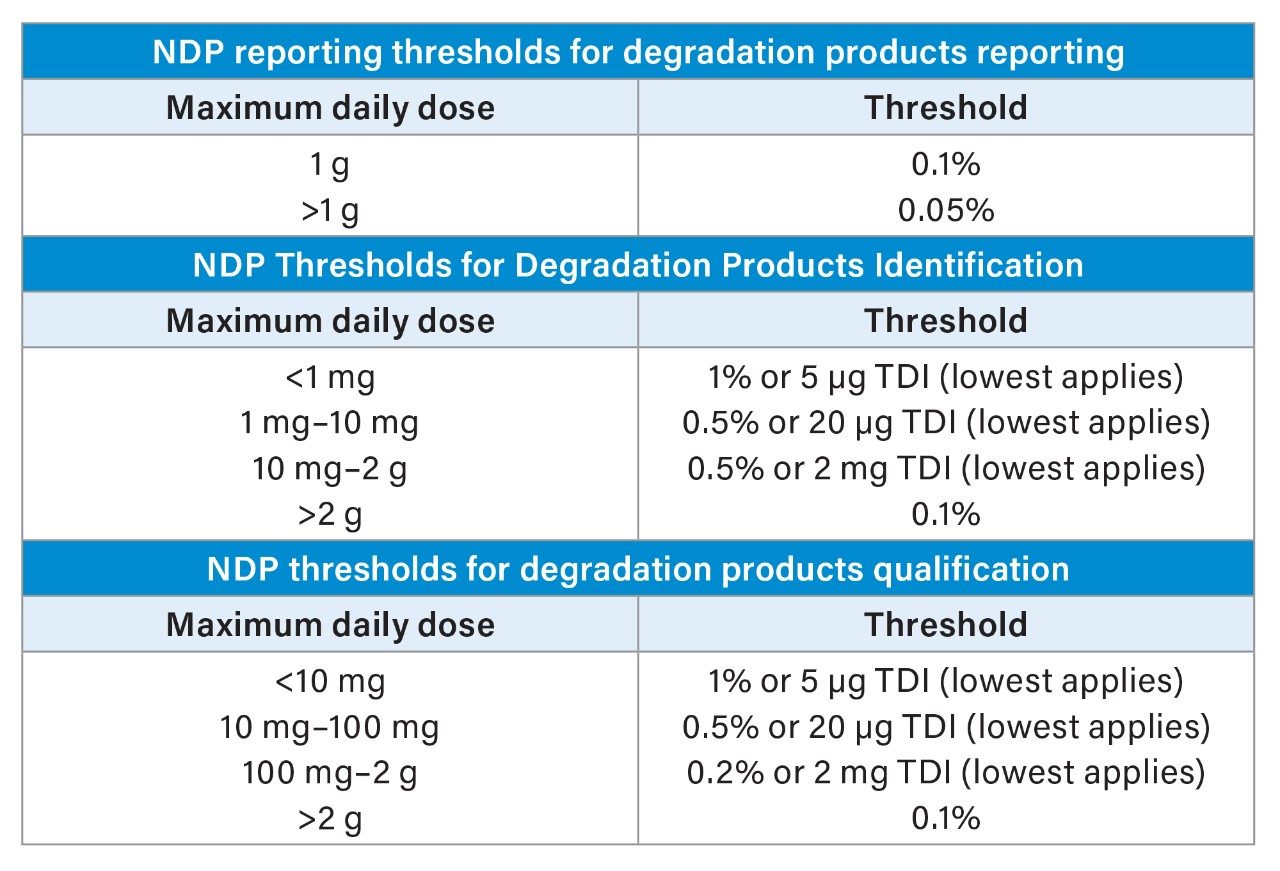
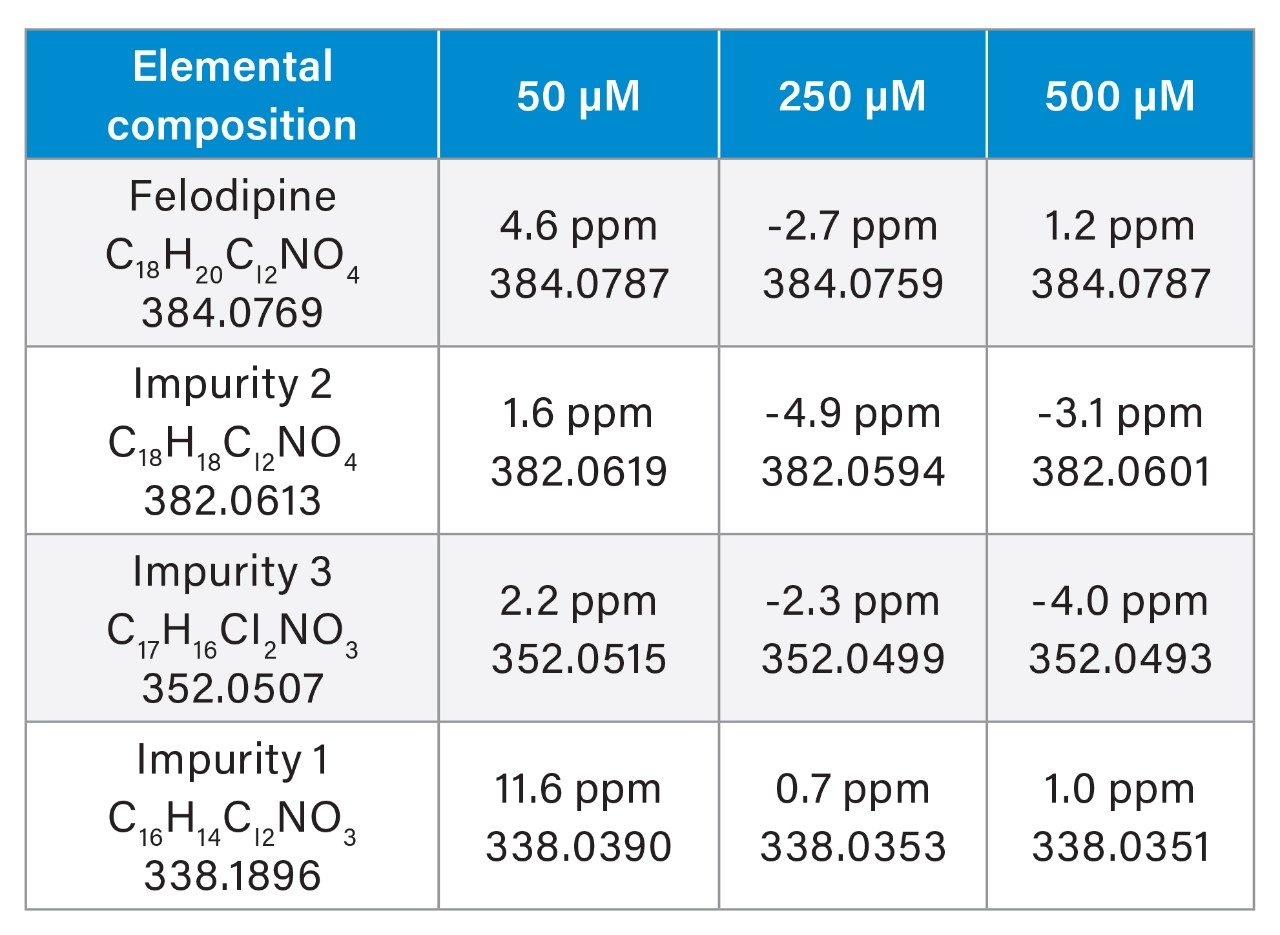
Modification of a synthetic route will affect all the potential impurity sources; hence, all possible effects have to be monitored. Impurities initially need to be detected, and then isolated and characterized. Table 1 shows the reporting, identification and qualification levels for degradation products in new drug products (NDP).1

Table 1. Description of different reporting thresholds relative to the maximum daily amount of drug substance administered or total daily intake (TDI).

Reversed-phase HPLC coupled with orthogonal acceleration time-of-flight mass spectrometry (oa-Tof-MS) is routinely employed as the analytical method of choice within medicinal chemistry departments in the pharmaceutical industry. The continuous flow of compounds from synthetic chemists necessitates fast and specific analysis to provide elemental composition confirmation of the target compound. The motive for this is to improve the quality of data and to minimize the risk of delivering the wrong compound for biological screening. The technique is also used for the determination of the identity of any by-products or degradation products present. This information is important to facilitate the interpretation of biological activity data and the understanding of reaction mechanisms.

Three different drug compounds from AstraZeneca have been studied: omeprazole (active ingredient in Losec), felodipine (active ingredient in Plendil) and melagatran (prodrug in Exanta). Reaction and degradation products were identified using reversed-phase HPLC coupled with oa-Tof-MS. The results obtained using a new bench top oa-Tof technology (Waters Micromass LCT Premier) were compared with those acquired with classic oa-Tof technology (Waters Micromass LCT). Two analytical laboratories were used for the comparison - one at the Medicinal Chemistry Department, AstraZeneca, Mölndal, Sweden and the other at Waters Corporation, Manchester, United Kingdom. The results obtained were extensive; only examples of the felodipine and xi-melagatran impurity profiling data will be presented here. Extracted mass chromatograms for the active drugs (or pro-drugs) and impurities were used for peak integration and response comparisons.

Experimental

HPLC Conditions

HPLC:

Waters Alliance HT 2795 Separations Module

Column:

Atlantis C18 150 mm x 2.1 mm, 3.5 μm

Column temperature:

20 °C

Flow rate:

0.2 mL/min

Mobile phase:

A: H2O (0.1 % Formic acid)

B: MeCN (0.1 % Formic acid)

Gradient:

0-0.5 min: 2% B

0.5-10 min: 2-80% B

10-20 min: 80% B

21-25 min: 2% B

MS Conditions

Mass spectrometer:

Waters Micromass LCT Premier oa-Tof

Waters Micromass LCT oa-Tof

Ionization mode:

ESI+ at 3kV

Sample cone voltage:

30V (LCT) and 100V (LCT Premier)

Reference mass:

Leucine enkephalin, [M+H]+ = 556.2771

Acquisition parameters:

100–1000 m/z; 1 spectrum/second; 0.1 second inter-acquisition delay

Resolution:

5000 FWHM (V mode) 10000 FWHM (W mode)

Results and Discussion

Sensitivity and Exact Mass Measurement of Xi-Melagatran and Its Impurities

A direct comparison of the per formance of the LCT and LCT Premier for the detection of three active product ingredients from AstraZeneca has been performed. On the LCT Premier, dynamic range enhancement and V-mode acquisition have been utilized so that a true dynamic response comparison can be obtained. As a result of the enhanced sensitivity of the LCT Premier, the crude API’s were profiled at three concentrations to determine if a lower working concentration could be used. The DRE TIC obtained for the analysis of xi-melagatran (500 μM) is presented in Figure 1; two impurities were determined to be present. The exact mass extracted chromatograms for A: impurity 1 (hydroxy-melagatran) m/z 446, C: impurity 2 (melagatran amide) m/z 459 and the prodrug B: xi-melagatran m/z 474 are presented.

Figure 1. DRE LCT Premier TIC and extracted mass chromatograms for xi-melagatran prodrug impurities 1 and 2, at a prodrug concentration of 500 μM.

The corresponding area response obtained for melagatran amide (impurity 2) at prodrug concentrations of 50 μM (area response 19210), 250 μM (area response 92180) and 500 μM (area response 169554) are shown in Figure 2, where analysis was per formed using the LCT Premier. The improvement in sensitivity obtained can be seen clearly from Figure 3, where the area responses for the LCT (Manchester laborator y) analysis of melagatran amide (impurity 2) are shown. The respective area responses obtained for impurity 2 at various prodrug concentrations were: 50 μM (area response 1198), 250 μM (area response 6828) and 500 μM (area response 9274). Using the LCT Premier, an average sixteen-fold increase in sensitivity was obser ved over the LCT (Waters Manchester).

Figure 2. DRE LCT Premier extracted mass chromatograms for xi-melagatran impurity 2 at xi-melagatran prodrug concentrations of 50 μM, 250 μM and 500 μM, respectively.
Figure 3. LCT (Waters Manchester) extracted mass chromatograms for xi-melagatran impurity 2 at 50 μM, 250 μM and 500 μM concentrations of prodrug xi-melagatran.

Dynamic range enhancement allows a true linear response to be obtained over four orders of magnitude. This also means that exact mass measurements can now be obtained at higher ion currents generated by more concentrated samples.

The LCT Premier exact mass spectra and mass measurement error obtained for melagatran amide impurity 2 is within 3 ppm, Figure 4. The correct exact mass measurement and elemental composition is determined at >2.3 million counts per second (cps) for the combined peak response.

Figure 4. Exact mass spectrum from the DRE LCT Premier analysis of xi-melagatran impurity 2 (melagatran amide) at xi-melagatran prodrug concentrations of 250 μM.

Hydroxy melagatran was also determined to be present in the prodrug melagatran. In this case, the impurity eluted at the front of the prodrug peak. The combined exact mass spectrum for hydroxy melagatran is shown in Figure 5, where a response of 456000 ion counts was measured to within <2 ppm error, allowing the correct elemental composition to be derived. Using the elemental composition calculator within MassLynx Software, two potential choices were produced, Figure 6. The correct elemental composition was given the highest score. In this case, the molecular ion has an odd mass and therefore following the “nitrogen rule,” the elemental composition will contain an odd number of nitrogen atoms. From this the second choice of derived elemental composition can be eliminated.

Figure 5. Exact mass spectrum from the DRE LCT Premier analysis of xi-melagatran impurity 1 (hydroxy melagatran) at xi-melagatran prodrug concentrations of 500 μM.
Figure 6. Elemental composition derived using the MassLynx elemental composition calculator for the exact mass spectrum from the DRE LCT Premier analysis of xi-melagatran impurity 1 (hydroxy melagatran) at xi-melagatran prodrug concentrations of 500 μM.

These results from the Manchester laboratory indicate a significant increase in sensitivity has been obtained through the technology improvements of the LCT Premier. Further independent verification of the sensitivity enhancement was obtained by taking the same samples for analysis by an LCT in another laboratory (AZ Mölndal).

As can be seen in Figures 7 and 8, the corresponding area responses obtained for the prodrug xi-melagatran, impurity 1 and impurity 2 are shown from the classic oa-Tof (AZ laboratory) and the new oa-Tof (Waters Manchester), respectively. In the case of the xi-melagatran pro-drug, some saturation was observed at 500 μM. For the 250 μM concentrations, the response is clearly linear. Comparing Figures 7 and Figure 8, it is clear that greater than a factor of ten increase in sensitivity has been observed. In the case of the hydroxy melagatran impurity, a peak area response of 113 (LCT) was obtained compared to 1681 (LCT Premier). The enhanced sensitivity and increased ion statistics allowed a combined response of 30000 ion counts and a mass measurement error of <2 ppm to be obtained at the lower working concentration.

Figure 7. AZ LCT area response for xi-melagatran prodrug, impurity 1 and impurity 2 at 50 μM, 250 μM and 500 μM (concentration of prodrug).
Figure 8. LCT Premier area response for xi-melagatran prodrug, impurity 1 and impurity 2 at 50 μM, 250 μM and 500 μM (concentration of prodrug).

Exact Mass Measurement of Felodipine and Its Impurities

The total ion chromatogram acquired for felodipine on the LCT Premier (Waters Manchester) is shown in Figure 9. It can be seen that three impurities were detected. By operating the LCT Premier in V-Mode (approximate resolution of 6000 FWHM), a representative comparison was able to be made with the LCT (Waters Manchester). The m/z 352 DRE extracted mass chromatogram for felodipine is shown in Figure 10, where impurity 3 is labelled and a peak area of 84387 was obtained. This compares to a peak area of 30127 for impurity 3 shown in Figure 11 for the LCT Premier non-DRE m/z 352, extracted mass chromatogram. The response obtained for impurity 3 is such that it almost equals that of the active product ingredient, and illustrates how when the dynamic range enhancement functionality is applied, a true linear response can be obtained.

Figure 9. DRE LCT Premier TIC for felodipine active (Plendil) and impurities 1, 2 and 3.
Figure 10. DRE LCT Premier extracted mass chromatogram TIC for felodipine active (Plendil) and impurity 3.
Figure 11. Non DRE LCT Premier extracted mass chromatogram TIC for felodipine active (Plendil) and impurity 3.

From Figure 12, the response obtained for impurity 3 acquired using the LCT is shown. The peak area response obtained was 847, which compares to 84387 from the LCT Premier.

Figure 12. LCT extracted mass chromatogram for felodipine active (Plendil) and impurity 3.

In the past, a limitation of the LCT was achieving mass measurement accuracy and quantitative results when detector count rate exceeded 30000 cps. Dynamic range enhancement on the LCT Premier reduces this limitation by attenuating ion transmission when necessary. This allows a true linear response over four orders of magnitude and improved mass measurement accuracy for high concentration components. In Figure 13 exact mass is illustrated for a single exact mass spectrum taken from the top of the impurity peak, acquired for the 500 μM felodipine API concentration. The intensity obtained is 495000 cps and if the whole of the impurity peak is combined an intensity of 1.98 million cps is obtained with exact mass measurement obtained at <1 ppm error. The elemental composition of impurity 3 was determined to be C17H16NO3Cl2. Table 2 shows the exact mass measurement errors obtained for the impurities identified and felodipine active at the three concentrations profiled.

Figure 13. Exact mass spectrum from the DRE LCT Premier analysis of felodipine impurity 2 at an API concentration of 500 μM.

Drug Concentration

Table 2. Exact mass measurement errors for the impurity profile of felodipine using DRE on the LCT Premier.

For the exact mass measurements made the RMS error obtained was 4.35 ppm. Previously Impurity 1 could not be detected at an active concentration of 50 μm. With the extra sensitivity of the LCT Premier, this impurity can now be detected but, due to poor ion statistics caused by low ion currents, the mass measurement error obtained was high.

Previously LC-Tof instruments have been restricted by limited dynamic range, which led to rather complicated determinations of which scans to use for accurate mass determinations. The results from the present study show that LC-Tof in DRE mode gives normal spectra and chromatograms that include high intensity peaks, which would have normally saturated the detector. Typically impurity profiling data would be acquired using a concentration of 500 μM, based on the molecular weight of the active component. The experiments under taken were required to show that working concentrations of the active component could be reduced to 50 μM. As can be seen the increase in sensitivity using the LCT Premier compared to the LCT is more than ten times. Furthermore, the observed increase in response produces improved ion statistics and therefore improved exact mass measurement for low-level impurities such as those identified. DRE extends the working dynamic range enabling exact mass measurement to be obtained at the high response levels obtained for the active compounds of the drugs analyzed. Continuous advances in technology may result in active product ingredients considered to be pure “today,” to be considered “impure” in the future.

Conclusion

  • Mass measurement errors of <3 ppm were obtained routinely and consistently when using the W mode at a resolution of >10 000 (FWHM).
  • The highly specific nature of exact mass measurement enables elemental compositions to be easily and rapidly determined and therefore increase confidence in producing the correct identification of the screened substances as well as the impurities formed.
  • DRE extends the dynamic range for which exact mass measurement can be made to 4 orders.
  • DRE also offers the possibility of simultaneous accurate mass determinations of high concentration substances in the same chromatogram as low concentration by-products.
  • Determination of accurate mass using DRE is much simplified compared to non-DRE mode; one scan at the apex of the peak is sufficient in DRE mode, whereas only scans at the slope of the peak can be used in non-DRE mode because of detector saturation.
  • The LCT Premier oa-Tof with integral LockSpray and independent reference mass acquisition enables the routine acquisition of highly specific data.
  • Greater than ten times more sensitivity was achieved using the LCT Premier, producing better ion statistics for low level impurities and hence improved exact mass measurement.

References

  1. Handbook of Isolation and Characterization of Impurities in Pharmaceuticals. Edited by Satinder Ahuja and Karen Mills Alsante.

Featured Products

720001068, December 2004

Back To Top Back To Top