Carbohydrates are the most abundant class of organic compounds in nature, and they play essential roles in many biological pro-cesses. These include providing storage and transport of energy for cells in most living organisms, as well as providing structure for plants and animals.
The term “carbohydrate” can refer to monosaccharides, disaccha-rides, oligosaccharides (3 to 10 sugar units), or polysaccharides (up to thousands of sugar units). The number of possible isomers for each monosaccharide (e.g., fructose, glucose, galactose) increases with the number of carbons. For more complex carbohy-drates (i.e., oligosaccharides and polysaccharides), it is even more difficult to distinguish between isomers with simple analytical techniques.
Carbohydrates are typically analyzed with amino or polyamine columns in HILIC mode with refractive index (RI) detection since these analytes have weak UV chromophores. However, these methods suffer from salt interferences, anomer mutarotation, and incompatibility with gradient separations. In addition, reduc-ing sugars (glucose, maltose, and lactose) are lost at elevated temperatures on amino and polyamine columns due to Schiff base or enamine formation, thus reducing column lifetime. Techniques that use ion-exchange chromatography are not compatible with MS detection due to the use of high salt buffers.
Mass spectrometry is a desirable technique for detecting carbo-hydrates since it is approximately 10-fold more sensitive than evaporative light scattering (ELS) and 100-fold more sensitive than RI detection. Outside the areas of proteomics and biophar-maceuticals, there are only a few reports using MS detection for analysis of carbohydrates. Two reports used flow injection analy-sis (FIA) into the MS instrument1,2, and another used rubidium in the mobile phase as a complexing agent for NMR and ESI-MS3.
ICP-MS and ESI-MS have also been used to study glucose, sucrose, and fructose fragmentation4. The lack of chromatographic separation with FIA prohibits separation of isomers and accurate quantitation due to matrix interferences. The use of metal complex-ing agents in the mobile phase or post-column addition of an ionizing agent prior to MS detection can also complicate analysis and foul the MS source. HILIC coupled with ESI-MS has been success-fully used for analysis of amino acids, peptides, glycoconjugates, and organic acids in foods without derivatization using an amide stationary phase5. These separations were performed using larger 5 µm particle columns and run times were in excess of 100 minutes.
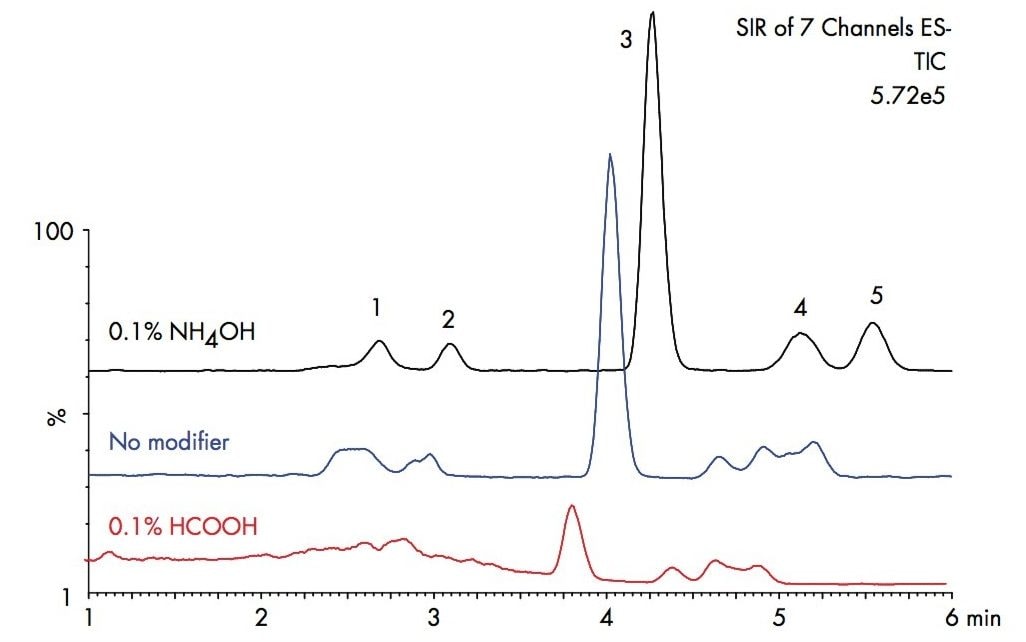
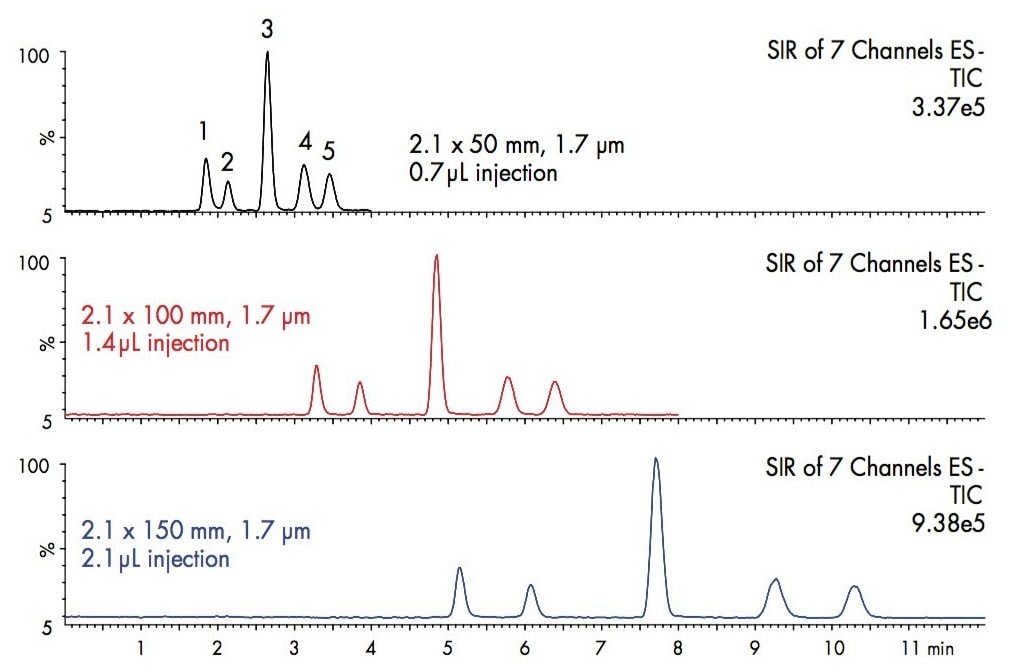
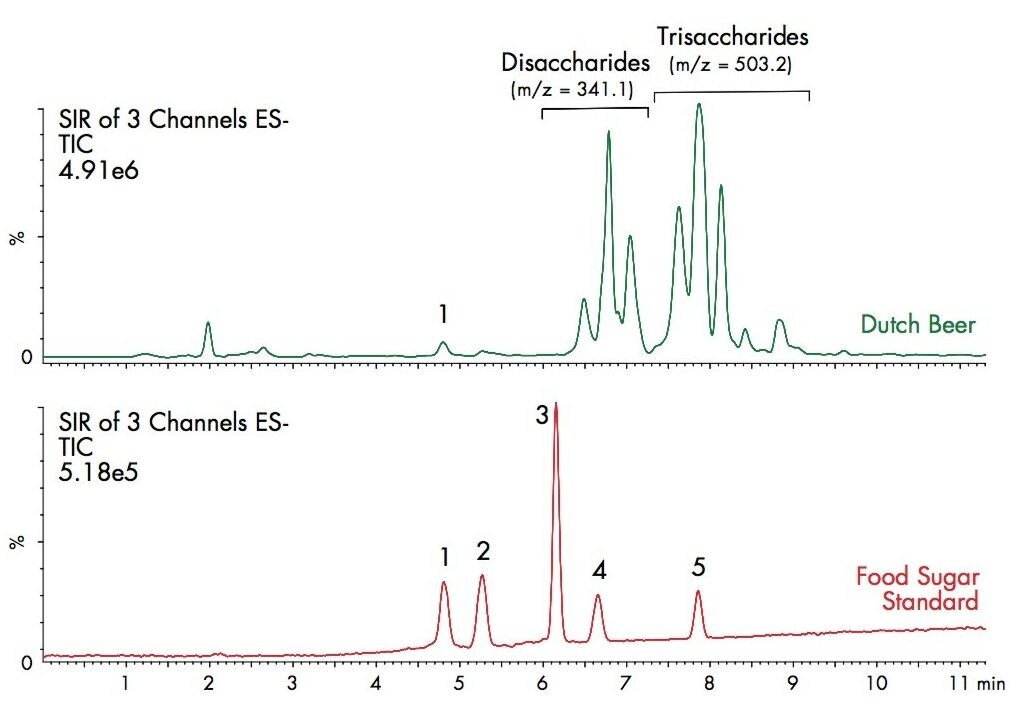
In this application, UPLC-MS is used for the rapid and direct analysis of simple and complex carbohydrates in a variety of sample matrices. The stability of the ACQUITY UPLC® BEH Amide column allows the use of high pH mobile phases that improve chromatographic resolution and enhance MS signal intensity without the need for derivatization, metal complexing agents, or post-column addition.