With little dispute, it is recognized that the glycosylation of biotherapeutics must be thoroughly and routinely characterized, since changes in glycan profiles can affect efficacy and immunogenicity or be indicative of manufacturing process instability.1 In a common characterization approach, N-linked glycans from glycoproteins are released enzymatically, labeled with a fluorescent tag, subsequently separated by hydrophilic interaction chromatography (HILIC), and detected via fluorescence (FLR).2-9
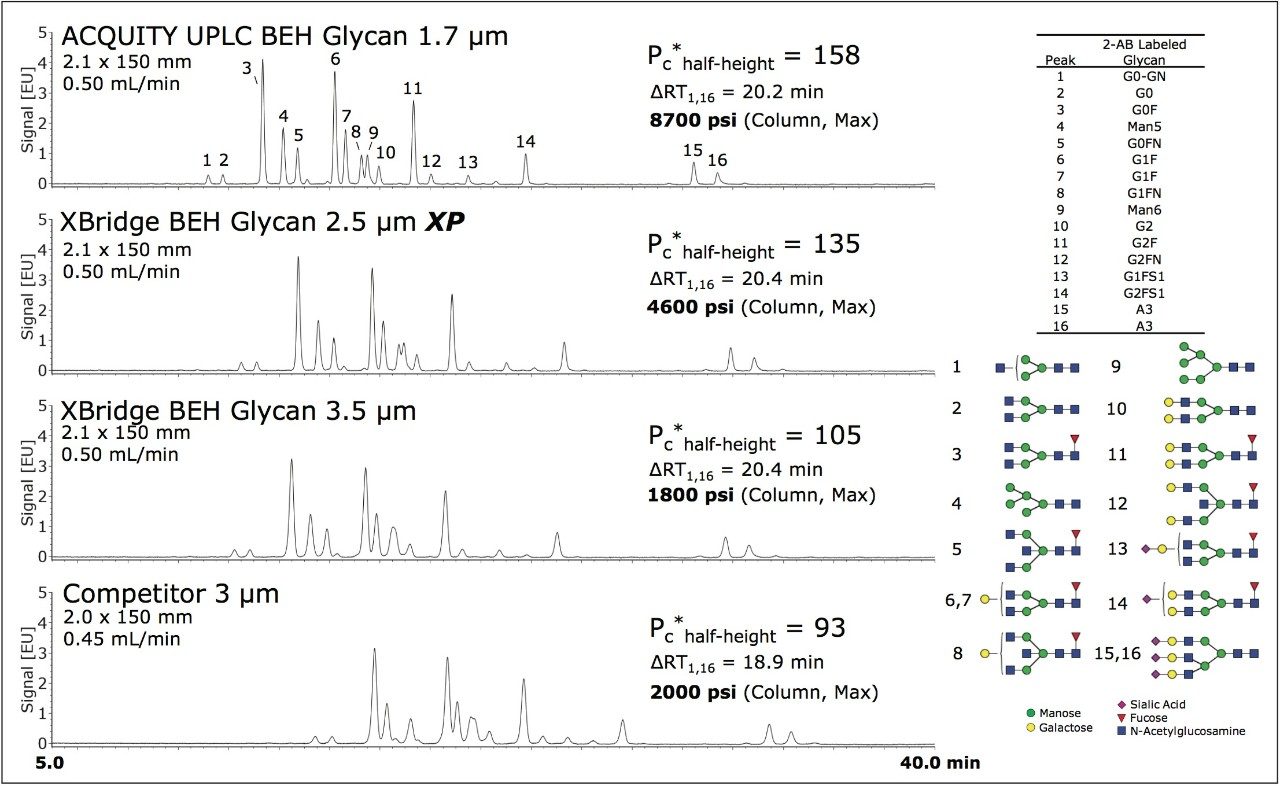
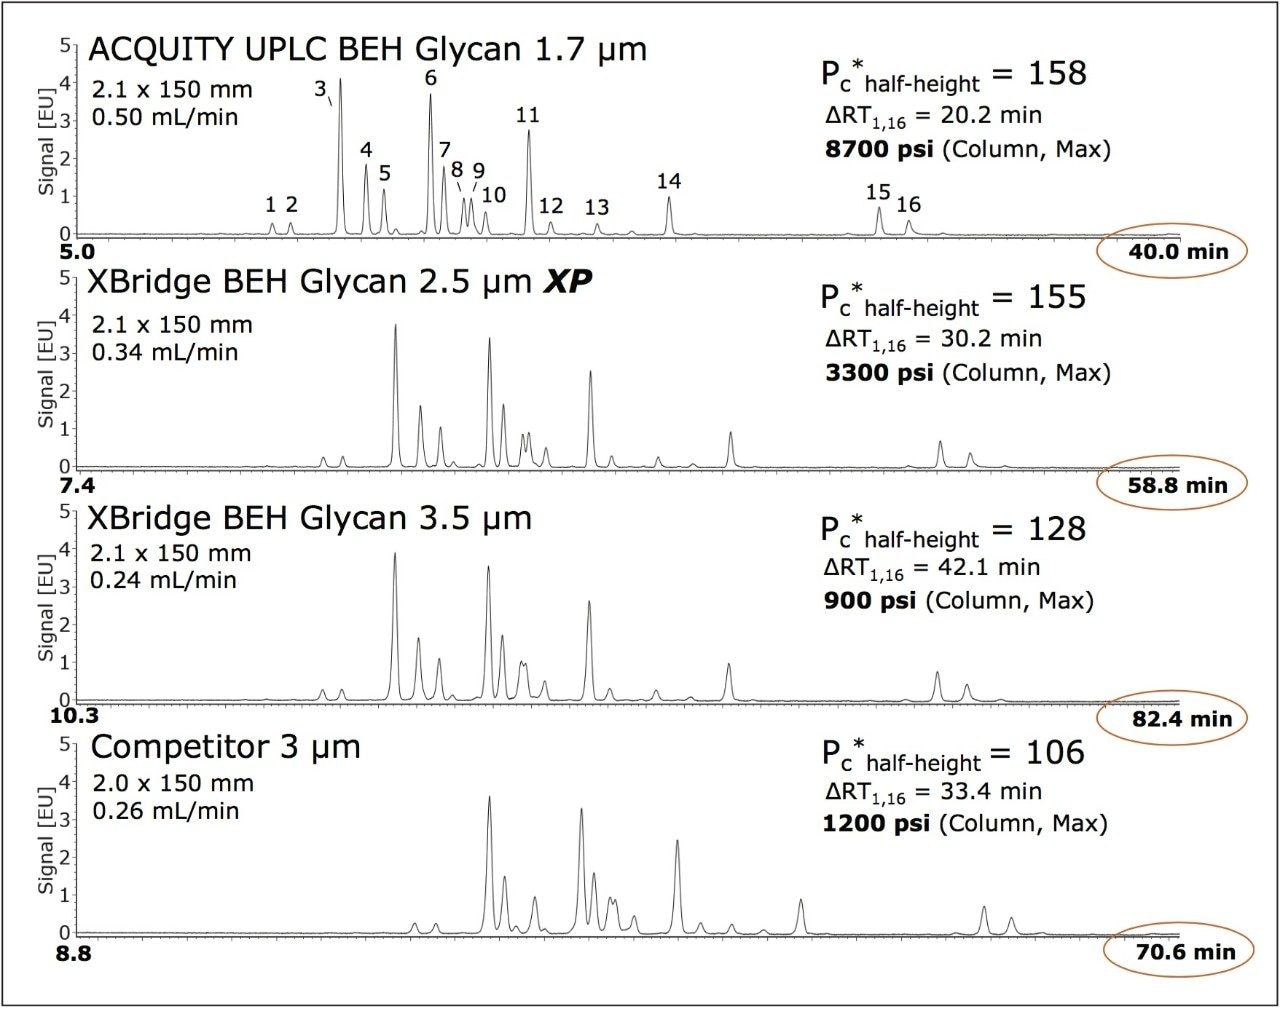
The ACQUITY UPLC BEH Glycan Column, packed with sub-2-μm particles, has proven to be an enabling technology for the HILIC-based separation of these labeled glycans. With an optimized amide-bonded ethylene bridged hybrid (BEH) HILIC stationary phase, this column provides faster and higher resolution separations than alternative HPLC-based columns.10
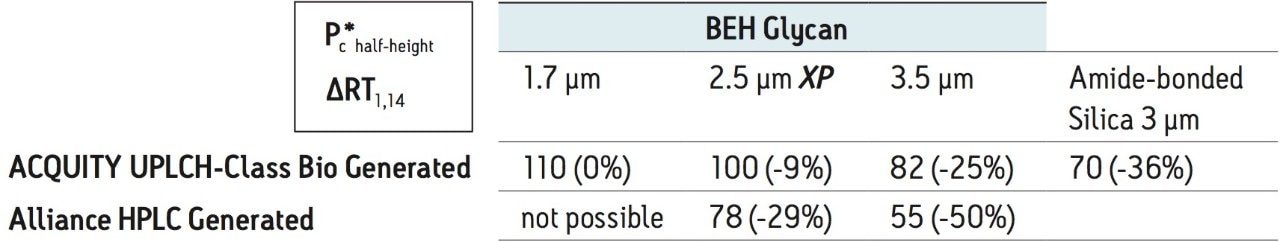
However, many laboratories have not yet fully transitioned to UPLC technology. To enable them access to this amide-bonded BEH Technology, HPLC-compatible particle size (2.5 μm XP and 3.5 μm) columns are now available with the proven BEH glycan stationary phase.
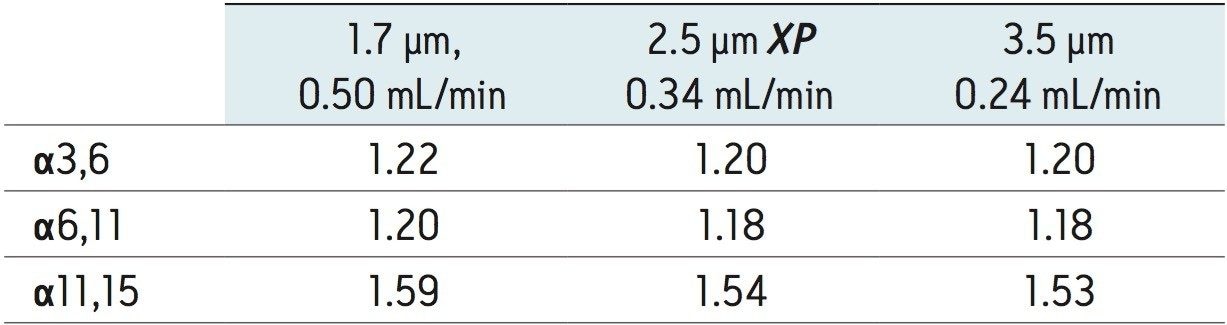
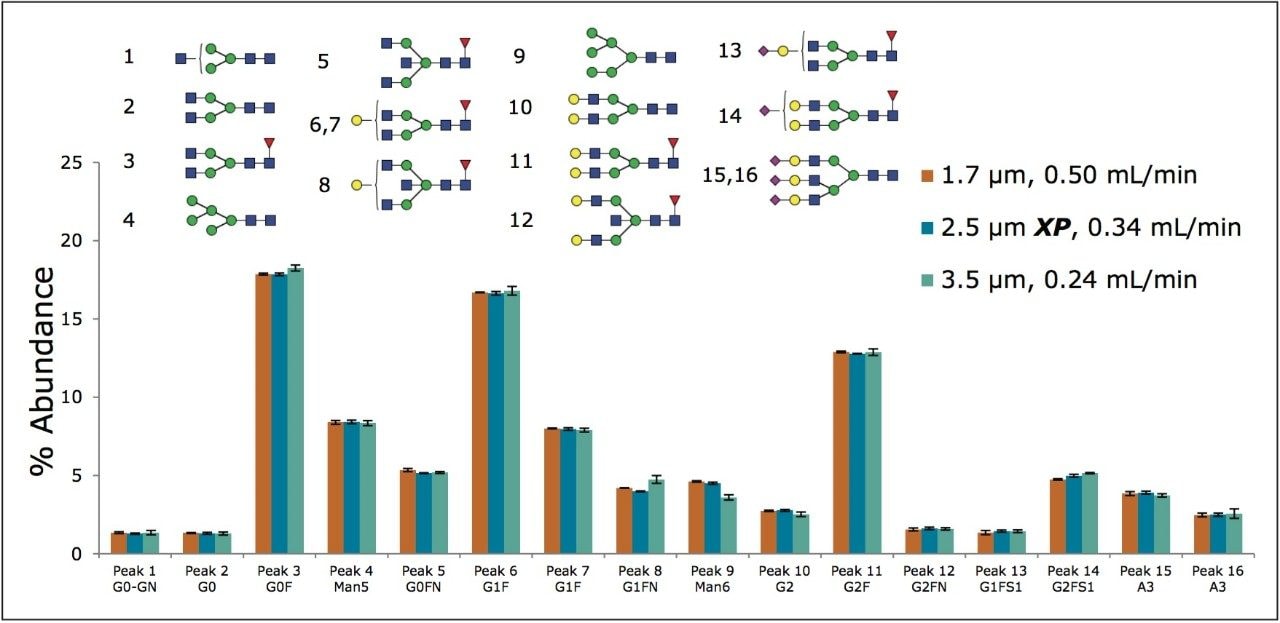
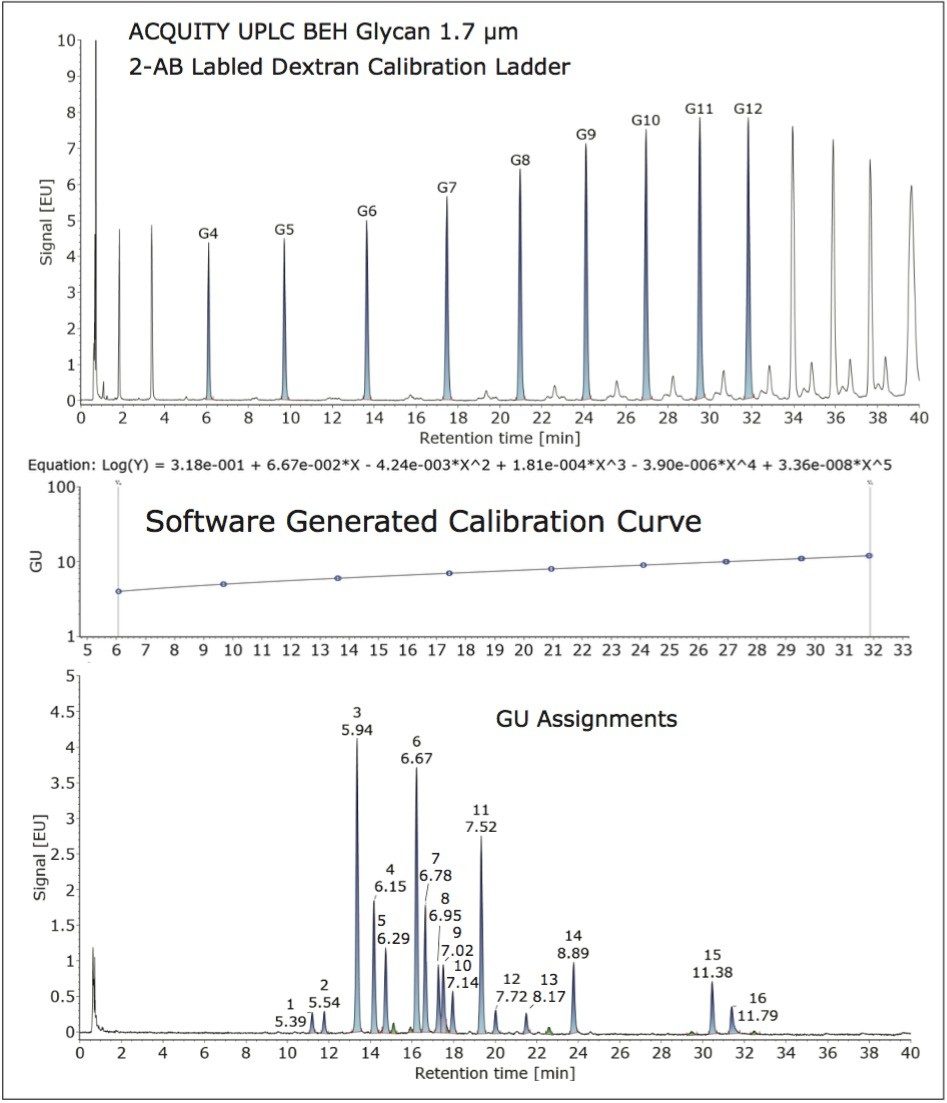
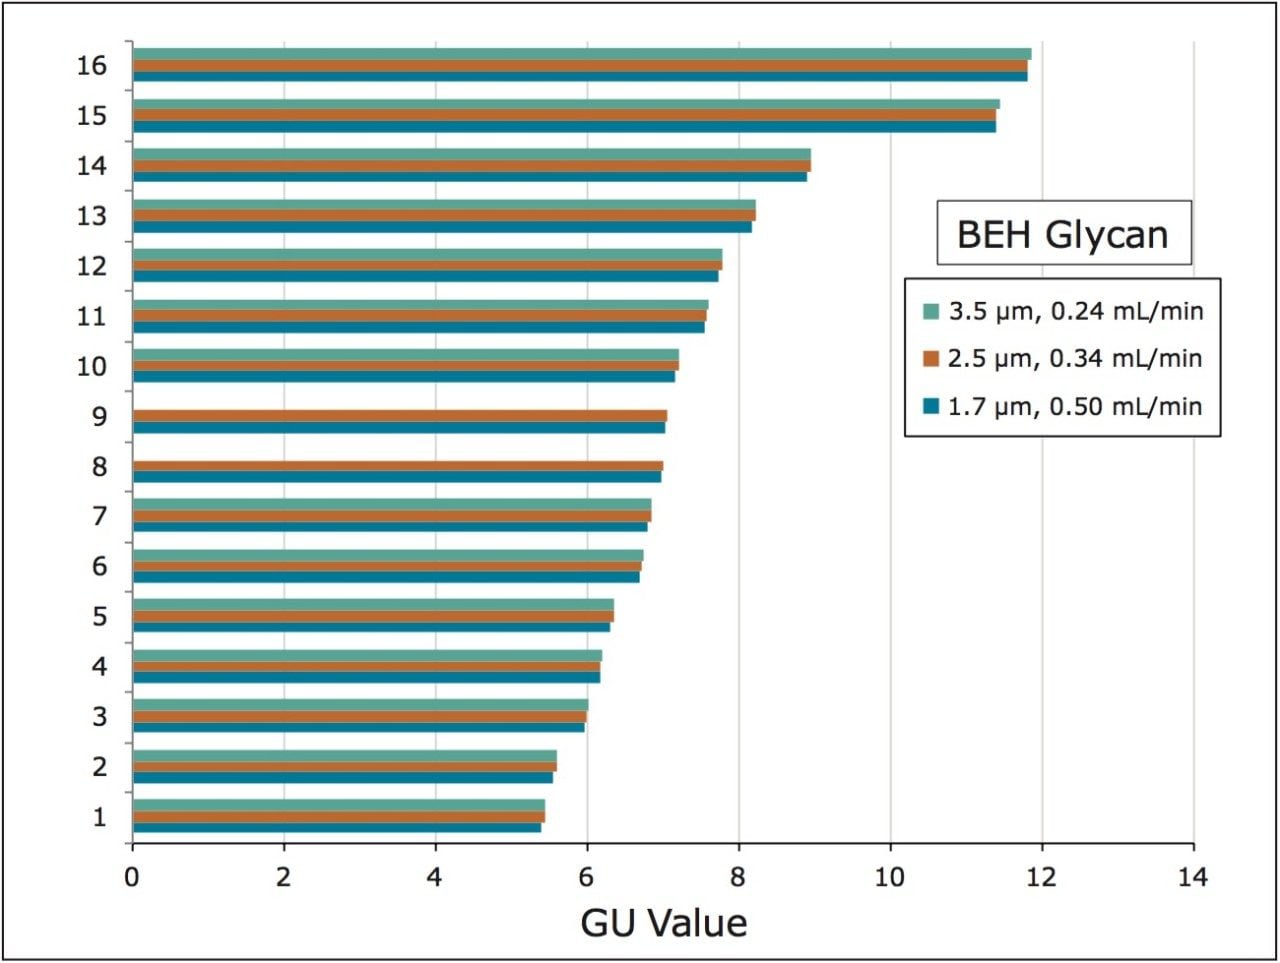
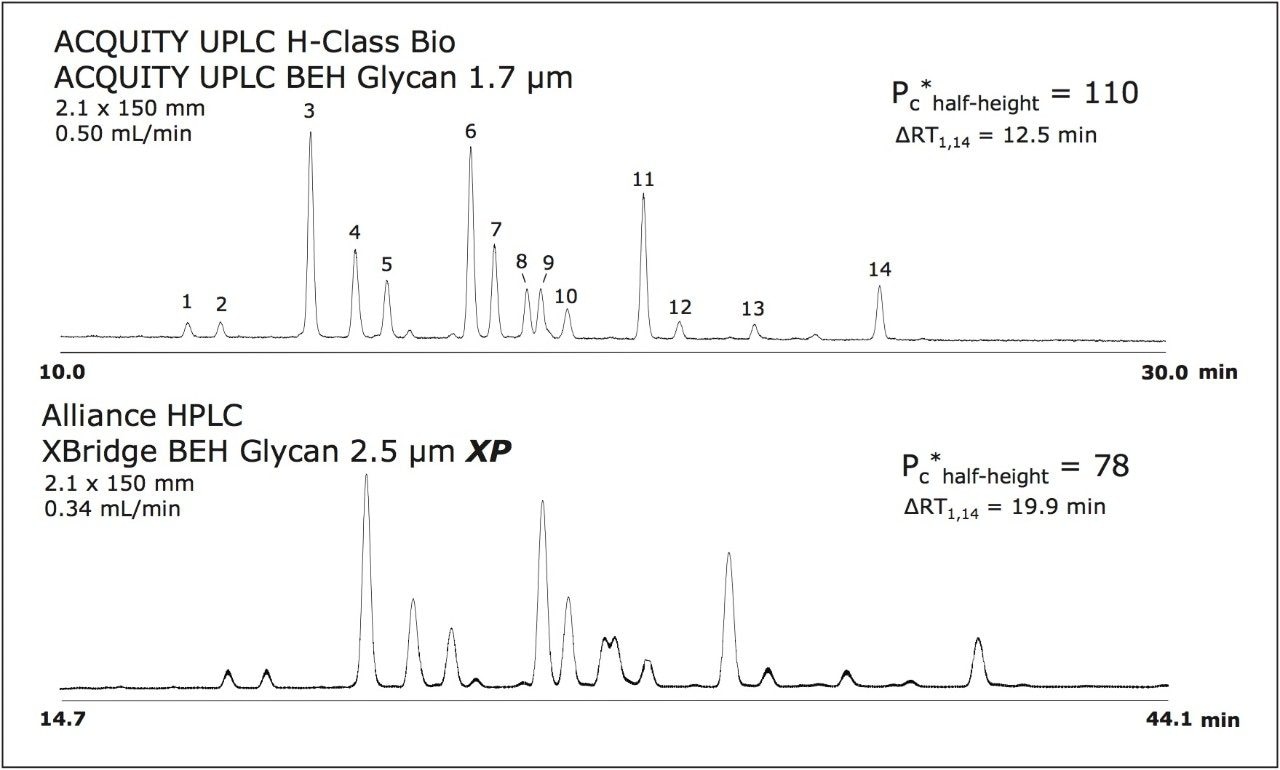
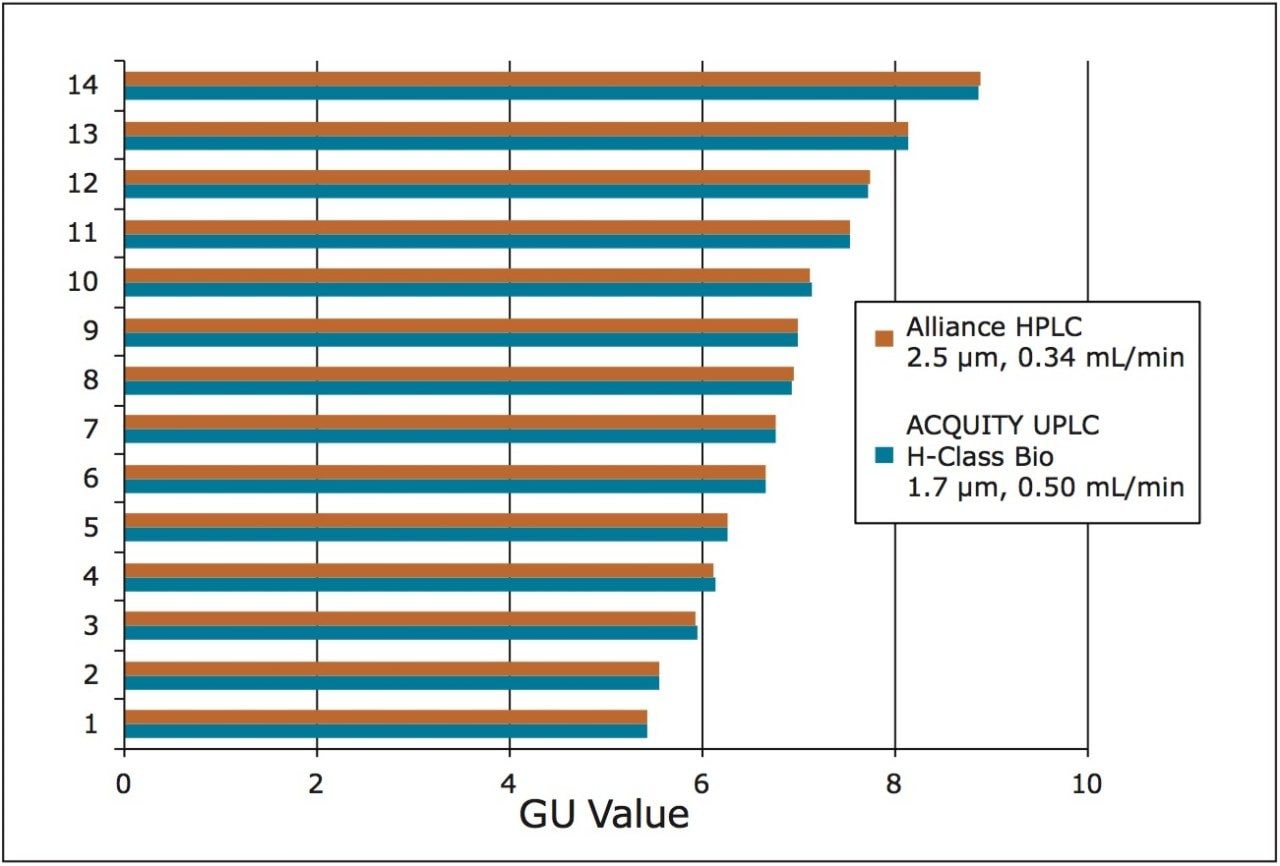
In the following work, we demonstrate that BEH Glycan Columns packed with 1.7, 2.5, and 3.5 μm particle sizes afford scalability between glycan separations performed under UPLC and HPLC-compatible conditions. Using standard LC method transfer principles accounting for differences in particle diameter (dp), we additionally show that noteworthy resolution can be achieved with the larger particle size columns at HPLC-compatible pressures, albeit with an increase in analysis time. Lastly, the following work demonstrates that highly similar glycan profiles and experimental glucose unit (GU) values are obtained, no matter the particle size or LC system employed.