• アプリケーションノート

Effect of MS Scan Speed on UPLC Peak Separation and Metabolite Identification: Time-of-Flight HRMS vs. Orbitrap

Effect of MS Scan Speed on UPLC Peak Separation and Metabolite Identification: Time-of-Flight HRMS vs. Orbitrap

  • Yun Wang Alelyunas
  • Mark Wrona
  • Kevin Cook
  • Stephen McDonald
  • Paul D. Rainville
  • Waters Corporation

Abstract

This application note compares the resolution capabilities between time-of-flight high resolution mass spectrometery (Tof HRMS) and Orbitrap MS, demonstrating that slow MS scan rates can lead to insufficient data points to define a chromatographic peak. This results in the loss of peak resolution, which can lead to false negatives (missed peaks) in metabolite identification studies and also to significant compromises with quantitative (or semi-quantitative) assessment of major metabolites.

Benefits

  • Fast MS scanning speed and high resolution are equally important in acquiring excellent HRMS qualitative information for metabolite identification.
  • Fast MS scanning speeds for full-scan HRMS are required to derive meaningful quantitative integrations and definition of closely eluting peaks.
  • Slower MS scan speeds lead to loss of LC resolution, which can result in false negatives (missed identifications) in metabolite ID.
  • The high resolution and fast scanning capabilities of QTof platforms take full advantage of the high resolution and peak capacity afforded by UltraPerformance LC (UPLC).

Introduction

Continuous improvements in chromatography and mass spectrometry have contributed to significant advancements in the study of xenobiotics. In the case of UltraPerformance LC (UPLC), sub-2-micron particle sizes have facilitated DMPK advances including significant improvements in peak capacity and the ability to shorten run times considerably.

Similarly, quadrupole time-of-flight MS (QTof) platforms continue to increase in resolving power (resolution) while maintaining the rapid scanning rate that time of flight instruments are well known for. MSE data acquisition (simultaneous acquisition of full scan and all fragment ions), a generic approach to screening for metabolites has been refined for over a decade. Similar “all-ion” modes of operation are now also available on many competitive high resolution MS (HRMS) platforms. This application note demonstrates that slow MS scan rates can lead to insufficient data points to define a chromatographic peak. This results in the loss of peak resolution, which can lead to false negatives (missed peaks) in metabolite identification studies and also to significant compromises with quantitative (or semi-quantitative) assessment of major metabolites.

The ability to acquire both qualitative and quantitative information using HRMS has made it possible to collect both rate and metabolite structural information from one HRMS instrument during one scheduled run. This is a particularly valuable benefit for pharmaceutical discovery projects that often demand data in a short turnaround time as part of the rapid design/make/test cycle. Such fast sample throughput requirements can now be routinely achieved by using UPLCenabled HRMS systems with gradient run times shorter than three minutes. 

Experimental

Sample description

Glyburide with a final concentration of 10 μM was incubated in human liver microsomes (2 mg/mL final protein concentration). After preheating the solution containing glyburide and microsome in pH 7.4 phosphate buffer at 37 °C for 5 min, the reaction was started by adding NADPH (2 mM). After one hour of gentle shaking at 37 °C, the reaction was stopped by adding two volumes of cold acetonitrile. The quenched acetonitrile solution was centrifuged for 20 min at 15,000 rpm and 10 °C to precipitate proteins. Finally, the supernatant was transferred to a 2-mL analytical vial and diluted with one volume of H2O.

LC Conditions

LC system:

ACQUITY UPLC I-Class

Column:

CORTECS C18+ 1.6 μm, 2.1 x 100 mm

Column temp.:

60° C

Sample temp.:

10° C

Injection vol.:

8 μL

Flow rate:

0.6 mL/min

Mobile phase A:

H2O with 0.1 % formic acid

Mobile phase B:

90% acetonitrile/10% MeOH, with 0.1 % formic acid

Gradient:

5-90% B in 2.5 minutes, held at 90% B for 1 min before returning to the initial condition; total run cycle time 5 min

MS conditions

MS system:

Xevo G2-S QTof

Ionization mode:

ESI+, resolution

Experiment:

MSE (Full scan precursor and fragment ion scanning)

MSE settings:

Low CE 2.0 eV; high CE Ramp 10-30 eV

Acquisition mass range:

50-1200 m/z

Capillary voltage:

1 kV

Cone voltage:

30 kV

Source temp.:

120 °C

Desolvation gas temp.:

550 °C

Cone gas flow:

20 L/h

Desolvation gas flow:

1000 L/h

Scan time:

Various, range from 0.08 - 1s tested, see results

Data acquisition and processing

UNIFI Scientific Information System

Results and Discussion

In this application note, the effect of scan speed on LC and MS chromatographic separation and metabolite identification is systematically tested using an ACQUITY UPLC I-Class System with a Xevo G2-S QTof MS, using glyburide as a model compound. 

Tof vs. Trap resolution: Pros and cons

When we look at MS resolution and scan speed in particular, time-of-flight technology is known to produce essentially the same resolution across an entire mass range, >32.5 K for the Xevo G2-S QTof, across all scan speeds. In contrast, the mass resolution of Orbitrap ion-trapping technology is inversely related to scan speed. Figure 1 plots this relationship using the mass of 500 as an example. Consequently, at the UPLC-compatible faster scan speed settings of 12 and 7 Hz (scan/s), the Tof offers higher resolution. Although highly desirable, using the high-resolution specification settings on the Q Exactive (Thermo Scientific) results in very slow scan speeds of 3.0 and 1.5 Hz. This sampling speed may be insufficient for UPLC data sampling where peak widths of less than 1 second are commonly obtained, and greater than 10 data points are desirable and needed for reproducible quantitation.3

Figure 1. Plot showing the dependency of resolution on scan speed, comparing Tof with Orbitrap MS technologies. Red line: Tof, Blue line: Orbitrap (Q Exactive model shown). Blue dots represent fixed scan speeds (1.5, 3, 7, 12 Hz) on the model.

The 2013 review article by Rodriguez-Aller suggests that HRMS based on time-of-flight MS technology is the preferred platform for UPLC data acquisition due to its fast scan rate.1 Similarly, observations by Rousu et al. comparing Tof with Orbitrap technology for metabolite identification, concluded that Tof MS positively identified all metabolites while the Orbitrap MS exhibited lower sensitivity and false negatives due to its slower scan rate.2

Scan rate comparison: Resolving closely eluting isomers

Under human microsomal incubation conditions, glyburide undergoes biotransformation to form six major +O metabolites (Figure 2).4 Based on the MS fragmentation pattern, five of the +O metabolites occur on the terminal cyclohexyl group as isomeric metabolites (Figure 2, yellow region).

Figure 2. Structure of Glyburide (MW = 494 Da). Sites of biotransformation are highlighted in the colored circles. All +O metabolites have precisely the same mass (isomeric/isobaric).

It should be noted that formation of isomeric and/or isobaric metabolites are commonly observed in metabolism studies. In this regard, mass resolution is very important, but when resolving isomers without appropriate scanning rates and sufficient chromatographic resolution, isomers can be difficult if not impossible to detect, resolve, or quantitate by relying on HRMS alone.

Figure 3 shows a typical HRMS extracted ion chromatogram (XIC) for glyburide obtained under generic gradient conditions and using a Xevo G2-S QTof scan speed of 0.1 seconds (10 scan/s).

Figure 3. Summed chromatogram for all major components observed in glyburide microsomal incubate using UNIFI software. The trace amount of +2O metabolites is shown in the expanded region. MS scan rate was 0.1 s.

Figure 4 summarizes chromatograms collected with varying scan speeds ranging from 0.08 to 0.67 seconds, while keeping other LC-MS parameters constant. These scan times correspond to 12, 7, 3, and 1.5 Hz scanning speeds.

With decreasing scan speed, each peak broadens and fewer data points across each peak are collected (Figure 4). At a scan speed of 0.3 seconds, the middle two peaks merge into one, suggesting a complete loss of peak resolution due to insufficient MS sampling rate. Since these two peaks are isomeric metabolites, increasing MS resolution will not provide differentiation.

Peak smoothing (Figure 4, right side) is typically applied to the raw data before integration to reduce spectrum noise and further improve the XIC quality. Again, results show that with a 0.08 second scan rate, all metabolites are clearly identified, while at 0.3 s, there is further merging of the two middle peaks.

Figure 4. Summary of chromatograms of +O metabolites with varying scan rate from 0.08 s to 0.67 s. Number displayed next to each peak represents data points across peak or peak cluster. Peak width at half-height for RT = 2.02 min is also displayed. Left: raw data; right: smoothed data by applying Savitsky-Golay regression with one iteration and one data point at half width.

Scan rate comparison: Spectral quality at high scan rates

It is not only important to have fast scanning for XIC quality. Figure 5 shows that excellent MSE spectra were obtained at both 0.08 and 0.3 seconds, indicating MS fragmentation data was not compromised when operating the Xevo G2-S QTof at fast scan speeds. The MSE mode of operation offers rich fragmentation information without compromise to resolution, while maintaining sufficient points across the peak for quantification and discrimination of closely eluting peaks.

Figure 5. MSE high energy spectra comparison of the +O metabolite with RT = 1.7 min at different scan rate. (Top) scan rate = 0.08 s; (bottom) scan rate = 0.3 s.

Conclusion

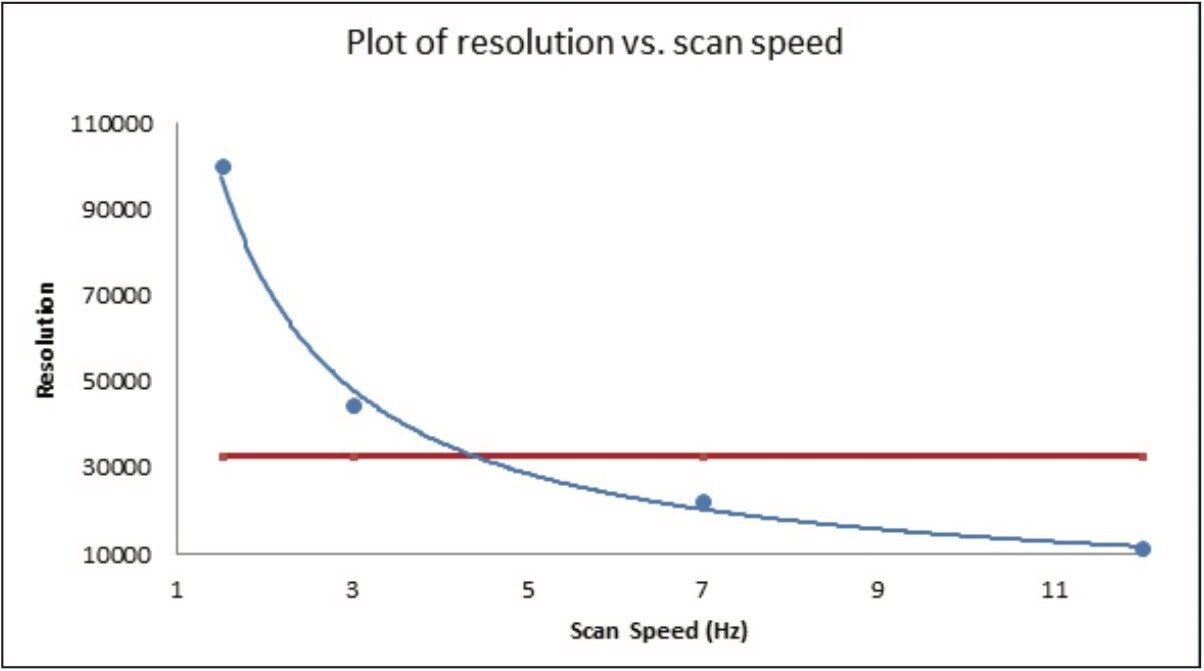
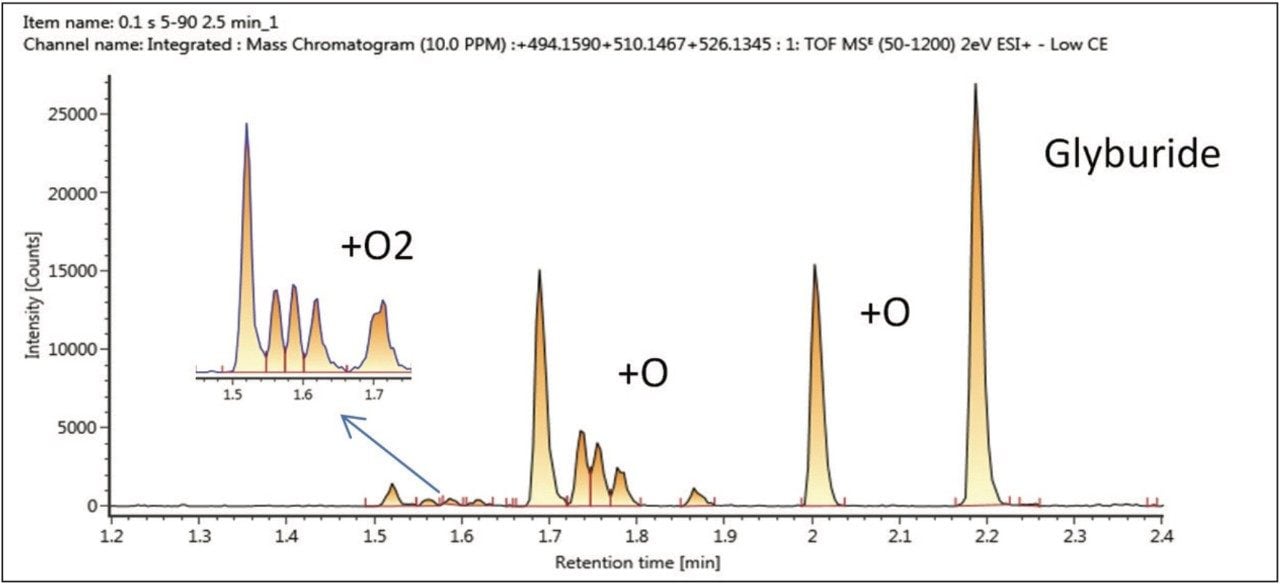
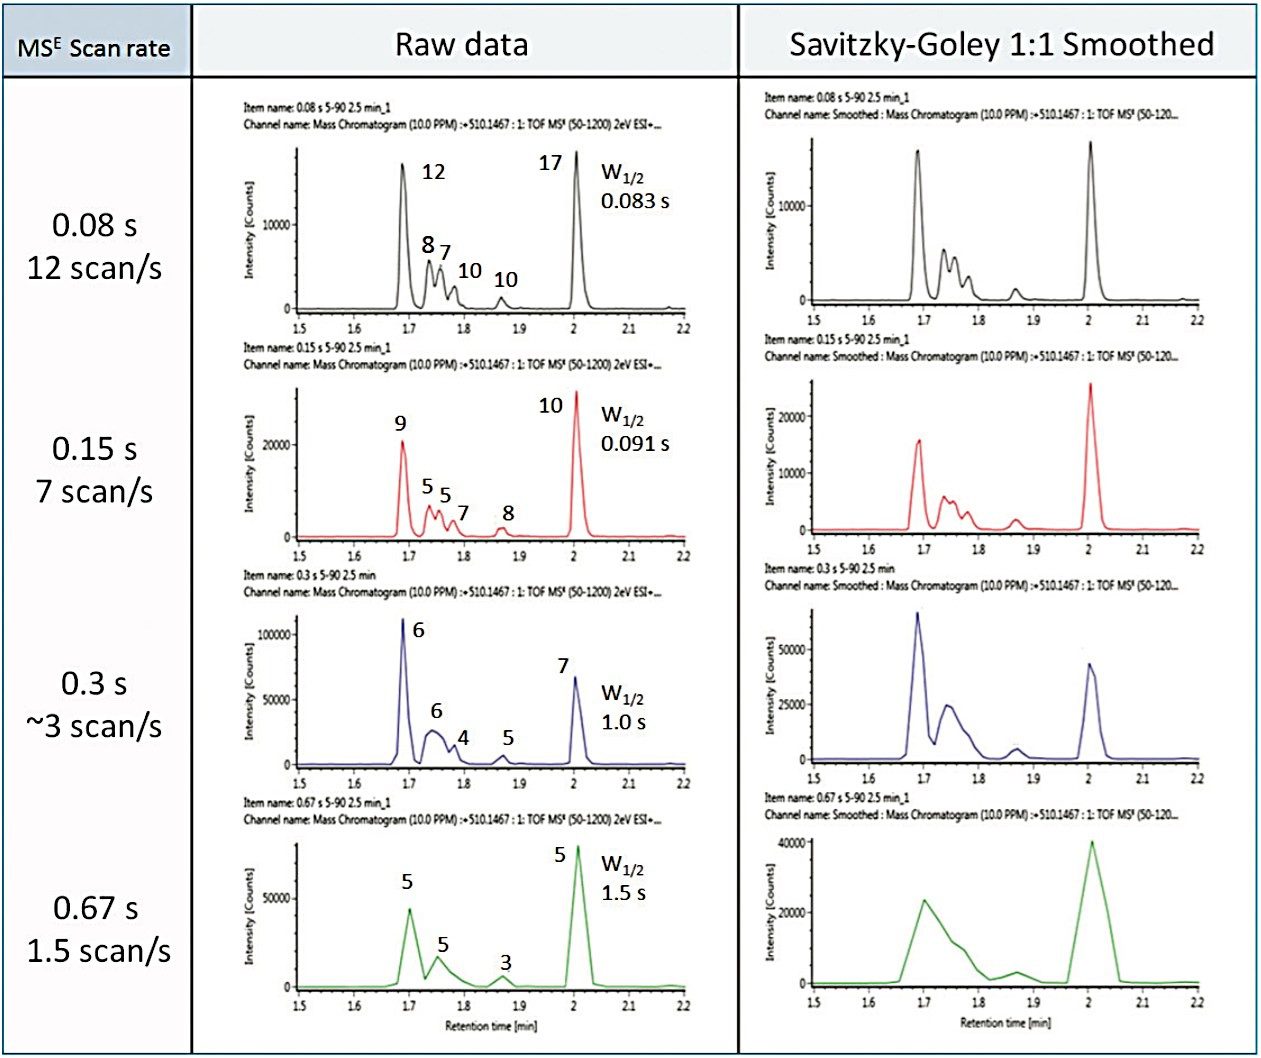
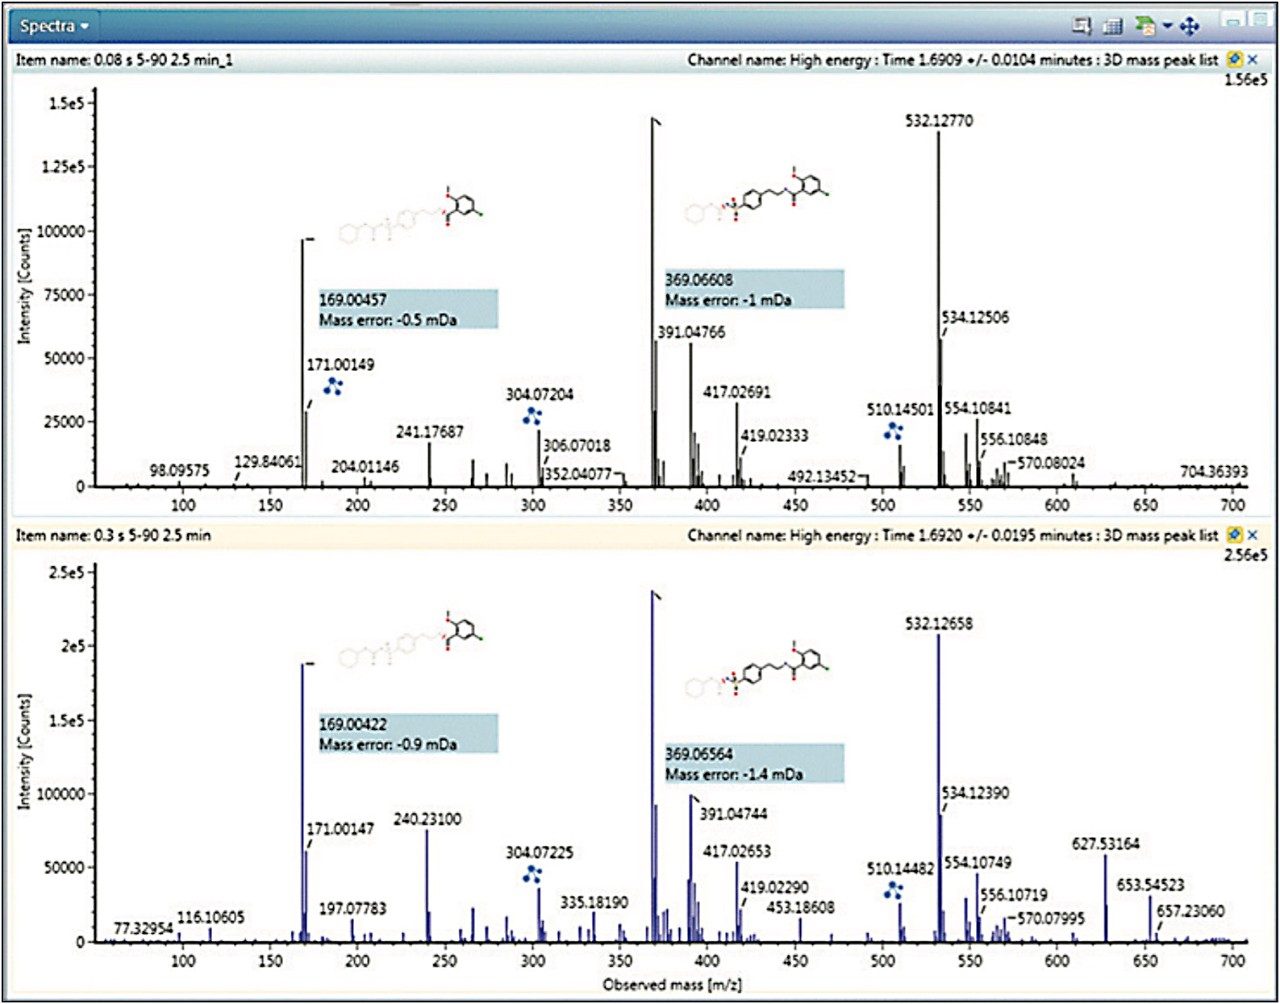
We have demonstrated that there are significant differences in MS scan rates, and thus resolution, when comparing Orbitrap and time-of-flight MS technologies. Using typical glyburide incubations with multiple hydroxylations (isomers), a slow MS scan rate of 0.3 seconds leads to insufficient data points to define some of the metabolites, resulting in loss of resolution even though the resolution was obtained initially by UPLC separation. Conversely, a 0.08-second scan rate generating good chromatographic resolution of the peaks allows for the simultaneous capture of key MS/MS information at 32.5K resolution.

Since these metabolites have identical masses, MS data with poor chromatographic resolution caused by slower scan rates would fail to provide sufficient detail about some metabolites, resulting in false negatives or metabolites not being correctly identified. If either relative or absolute quantification is required, the peak capacity is also significantly compromised at slower scan speeds.

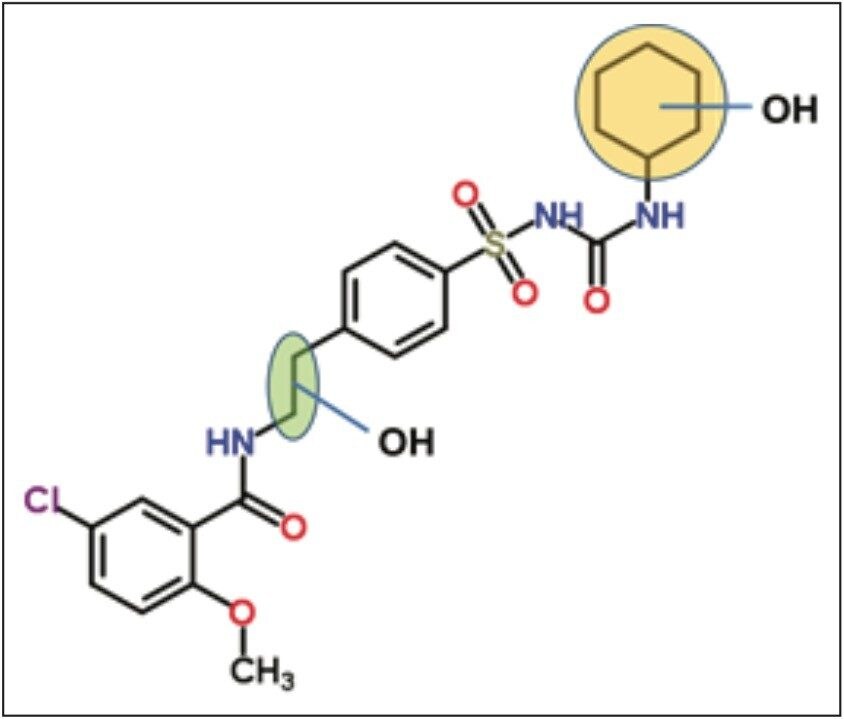
The analysis of glyburide metabolites in microsomal incubate illustrates the complexity of metabolite samples, which demands the use of a sub-2-micron particle sized column under UPLC conditions to deliver the required separation and quantification. Equally important is a compatible MS detector with a fast scan rate capable of capturing the chromatographic separation.

When the scan speed is insufficient, the LC separated peaks will merge, resulting in loss of peak information and incorrect metabolite assignment. A scan speed of 0.3 seconds was found to be insufficient to separate and identify all glyburide metabolites and resulted in false negatives. With its fast speed and excellent MSE spectra quality, the combination of Waters’ ACQUITY UPLC I-Class and Xevo G2-S QTof technologies offers the best-in-class solution for confidence in metabolite identification.

References

  1. Rodriguez-Aller M, Veuthey J, Gurny R, Guillarme D. Coupling ultra highpressure liquid chromatography with mass spectrometry: Constraints and possible applications. J. Chromatogr. A. 1292 (2013): 2–18.
  2. Rousu T, Herttuainen J, Tolonen A. Comparison of triple quadrupole, hybrid linear ion trap triple quadrupole, time-of-flight and LTQ-Orbitrap mass spectrometers in drug discovery phase metabolite screening and identification in vitro – amitriptyline and verapamil as model compounds, Rapid Comm. Mass Spec. 24, 2010, 939–957.
  3. Holčapek M, Jirásko R, Lísa M. Recent developments in liquid chromatographymass spectrometry and related Techniques, J. Chromatogr. A, 1259 (2012) 3–15.
  4. Tiller PR, Yu S, Castro-Perez J, Fillgrove KL, Baillie TA. High-throughput, accurate mass liquid chromatography/tandem mass spectrometry on a quadrupole time-of-flight system as a ‘first-line’ approach for metabolite identification studies, Rapid Comm. Mass Spec. 2008; 22: 1053–1061.

720004762, March 2013

トップに戻る トップに戻る