This Application note demonstrates selective analysis of patulin in apple juice at ten times below regulatory requirements for juice and half the strictest EU regulation for baby food using the ACQUITY UPLC H-Class System with the ACQUITY QDa Detector.
Patulin is a mycotoxin produced by several Penicillium, Aspergillus, and Byssochlamys mold species that are commonly found on apples. Apples that have been damaged or bruised prior to processing are more susceptible to contamination by patulin producing molds.
Proper handling and storage of apples is important to prevent the growth of patulin producing molds. When patulin-contaminated apples are processed into juice high levels of patulin are possible. The thermal stability of patulin prevents its decomposition during pasteurization.
The effects of patulin on humans are not known but intestinal lesions and stomach hemorrhages have been observed in mice and rats. Owing to this toxicity, the U.S. FDA has set a maximum residue level (MRL) of 50 μg/kg of patulin in apple juice and apple juice concentrates.1 Other countries including China, Japan, and the EU have also set the maximum contamination of patulin to 50 μg/kg in apple juice products. The EU also has lower limits for patulin in solid apple products (25 μg/kg), such as apple puree, and products designed for infants and young children (10 μg/kg).2
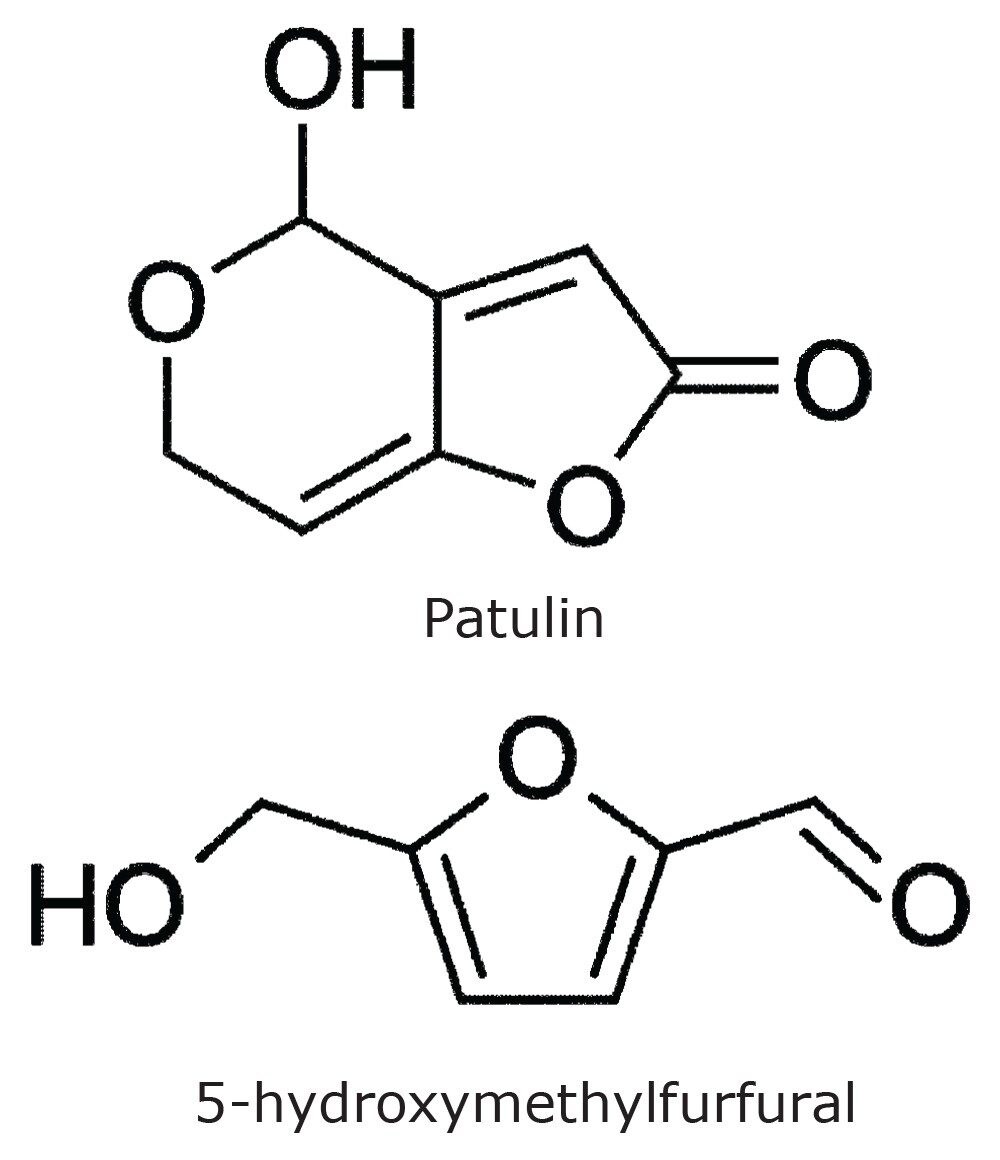
In order to protect both producers and consumers, accurate testing is required to prevent the contamination of apple juice with patulin. Patulin testing has typically employed LC separation with UV detection at 273 nm. Also absorbing at this wavelength, however, is 5-hydroxymethylfurfural (HMF), which is produced in the pasteurization of apple juice. The structures are shown in Figure 1.
Overall the sample preparation resulted in a five-fold concentration. The calibration standards were prepared to take into account this concentration step (the range 5 to 200 μg/L in apple juice equates to an in-vial calibrationrange of 25 to 1000 μg/L).
HMF therefore has the potential to interfere in the analysis of patulin when using UV detection. Furthermore, UV methods struggle to detect down to the lowest levels required for products that are destined for consumption by infants and children. In order to improve the selectivity and reduce limits of quantification, mass detection is desirable in the analysis of patulin.3 Deployment of mass spectrometry in some laboratories may require workflow, infrastructure, or resource modifications to operate and maintain the systems. ACQUITY QDa Detector offers laboratories the opportunity to capture the benefits of mass detection without the challenges associated with the adoption of mass spectrometers.
In this application note, we present an ACQUITY UPLC method using mass detection with the ACQUITY QDa Detector. This ACQUITY QDa can easily be added to existing liquid chromatography workflows in order to vastly increase the selectivity that could previously be obtained with LC detectors. It has been designed for chromatographic systems so it can be easily implemented into existing laboratory configurations.
UPLC system: |
ACQUITY UPLC H-Class |
Column: |
ACQUITY UPLC BEH Shield RP18 1.7 μm, 2.1 x 100 mm |
Column temp.: |
40 °C |
Injection volume: |
10 μL |
Flow rate: |
0.60 mL/min |
Mobile phase A: |
Water + 0.1% NH4OH |
Mobile phase B: |
Acetonitrile + 0.1% NH4OH |
Weak needle wash: |
50:50 water:methanol |
Strong needle wash: |
50:50 water:methanol |
Seal wash: |
90:10 water:acetonitrile |
Time(min) |
Flow rate(mL/min) |
%A |
%B |
Curve |
---|---|---|---|---|
Initial |
0.60 |
99 |
1 |
6 |
1.80 |
0.60 |
99 |
1 |
6 |
2.30 |
0.60 |
10 |
90 |
6 |
2.80 |
0.60 |
10 |
90 |
6 |
2.81 |
0.60 |
99 |
1 |
6 |
5.00 |
0.60 |
99 |
1 |
6 |
Table 1. UPLC gradient method for analysis of patulin in apple juice.
MS system: |
ACQUITY QDa (Performance) |
Ionization mode: |
ESI- |
Capillary voltage: |
0.8 kV |
Desolvation temp.: |
500 °C |
Source temp.: |
150 °C |
Cone voltage: |
2 V |
Patulin SIR: |
152.9 |
HMF SIR: |
124.8 |
Sampling rate: |
5 Hz |
Solid phase extraction (SPE)³
Apple juice, which had been filtered and pasteurized prior to bottling, was purchased from a local supermarket. The juice was extracted using SPE.
Cartridge: |
Oasis HLB 3 cc/60 mg |
Condition: |
3 mL methanol 3 mL water |
Load: |
2.5 mL sample |
Wash 1: |
3 mL 1% NaHCO3 (1 g/100 mL) |
Wash 2: |
1 mL 0.1% acetic acid Dry under vacuum |
Elute: |
2 x 1.5 mL 10 ethyl acetate in methyl t-butyl ether (MTBE) |
Reconstitute: |
500 μL water |
Single ion recording (SIR) was used to monitor both patulin and 5-hydroxymethylfurfural (HMF), while simultaneously acquiring full-spectrum data using RADAR Technology. When analyzing patulin using UV detection, baseline resolution between the two compounds is required as they both absorb at 273 nm. When patulin is analyzed using mass detection, the requirement of baseline separation is removed as the two compounds have different masses (m/z 153 and m/z 125 for patulin and HMF, respectively). While separation from HMF is not required when mass detection is employed, the separation of HMF and patulin does allow for UV detection to be included in line with mass detection if desired (not shown here). However, the mass detection will have lower limits of detection.3
As shown in Figure 2, patulin was successfully detected in apple juice and mass detection with SIR provided high selectivity for this analysis. Patulin was detected down to spiked concentrations of 1 μg/L. The lowest spiked concentration that resulted in a signal-to-noise (S/N) ratio above 10 (using the peak-to-peak method) was 5 μg/L. This level is ten times lower than required by the EU and FDA regulations for apple juice and half of the strictest EU level for baby food.
Figure 3 shows the calibration curve obtained for patulin post-spiked into extracted apple juice to create a matrix-matched calibration curve from 5 to 200 μg/L. Excellent linearity was achieved in this range, as evidenced by the correlation coefficient (r2) of 0.999.
The analysis of food and beverages is often complicated by matrix interferences that are co-extracted with the analytes of interest. It is therefore important to assess effects introduced by the matrix, and if necessary, adjust sample preparation protocols or chromatographic methods to ensure a robust method. Using the described sample preparation procedure, the response of patulin spiked into extracted apple juice was compared to the response of patulin spiked into water across the calibration range. This was achieved by comparing the slope of the calibration curve in matrix to the slope of the calibration curve in solvent standards (water). Figure 4 shows that the calibration curve of patulin in water was within the same range as the matrix matched calibration curve shown in Figure 3. The signal suppression observed from the matrix effect of apple juice was approximately 10%, providing confidence in the robustness of the method.
The use of SIR with a mass detector vastly improves the selectivity of the method and reduces any impact from co-extracted components that could interfere in UV analysis. Another useful feature of mass detection is the ability to acquire full-spectrum data across the entire mass-to-charge (m/z) range of interest. Waters’ RADAR Technology enables the simultaneous acquisition of SIR channels with full spectrum background data. This technology is especially useful to monitor high-level background matrix interference in food and beverage matrices. In the current work, full spectrum data was acquired in the same ionization mode used to analyze patulin (negative ion ESI). The resulting background base peak intensity chromatogram is shown in Figure 5, along with the simultaneously acquired SIR channels of patulin and HMF. As can be seen from these chromatograms, patulin elutes in a region of low matrix interference. This provides further confidence that the method is robust and minimal matrix effects are likely to occur for patulin in apple juice using this methodology.
In order to assess repeatability, a series of 50 replicate injections at 5 μg/L in apple juice were performed. The TrendPlot result, which is automatically plotted within the TargetLynx Application Manager, is shown in Figure 6. The repeatability was 9%, well within the 20% tolerance as specified in EU legislation 2002/657/EC.4
720004788, November 2016