• アプリケーションノート

Qualitative and Quantitative Analysis of Gentamicin Sulfate and Related Impurities on ACQUITY UPLC with QDa

Qualitative and Quantitative Analysis of Gentamicin Sulfate and Related Impurities on ACQUITY UPLC with QDa

  • Bheeshmacharyulu S
  • Bronsky Gopinadh
  • Dilshad Pullancheri
  • Dr. Padmakar Wagh
  • Waters Corporation

Abstract

In this method, five main analytes of Gentamicin (C1, C1a, C2, C2a, and C2b) and related impurities of sisomicin, G1-418, garamine, gentamicin B, and gentamicin A, A1, A3 are separated within 35 minutes using an ACQUITY UPLC H-Class System with an ACQUITY QDa Mass Detector. The ACQUITY QDa Mass Detector is robust, reliable, and requires minimal user setup optimization, calibration, or adjustment. It integrates with current LC, ACQUITY UPLC, ACQUITY UPC2, and purification systems.

Benefits

Separation of five active components of gentamicin and its related impurities within a 35-minute run time on ACQUITY UPLC H-Class System with ACQUITY QDa Detector.

Introduction

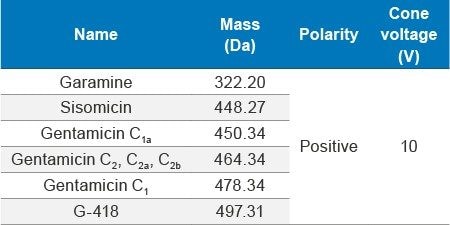
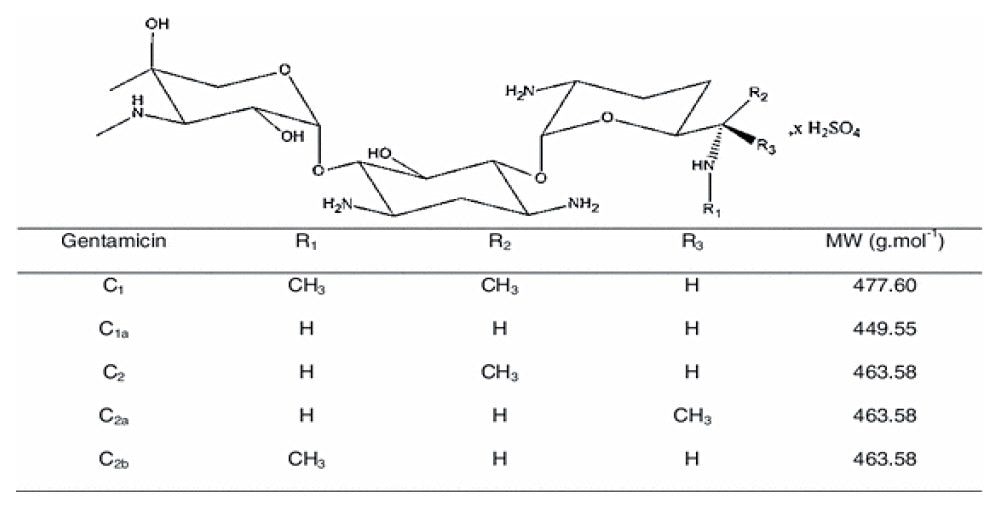
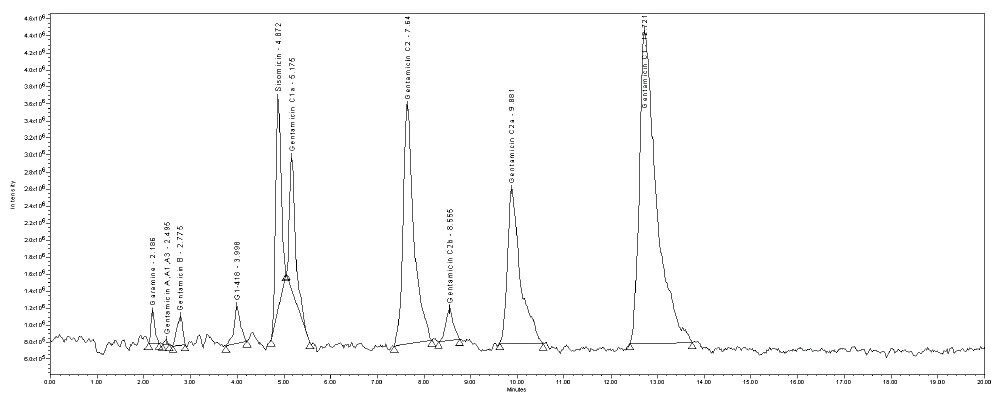
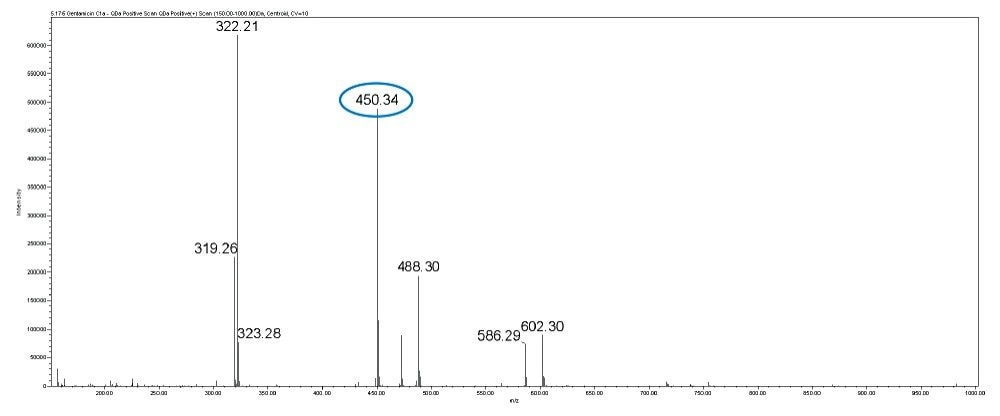
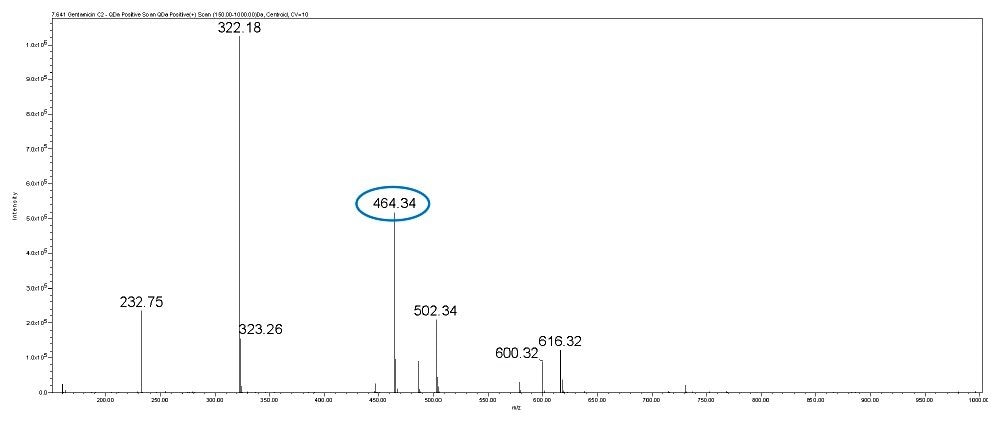
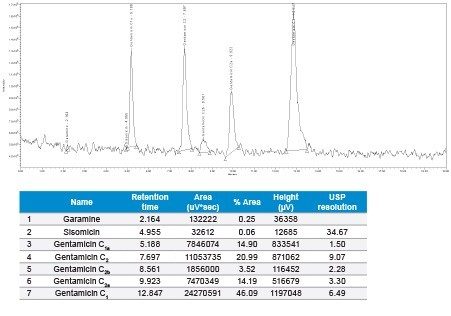
Gentamicin is an aminoglycoside antibiotic (AG) produced by Micromonospora purpurea and is widely used for the treatment of serious infections caused by both gram-negative and gram-positive bacteria. It is a mixture consisting of five major components, designated C1, C1a, C2, C2a, and C2b together with numerous minor components including A, B, B1, and X2. Gentamicins are basic, water-soluble, relatively stable, structurally and closely related compounds without UV absorbing chromophores. This makes the HPLC analysis more difficult and challenging. Detection techniques like UV are not sensitive enough to detect low levels of related compounds of gentamicin.

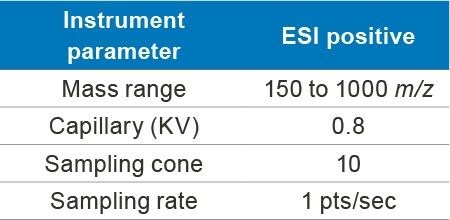
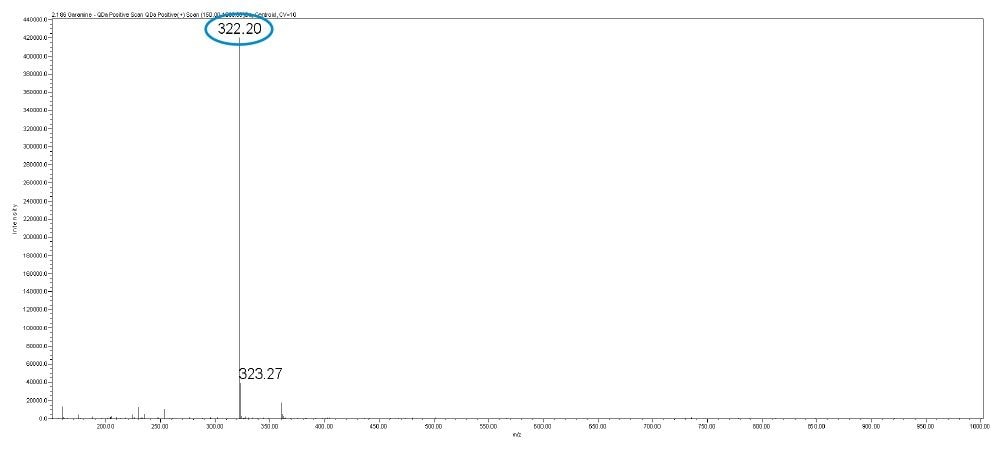
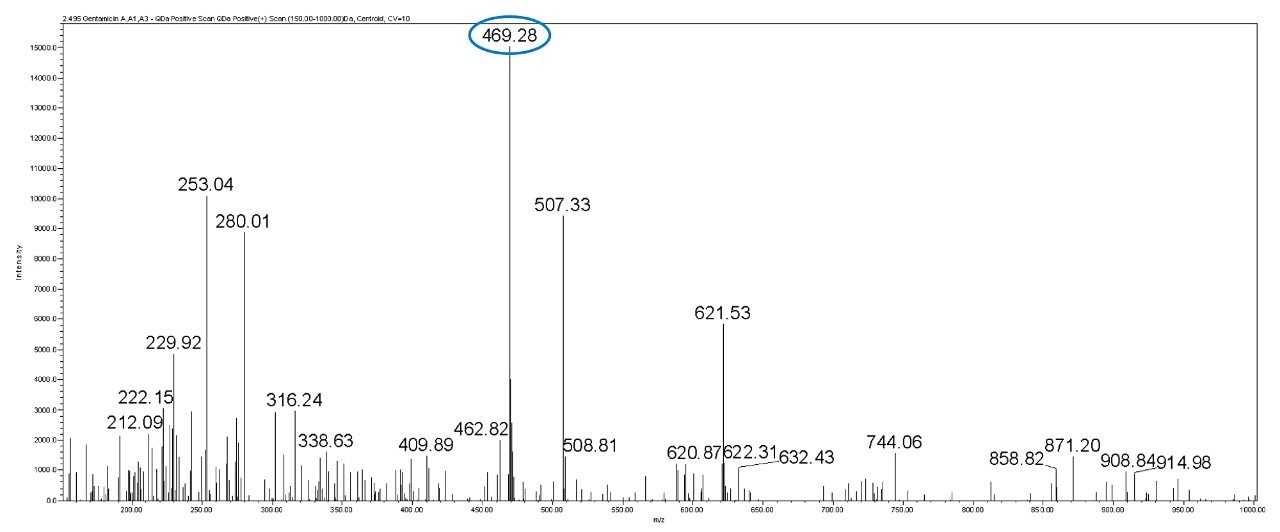
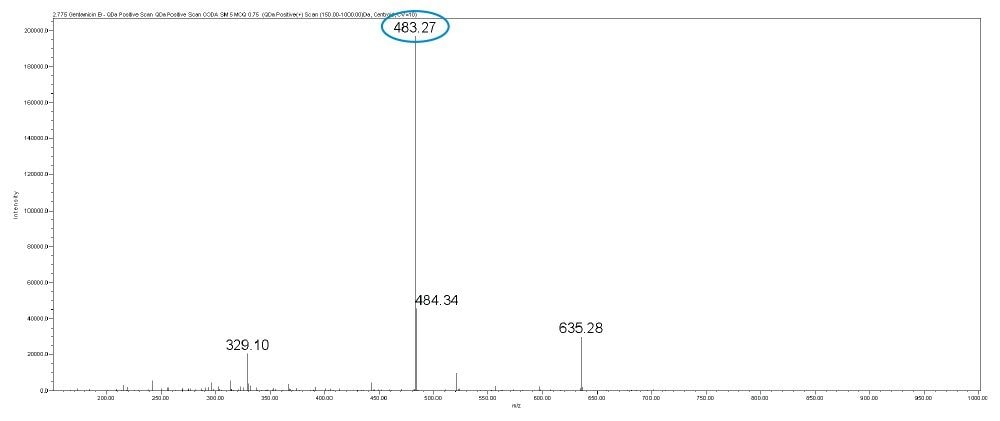
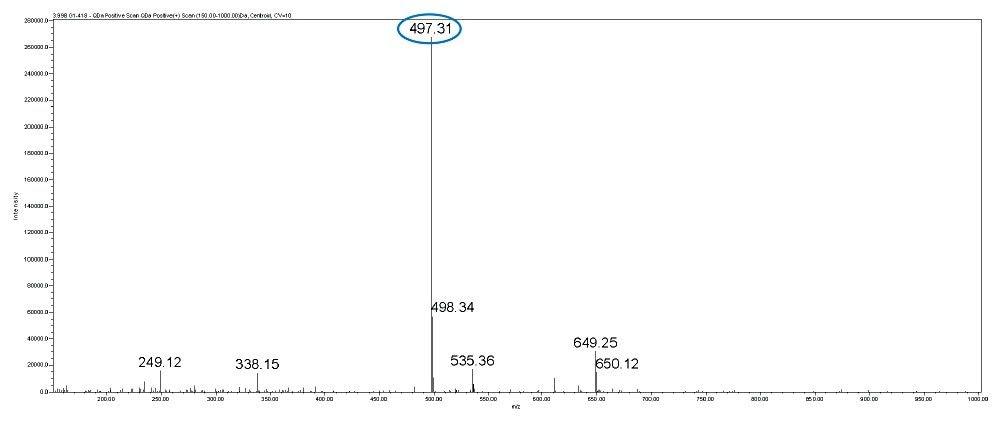
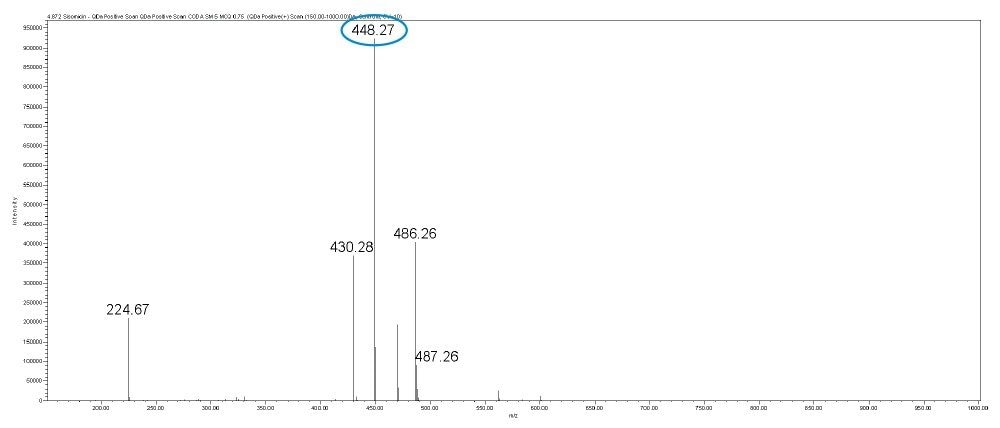
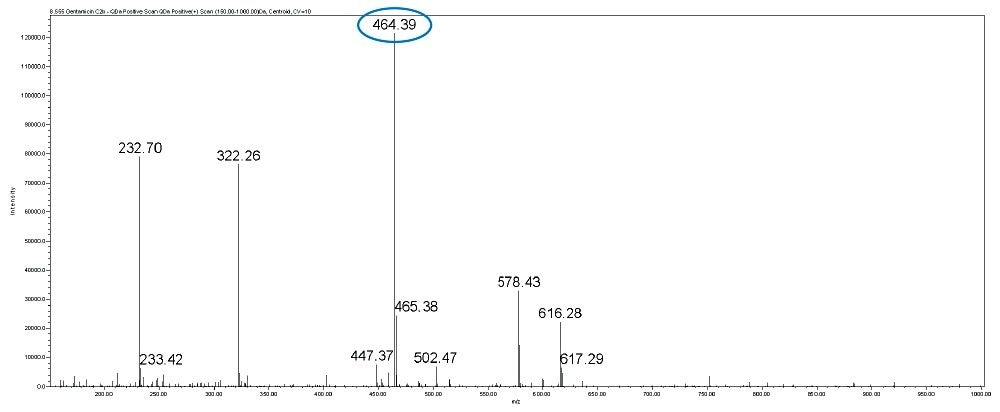
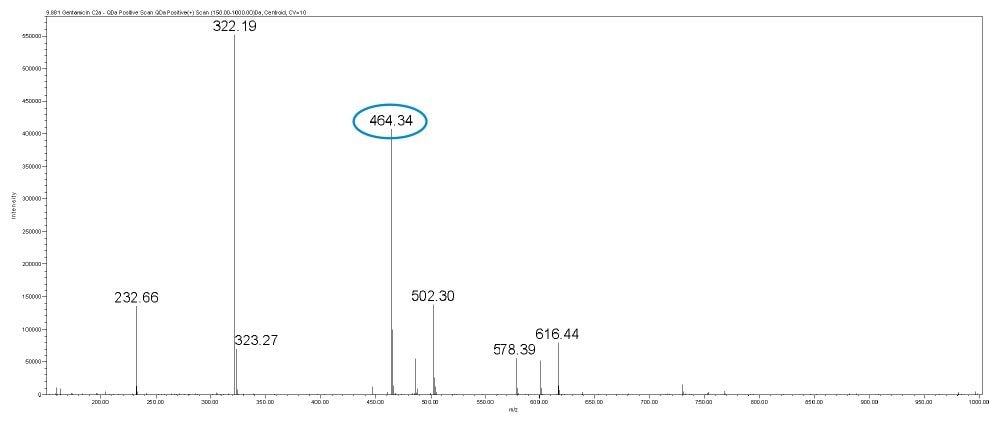
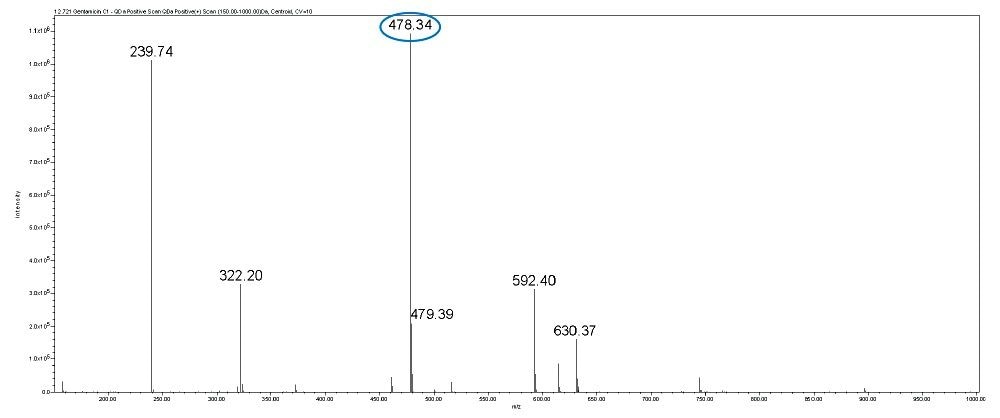
Mass spectrometry is the technique of choice for the detection of aminoglycosides including gentamicin because of its high sensitivity and identification of compounds. There are no derivatization steps involved for this analysis technique. 

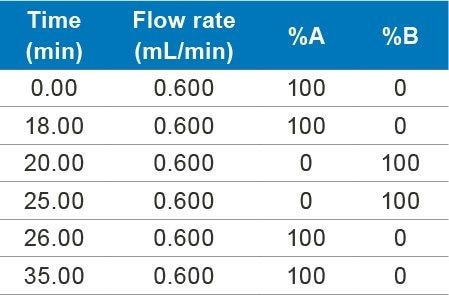
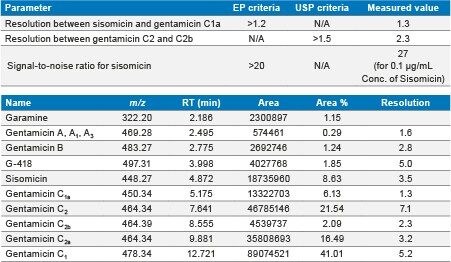
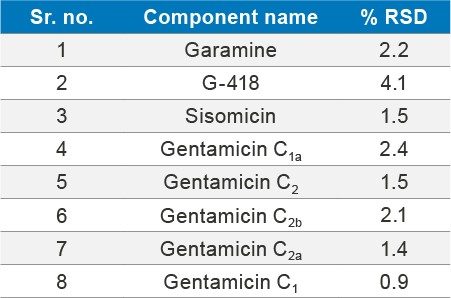
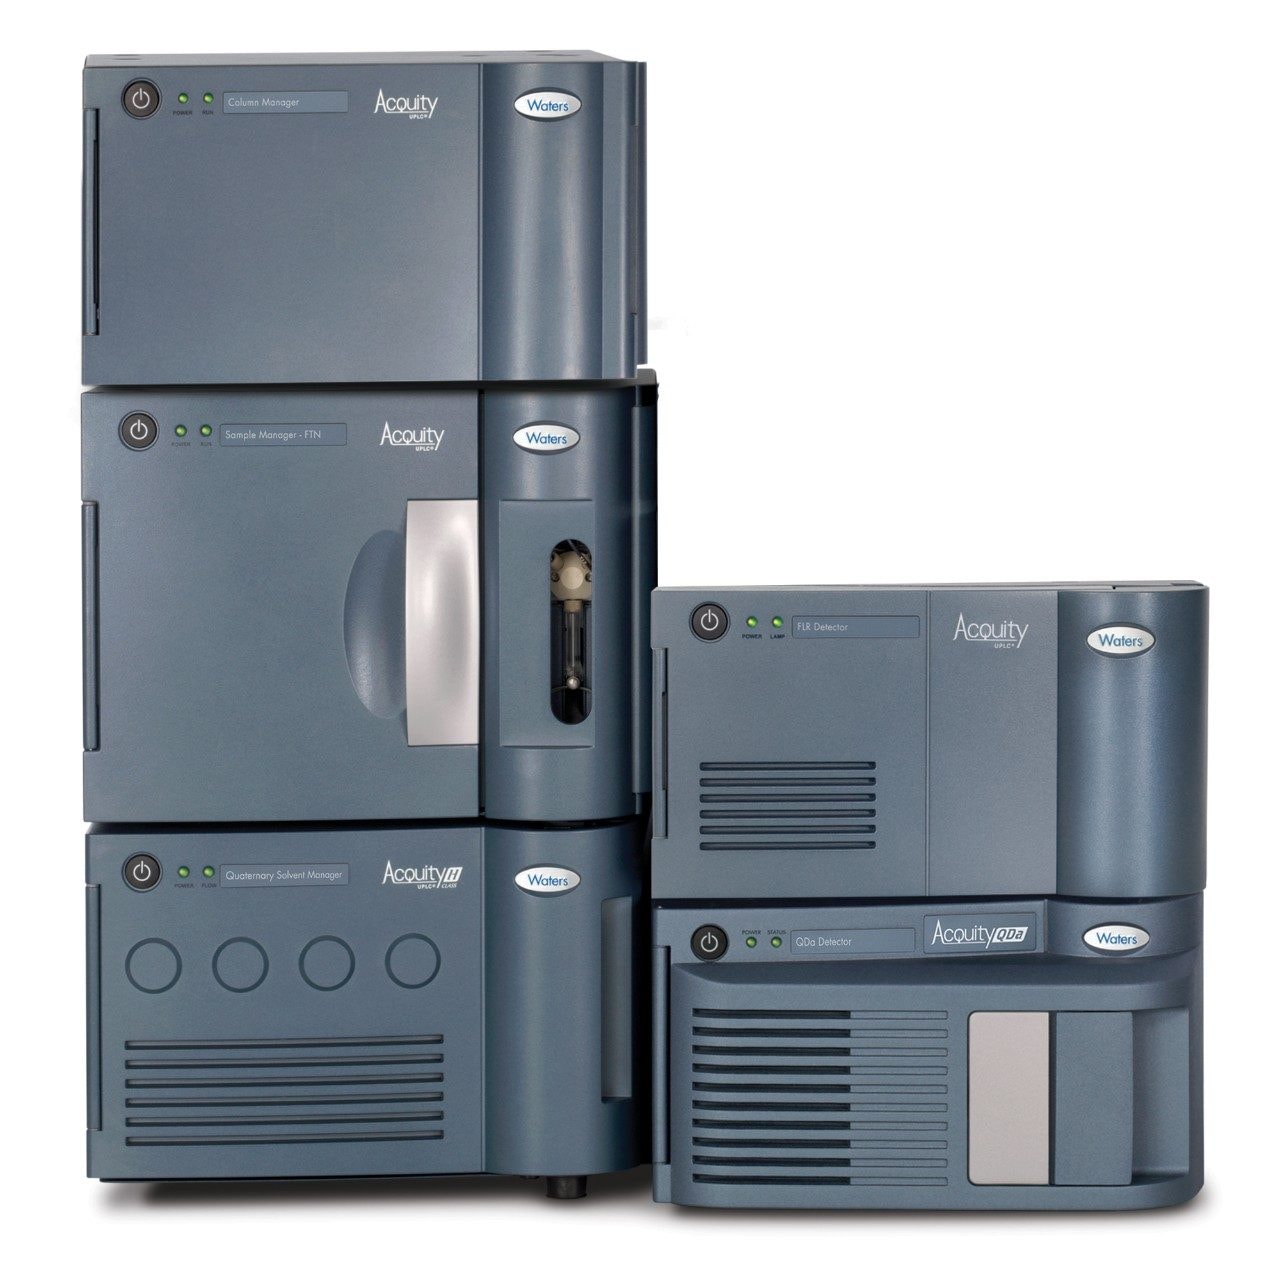
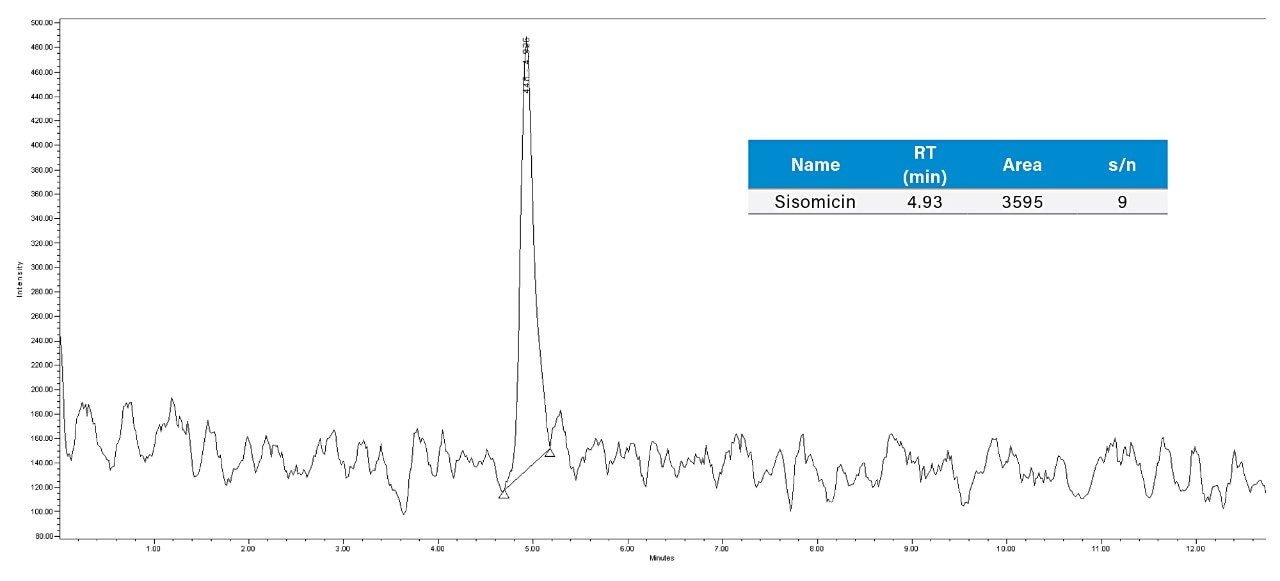
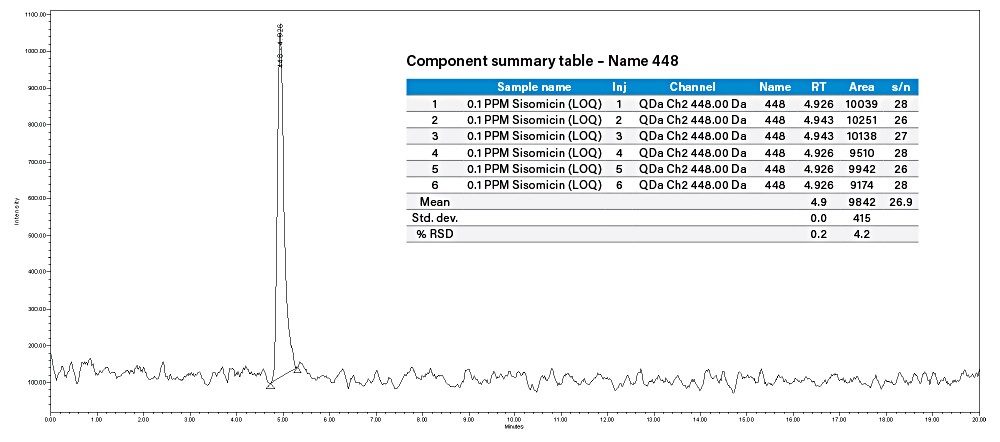
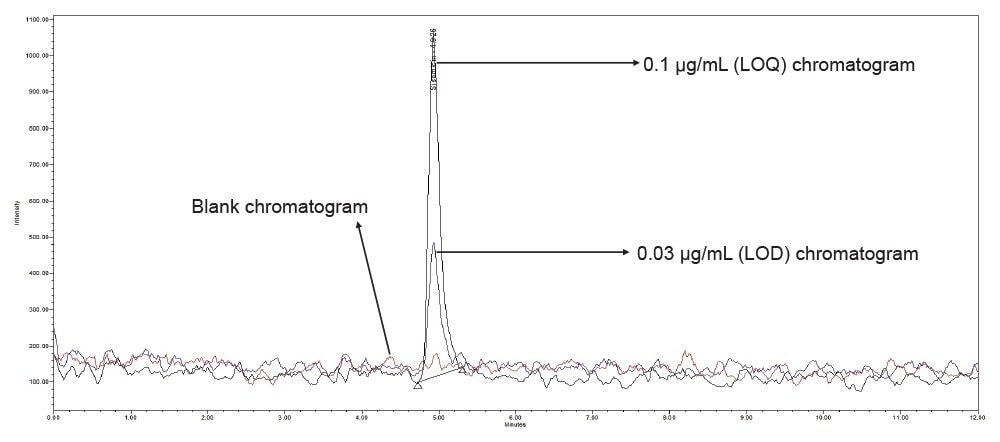
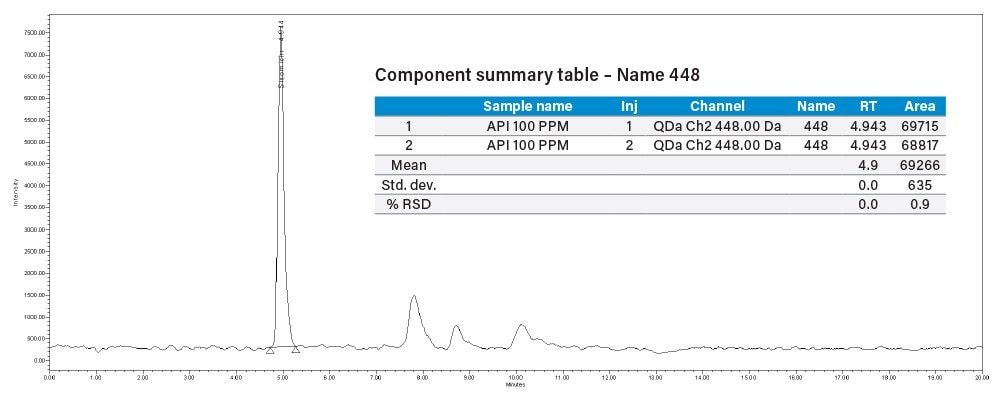
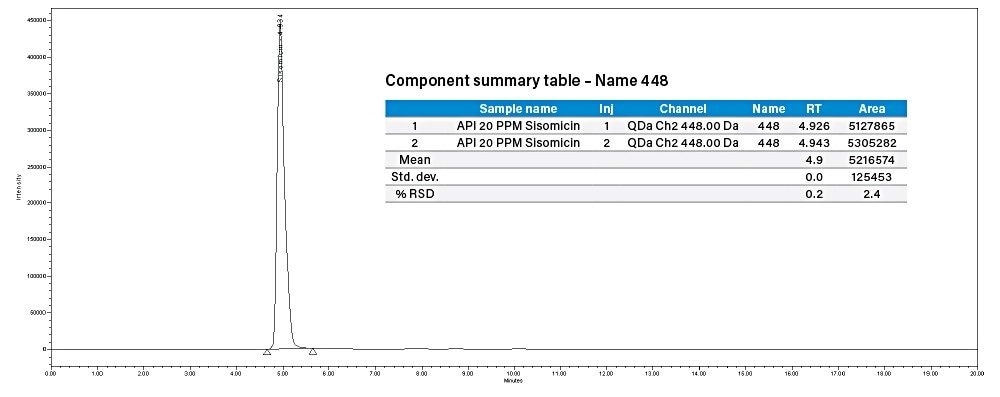
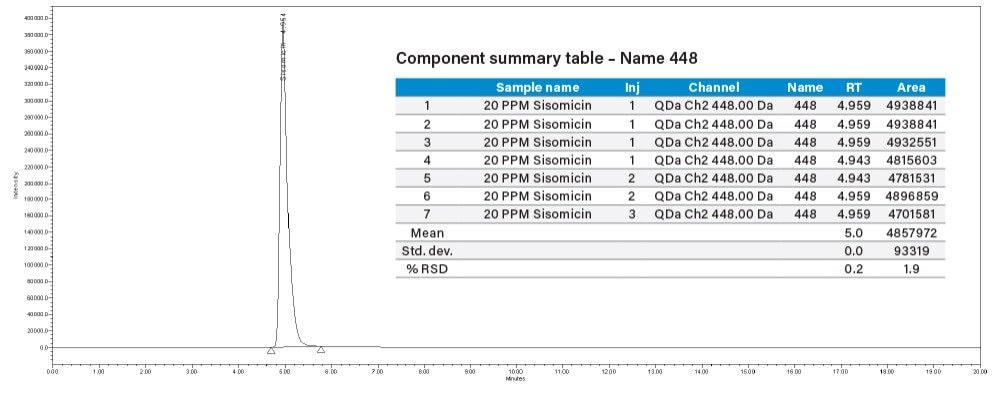
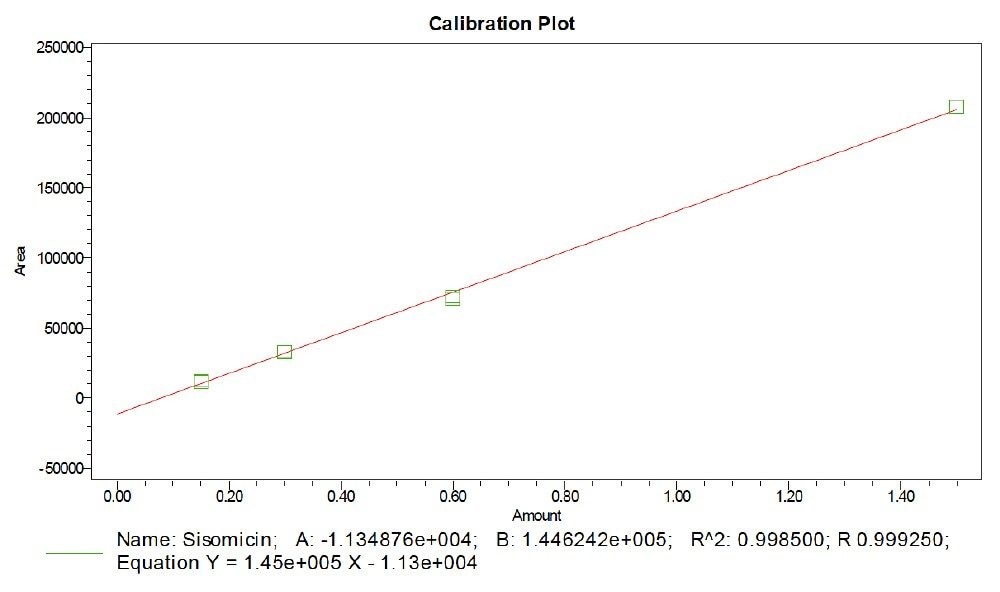
In this experiment we have developed a 35-minute method for the qualitative and quantitative analysis of gentamicin sulfate and its related impurities on an ACQUITY UPLC System with an ACQUITY QDa Mass Detector.

The ACQUITY QDa Mass Detector is robust, reliable, and requires minimal user setup optimization, calibration, or adjustment. It integrates with current LC, ACQUITY UPLC, ACQUITY UPC2, and purification systems. This mass spectral information integrates seamlessly into the same workflow. The ACQUITY QDa Detector offers extended sample detection to quantify compounds with no UV response and is compatible with Empower Chromatography Data Software.

Experimental

LC conditions

System:

ACQUITY UPLC H-Class with ACQUITY QDa Detector

Column:

Atlantis T3, 3 μm, 4.6 mm × 150 mm (p/n: 186003729)

Flow rate:

0.6 mL/min

Buffer preparation:

0.2% TFA in water adjusted pH 2.3 with ammonia solution

Mobile phase A:

99.5% (buffer):0.5% (ACN+IPA:[1:1])

Mobile phase B:

100% methanol

Column temp.:

25 °C

Sample temp.:

5 °C

Injection volume:

1 μL

Sample concentration:

100 μg/mL

Wash and purge solvent:

1:1 water:acetonitrile

Seal wash:

9:1 water:methanol

Diluent:

Water

Gradient:

Method parameters for ACQUITY QDa:

SIR channels:

Standard solution preparation

Accurately weighed 10 mg of gentamicin sulfate (API) and dissolved in 2 mL of water as a standard stock solution of  5000 µg/mL concentration. Working solutions were prepared by appropriate dilutions from stock.

Accurately weighed 6 mg of sisomicin and dissolved in 10 mL of water as a stock solution of 600 µg/mL concentration. Working solutions were prepared by appropriate dilutions from stock.

Sample preparation

Sample solutions of injections containing 20 mg/2 mL of gentamicin sulfate, were prepared by diluting the sample with water to a working concentration of 100 µg/mL of total gentamicin.

Results and Discussion

Injected API spiked with sisomicin standard and observed all five analytes and impurities.

System suitability parameters:

Reproducibility

The reproducibility test was performed with API of 100 µg/mL concentration spiked with 50 µg/mL of sisomicin impurity, the %RSD observed for the eight components in SIR method were within 5%.

%RSD values for the eight components in SIR method.

Quantitation of sisomicin in gentamicin

Sisomicin LOD and LOQ

Injected 0.03 µg/mL (LOD) and 0.1 µg/mL (LOQ) concentration of sisomicin standard solution and observed that the S/N is 9 for sisomicin peak in 0.03 µg/mL and 27 is for 0.1 µg/mL.

Recovery study performed for sisomicin

Injected 20 µg/mL concentration of sisomicin individual standard and 20 µg/mL sisomicin solid powder spiked with 100 µg/mL concentration of API gentamicin. 105.96% recovery was observed. 

% Recovery = (Sisomicin peak area in spiked solution – API solution)/[sisomicin std area (20 μg/mL)]
                    = (5216574-69266)/4857972
                    = 105.96%

Linearity for sisomicin

Prepared linearity solutions of sisomicin with different concentrations of 0.15 µg/mL, 0.3 µg/mL, 0.6 µg/mL, and 1.5 µg/mL solutions and plotted calibration curve, observed R value is 0.999 and R2 value is 0.998.

Qualitative/sample analysis

Diluted gentamicin sulfate USP injectable sample (Lot No: 6110501 – 20 mg/2 mL) to 100 µg/mL concentration and injected, observed the related impurities in SIR method.

Conclusion

In this method, five main analytes of Gentamicin (C1, C1a, C2, C2a, and C2b) and related impurities of sisomicin, G1-418, garamine, gentamicin B, and gentamicin A, A1, A3 are separated within 35 minutes using an ACQUITY UPLC H-Class System with an ACQUITY QDa Mass Detector.

The ACQUITY QDa Mass Detector successfully achieved high sensitivity detection for sisomicin impurity at 0.03 µg/mL as LOD and 0.1 µg/mL as LOQ. It achieved reliable results. The %RSD obtained for all gentamicin analytes and impurities sisomicin and G-418 is less than 5%.

Figure 1. Gentamicin sulfate. 
Figure 2. ACQUITY UPLC H-Class System with ACQUITY QDa Detector.
Figure 3. MS TIC of API spiked with sisomicin.

MS spectrum in ESI positive mode

Figure 4. MS spectrum of garamine.
Figure 5. MS spectrum of gentamicin A, A1, A3.
Figure 6. MS spectrum of gentamicin B.
Figure 7. MS spectrum of G-418.
Figure 8. MS spectrum of sisomicin.
Figure 9. MS spectrum of gentamicin C1a.
Figure 10. MS spectrum of gentamicin C2.
Figure 11. MS Spectrum of Gentamicin C2b.
Figure 12. MS spectrum of gentamicin C2a.
Figure 13. MS spectrum of gentamicin C1.
Figure 14. SIR chromatogram sisomicin of 0.03 µg/mL (LOD).
Figure 15. SIR chromatogram sisomicin of 0.1 µg/mL (LOD).
Figure 16. Overlay of SIR chromatogram of blank, LOD, and LOQ of sisomicin.
Figure 17. SIR chromatogram sisomicin in 100 µg/mL of API solution.
Figure 18. SIR chromatogram sisomicin 20 µg/mL spiked in 100 µg/mL of API solution.
Figure 19. SIR chromatogram sisomicin 20 µg/mL individual standard and result table.
Figure 20. Linearity curve for sisomicin.
Figure 21. TIC chromatogram of gentamicin USP (Lot No: 6110501 – 20 mg/2 mL) of 100 µg/mL concentration.

References

  1. Jammal, N.; AL-Mardini, M.A. Development and Validation of LC-MS Method for the Estimation of Gentamicin Sulfate and its Impurities in Injections. International Journal of Pharmaceutical Sciences Review and Research. 2014, 27(1), 70–73.
  2. Graheka, R.; Zupancic-Kralj, L. Identification of Gentamicin Impurities by Liquid Chromatography Tandem Mass Spectrometry. J. Pharm. Biomed. Anal. 2009, 50(5), 1037–1043.
  3. Gentamicin Sulphate, European Pharmacopeia (EP), 2014, 8.1, 2326–2382.
  4. Gentamicin Sulphate, United States Pharmacopeia (USP), USP 37–NF32, 3138–3139. 

720006597, June 2019

トップに戻る トップに戻る