In this application note, samples of coffee brews rapidly profiled using UPLC-MS/MS in order to elucidate the origin and treatment of the beans.
Coffee is a chemically complex beverage, brewed from the roasted seeds of the berries (referred to as beans) most commonly from two plants of the Coffea genus: Coffea arabica (Arabica or Arabian coffee) and Coffea canephora (Robusta coffee). The two different species give rise to distinct variation in the taste and aroma of the drink. Further variations can be introduced by the fermentation, processing, roasting, grinding, brewing, and storage, which can make the distinction between the species more difficult to the consumer, and there are concerns that the cheaper Robusta may be fraudulently substituted for Arabica.
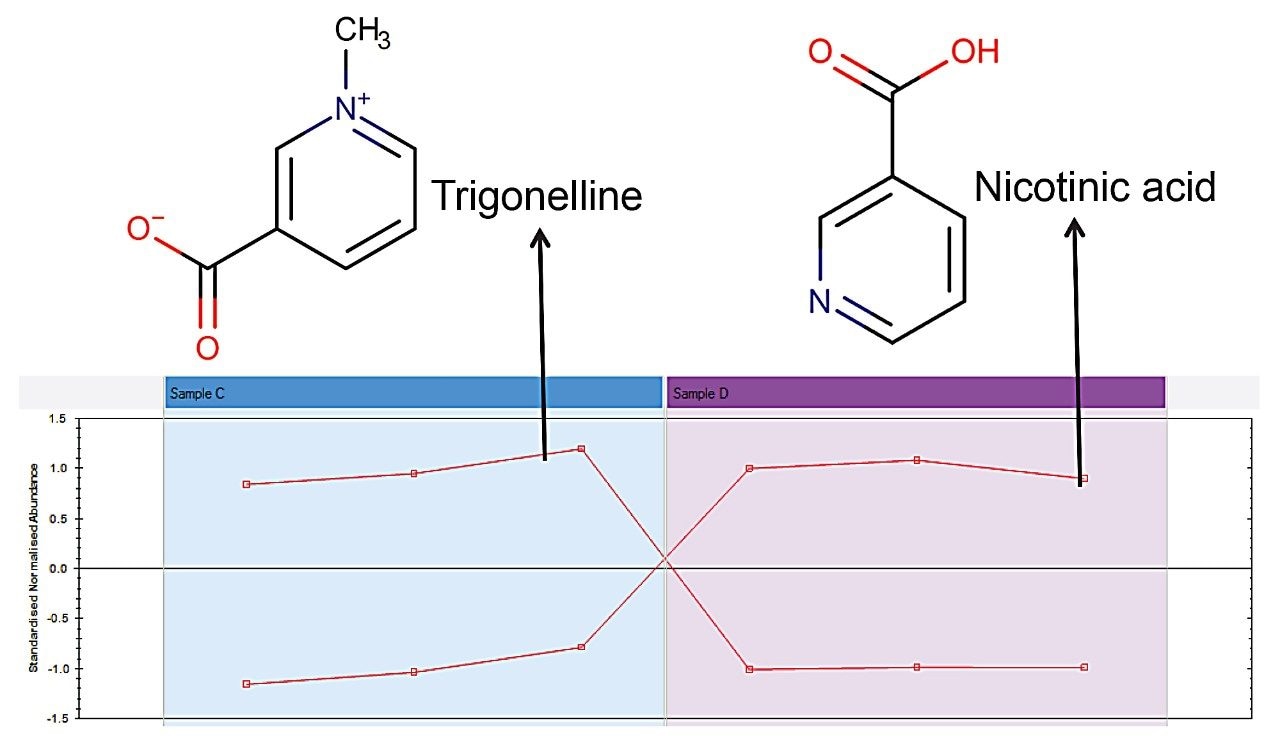
Much of the chemistry of the flavor and aroma compounds is understood, and attributed to compounds such as sucrose, furans, pyrazine, alkyl-pyridines, pyrroles, and of course caffeine. Related precursors/metabolites of these compounds that are seen as desirable include trigonelline and chlorogenic acid.
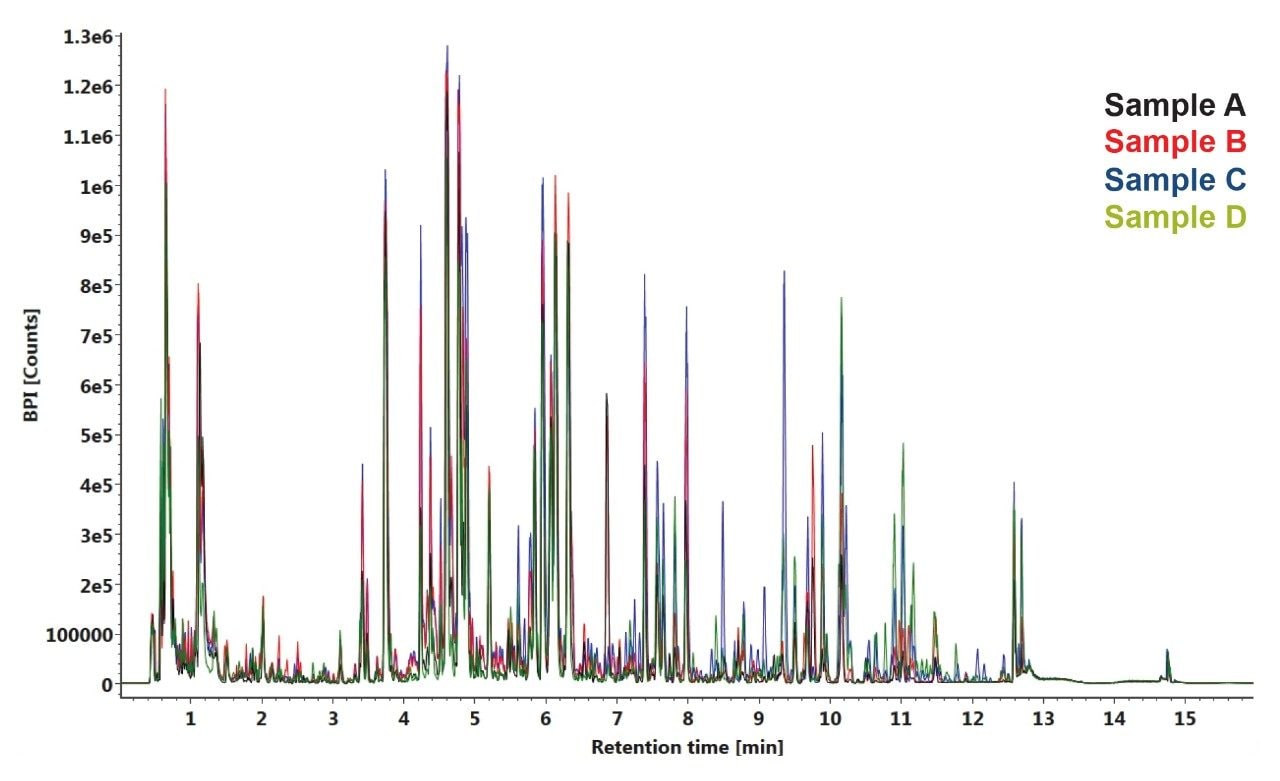
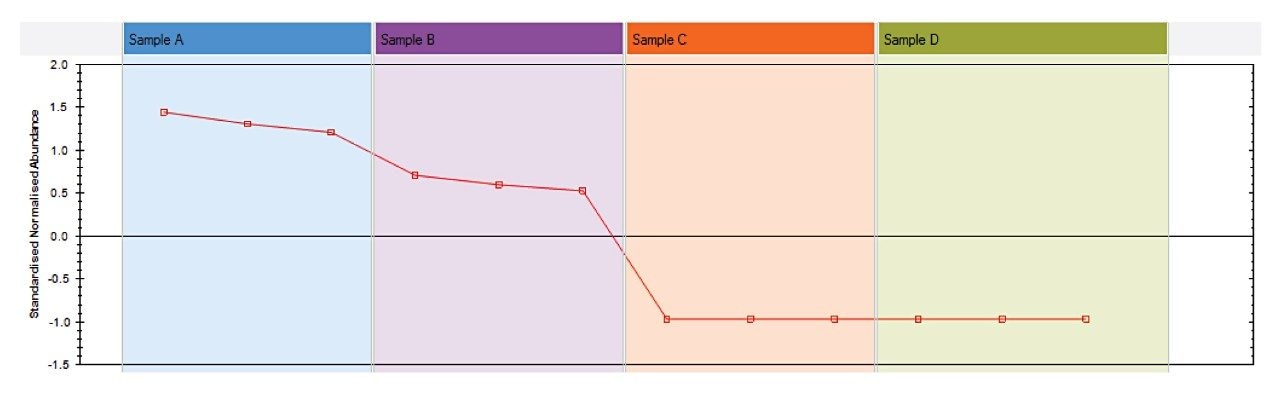
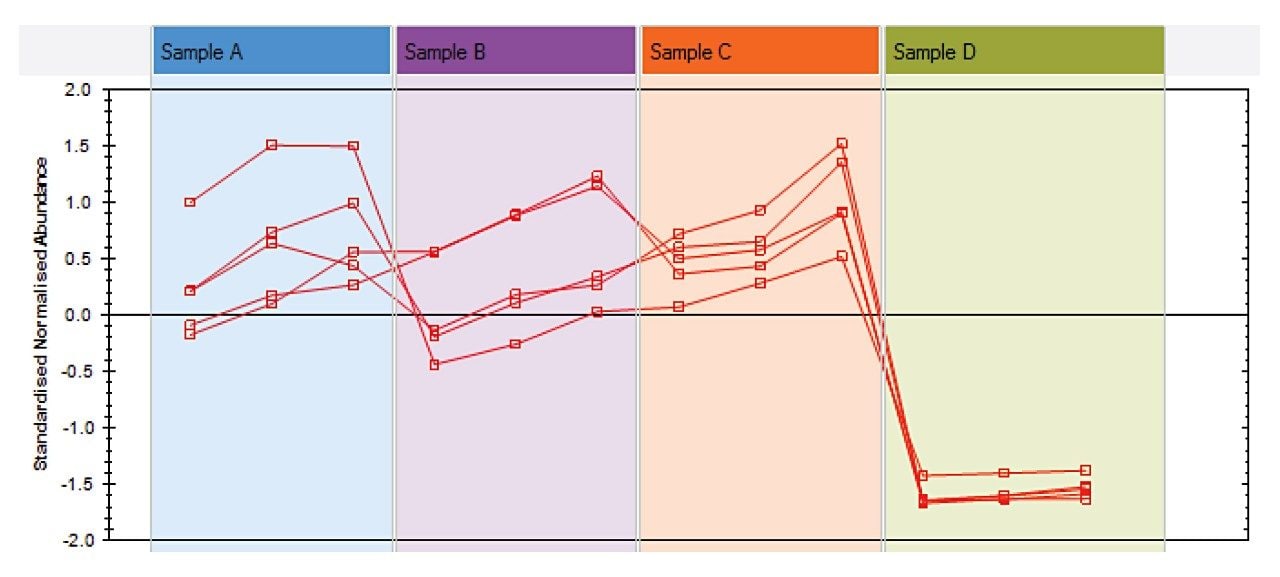
Providing chemical information on coffee brews can be used to assess the quality of a grind, process or species, or to further explore the taste and aroma chemistry. In this application note, samples of coffee brews were provided blind, in order to elucidate the origin and treatment of the beans.
Coffee beans were ground and extracted with boiling water (brewed), and the soluble supernatants provided. The four samples (A, B, C and D) were provided by a major food company without identification of origin or processing history. Each sample was centrifuged at 10,000 rpm for 10 minutes to remove insolubles and 1 µL of undiluted supernatant was injected on to the UPLC-QToF MS system. QC samples were made by mixing equal amounts of the four samples, and 12 injections from this mixture were used to condition the system at the start of the analysis. To ensure good experimental design, triplicates of the sample were then injected in a randomized run order, and the whole set were bracketed by a run order QC. Finally, the analytical run was concluded by two blank injections. This process was carried out in both positive and negative electrospray ionization conditions, and APCI ionization in both positive and negative modes.
UPLC system: |
ACQUITY UPLC I-Class PLUS |
Column: |
ACQUITY UPLC HSS T3 1.8 μm, 2.1 × 150 mm |
Column temp.: |
40 °C |
Sample temp.: |
10 °C |
Flow rate: |
0.6 mL/min |
Injection volume: |
1 μL |
Mobile phase A: |
Water with 0.1% formic acid |
Mobile phase B: |
Acetonitrile with 0.1% formic acid |
Total run time: |
16 min |
Time (min) |
%A |
%B |
Curve |
---|---|---|---|
0 |
99 |
1 |
Initial |
0.5 |
99 |
1 |
6 |
12 |
60 |
40 |
6 |
14 |
0 |
100 |
1 |
16 |
99 |
1 |
1 |
MS system: |
Xevo G2-XS QToF |
Ionization mode: |
ESI+, ESI-, APCI+, APCICollision energy (LE): 4 eV |
Collision energy (HE ramp): |
10–45 eV |
Scan time: |
0.1 s |
Acquisition range: |
50–1550 m/z |
Capillary voltage: |
1 kV |
Sampling cone: |
40 V |
Source temp.: |
120 °C |
Desolvation temp.: |
500 °C |
Cone gas flow: |
30 L/hr |
Desolvation gas flow: |
1000 L/hr |
Lock mass: |
Leucine encephaline (556.2771 m/z) |
Acquisition mode: |
MSE |
Instrument control software: |
MassLynx (v4.2) |
Raw data was processed using Waters Progenesis QI Software (v2.3), exporting data to EZInfo and querying online databases to help with unknown elucidation. Correlation Analysis within Progenesis QI was used to group together patterns of change across the samples.
UPLC-MS chromatograms of the four samples showed good separation with narrow chromatographic peak widths typically 3–5 s wide. Each replicate set overlays well across the replicates, showing good reproducibility of retention time and intensity. Although some of the peaks varied in intensity between samples, the retention times were well conserved across the entire data set, as shown in Figure 1.
Employing the Data Independent Analysis (DIA) method described here, MSE, users can gather reproducible relative quantitative data, while simultaneously acquiring fragment ions for compound identification and elucidation. The aggregate dataset was searched against several locally stored databases (HMDB, Metlin MS/MS spectral library, NIST, lipid maps) in Progenesis QI Software to identify the compounds present utilizing both the accurate mass precursor and the fragment ion information. More than 300 compounds were assigned from this search with a mass error of <5 ppm, an isotopic distribution similarity >85%, and a fragment score >10. Identified molecules included acids, esters, polysaccharides, glycosides, ketones, salts, and amino acids. Further compounds were also identified with high quality but were unresolved due to ambiguity caused by isomerization in the compound classes, especially in the chlorogenic acids (CGA) and associated lactones.
Long compound lists, although informative, provide little insight on their own when comparing complex samples. Further analysis was conducted utilizing the relative quantitative aspect of the data, using multivariate statistics by exporting the processed data to EZInfo. The Orthogonal Projections to Latent Structures Discriminant Analysis (OPLS-DA) model allows the determination of which compounds within a given sample contribute the most to the difference between that sample and the others. The compounds representing the largest difference in each of the samples after pair wise comparison of samples were selected and tagged, and those assignments returned to Progenesis.
Correlation Analysis within Progenesis QI Software was used to group the compounds that shared a particular pattern of change across the dataset. 39 compounds were found to have significant changes across the four datasets, which were then used to elucidate the species and roasting of the coffee beans. These were clustered into nine groups of distinct profiles of abundance across the samples.
Cluster 6 showed the greatest differentiators between samples A+B, and samples C+D. One of the compounds identified was Mozambioside, which is a bitter tasting furokaurane glycoside that is specific to Arabica beans1 and thought to contribute to Arabica’s distinctive taste. This was identified at high levels in samples A and B (Figure 4), indicating that these were extracts of Arabica beans. The lack of Mozambioside detected in samples C and D implied that these were likely to be extracts from Robusta beans. Samples C and D also had a higher relative level of caffeine than in samples A and B, which also supports this (data not shown).
Cluster 2 highlights differences in sample D compared to the rest of the samples. Many of the compounds identified in this pattern were Dicaffeoylquinic acid isomers (DiCQAs) (Figure 5).
During the roasting process these compounds are gradually transformed into Chlorogenic Acid Lactones (CGLs).2,3 The very low DiCQA content in sample D implies that this has gone through the roasting to a greater degree than the others. There was an earlier implication that the coffee beans used to make extracts A and B were different from extracts C and D, so further differences between samples C and D only were explored, to remove the species variable. Two compound profiles showed clear differences between these two samples: nicotinic acid and trigonelline, as seen in Figure 6. During roasting trigonelline is transformed into nicotinic acid,4 which correlates with the earlier observation that sample D went through a greater degree of roasting. Further to this, the quantity of trigonelline in sample C implies that these beans may not have been roasted at all. As levels of trigonelline vary between coffee species, with Arabica having slightly more than Robusta,5 this difference may not have been observed when looking across the full dataset.
720006504, February 2019