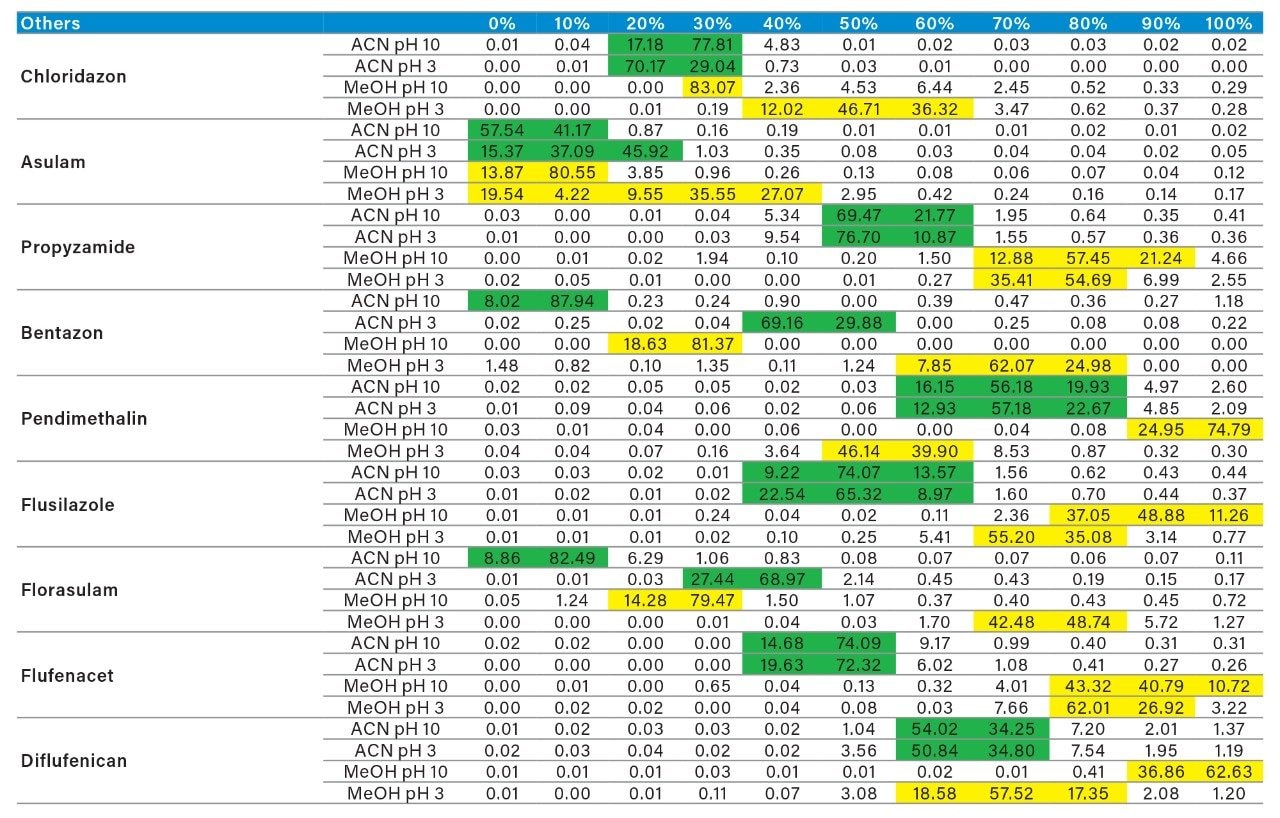
• アプリケーションノート

Novel Extraction Techniques with ACQUITY UPLC with 2D Technology: Part I Pesticides Screening in Drinking Water

Novel Extraction Techniques with ACQUITY UPLC with 2D Technology: Part I Pesticides Screening in Drinking Water

  • Jacob Samuel
  • Sabra R. Botch-Jones
  • Claude R. Mallet
  • ボストン大学医学部
  • Waters Corporation

Abstract

This application demonstrated the effectiveness of two extraction process, single stage captive and triple stage captive for pesticides screening by 2D LC ToF in drinking water. 

Benefits

  • Fast 30-minute extraction protocol
  • Trace level detection at parts per trillion
  • 90 second homogenization

Introduction

Many countries around the world have strict regulatory guide lines for drinking water quality. To satisfy legislative requirements, analytical methods have been developed to monitor a wide range of contaminants at trace levels using analytical techniques such as gas chromatography/mass spectrometry (GC-MS) or liquid chromatography/tandem quadrupole mass spectrometry (LC-MS/MS). 

Trace level analysis at ppt (part per trillion) constitute the bulk of the work load for the majority of testing laboratories worldwide. Current analytical techniques use a combination of extraction procedures, often requiring an enrichment process and accurate detection for any given target analyte. As such, large sample volumes are usually extracted using various manual extraction methods (i.e., solid-phase extraction (SPE), liquid-liquid, etc.)  and are concentrated into a smaller volume. As an example, a typical extraction method usually starts with a 500 mL of sample and ending up with a final volume of a 100 µL (5000:1 enrichment ratio). If higher sensitivity is required, the only alternative left is to process larger sample volume but will require an increase in time and manual labor.

In recent years, efforts are now being diverted to investigate effective screening methods with high resolution Time-of-Flight (ToF) instruments and with the capability of reaching sub ppb (part per billion) levels. With current single chromatography separation setup and the inherent low sensitivity of ToF instrument compared to tandem quadrupole MS, this demand is quite difficult to achieve. As such, a new analytical strategy is needed to reach those goals. This application will discuss the performance of 2D LC-QToF setup for the analysis of pesticides residues in drinking water at sub ppb level. With an enrichment factor of 20:1 from a rapid fractionation sample preparation protocol using two mixed mode sorbents, the gap between method and instrument limits of quantitation (LoQ) can be eliminated with large volume injection. Furthermore, by using an At-column dilution 2D LC configuration, 100% organic solvent extracts can be injected directly, thus eliminating all evaporation and reconstitution steps from any sample preparation protocol.1-4

Experimental

Two MRM transitions, quantification and confirmation, for each pesticide were selected and optimized. The MRM conditions are listed in Table 1. 

For this application, finding the optimum extraction and chromatographic condition for this multi-residue analysis posed a significant challenge. The chromatographic conditions were tested on several trapping chemistries (Oasis HLB, XBridge C18, and XBridge C8) and separation chemistries (BEH C18) The loading (low pH, high pH, and neutral pH) and eluting mobile phase (MeOH + 0.5% formic acid and ACN + 0.5% formic acid) were also optimized using an automated 6x6 process. 

All pesticides standards were purchased from Sigma Aldrich. The extraction process was performed on pre-conditioned  reversed-phase sorbent Oasis HLB SPE Cartridge, 6 cc, 150 mg, (p/n: 186003365) for the captive extraction or a dual mixed-mode Oasis MCX SPE Cartridge, 6 cc, 150 mg (p/n: 186000256) and MAX SPE Cartridge, 6 cc, 150 mg, (p/n: 186000369) for the screening extraction.

Chromatography and MS/MS conditions

Loading conditions

Column:

Oasis HLB Direct Connect HP, 20 μm, 2.1 × 30 mm (p/n: 186005231)

Loading:

MilliQ water (pH 7, no additives)

Flow rate:

2 mL/min

At-column dilution:

5% (0.1 mL/min loading pump and 2 mL/min diluting pump)

UPLC conditions

UPLC system:

ACQUITY UPLC with 2D Technology configured for “Trap and Elute” with At-column dilution

Runtime:

10 min

Column:

ACQUITY UPLC BEH C18, 1.7 μm, 2.1 × 50 mm (p/n: 176000863)

Column temp.:

60 °C

Mobile phase A:

Water + 0.5% formic acid

Mobile phase B:

Acetonitrile + 0.5% formic acid

Elution:

5-minute linear gradient from 5% (B) to 95% (B)

Flow rate:

0.500 mL/min (Elution pump)

Injection volume:

100 μL

MS conditions

MS system:

Xevo TQ-S

Ionization mode:

ESI positive

Capillary voltage:

3.0 kV

Cone voltage:

90.0 V

Source temp.:

150 °C

Desolvation temp.:

550 °C

Desolvation gas:

1100 L/hr

Cone gas:

50 L/hr

Table 1. MRM transitions for all pesticides.

Results and Discussion

Sample preparation

The monitoring of pesticide residues in drinking water is a vital necessity for every nation worldwide. Access to clean and drinking water quality is the EPA primary focus in United State and began with the Safe Drinking Water Act in 1974. Pesticides analysis in drinking water sample is a time and laborious process, with the bulk of the work consumed by lengthy sample preparation protocols. In most instances, due to low detection requirement (sub ppb levels), high enrichment extraction protocol must be used to bring target pesticides concentration level in a sample up to detection level compatible with current separation and detection techniques. As such, most extraction methods will incorporate up to 1000:1 enrichment factor to add up to 1000-fold sensitivity increase for quantification. In practical terms, large volumes of a raw sample must be concentrated to an extreme low volume; the most popular method will utilize a 1000 mL starting sample volume to a final extract of 1 mL, thus providing the necessary 1000:1 enrichment factor. Several extraction methods can be used, liquid-liquid and solid-phase extraction are amongst the most utilized for this type of application. Regarding SPE, this technique offers a wider performance than liquid-liquid extraction; in most applications SPE is the favoured method but not without difficulties. With SPE, once a sorbent bed is conditioned, a target volume of water sample will be loaded to ensure total and maximum contact with solid particles for extraction of target analyte. This step is crucial and requires a minimum flow rate per bed mass. With regards to high enrichment extraction, SPE bed mass in the  50 mg and higher range are the most common  and avoids breakthrough effects due to saturation with smaller bed size. With the SPE barrel format, coarse filters are used for the top and bottom to ensure that the bed density remains compact. With those facts in mind, the loading flow rate is usually set between 5 to 10 mL/min and can be set with proper valve setting on a vacuum manifold. For a typical 1000 mL drinking water sample loaded at  10 mL/min, it will take roughly two hours for the entire sample to interact with the sorbent bed. 

However, if the water sample contains high level of organic matter (Total Organic Content or TOC), the top filter fritz will collect all particulate in the sample and will cause a restriction effect over time, meaning that the loading flow rate will drop at a lower value. With increasing level of TOC’s, the first 100 mL of the sample is usually loaded at optimum flow rate but will rapidly drop to extreme low values and increases the loading time. For example, a tap water sample can take up to 8 hours of loading time, and up to 15 hours for a surface water sample. With a typical lengthy extraction process associated with high enrichment protocol, it inevitably led to the creation of multi-residue applications. 

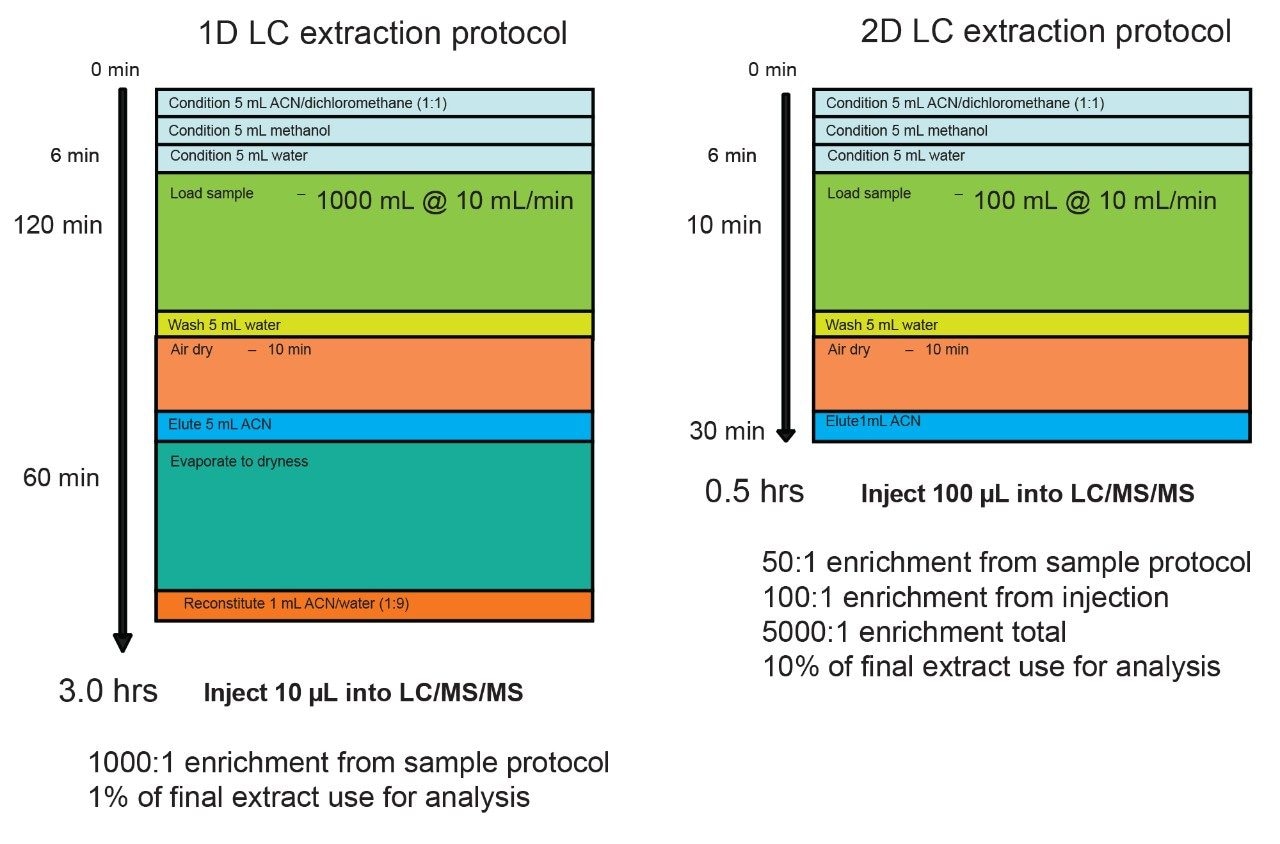
This type of enrichment protocol is linked to the limitation of single dimensional separation technique. The low volume injection restriction (10 µL) is a necessity to avoid volume or mass overload during the injection sequence when combined with a single dimension chromatography platform. Recent development in multi-dimensional chromatography offers the option to create customizable configurations for a specific workflow, thus leading to the possibility to create novel extraction protocols. The 2D LC with At-column dilution configuration offers the option of large volume injection without the distorted peak shape effect due to volume overload. This particular configuration also offers the particularity to inject aqueous and organic solvent extracts at any percentage. Previous works describes the technique in detail. Ultimately, a water extraction protocol using a 2D LC-MS/MS platform is completed in minutes instead of hours. Since a large volume can be injected (up to 1000 µL) on column, the loading sample volume during the extraction process can also be reduced to strict minimum. For example, using a 20 mL sample volume with a final elution at 2 mL can lead to a 500 uL injection of a 100% organic extract, thus producing the same 1000:1 enrichment (See Figure 1). The added benefit is the 2 mL loading time and the elimination of the dry down step, in most application the evaporation with nitrogen stream is simply eliminated from the protocol. If higher enrichment is required, up to 200 mL of sample can be use and while maintaining the total extraction time below 30 minutes. 

Figure 1. 1D LC protocol vs 2D LC protocol.

Separation and Detection

The application started by the selection of several pesticides classified in groups according to their chemical and physical properties. Close to 90 pesticide, spread over common classes (Organophosphorus, carbamates, triazines,   phenyl ureas, triazoles, and organochlorine, etc.) were dissolved into stock solutions (1 mg/mL) and infused for MRM identification (1 µg/mL). The following step focused on the optimization of each pesticide according to a 2D LC 6 × 6 elution schemes with both aqueous and organic extracts (See Table 1). From those results, comes the task to identify which methods will yield a Gaussian peak shape for quantitation. The process starts by identifying which conditions will give a signal versus no signal. In Figure 2, all 36 methods for one target analyte are displayed according to their method number and the corresponding results. For this application, a red box signifies an absence of signal, either due to breakthrough effect during loading or poor solubility during elution. For those conditions giving a quantifiable option, a green box will signify a Gaussian peak shape. Any peak distortion such as, leading, tailing, broad, split and raise baseline (RB) will be flag by a yellow box. Therefore, with Azinphos-methyl as an example, one method gave a red flag for water extract only, three methods gave a yellow flag and 33 methods produce a quantifiable peak shape. This means that this molecule will produce a good signal for a wide range of conditions. When the application requires a broader range of analytes, it is at that point that a keen understanding of the chemical and physical diversity will have a major impact of the final method selection. As an example, in Figure 3, one target analyte from six different classes of pesticides are selected across nine methods, it becomes clears that as the number of target analytes increase for a multi-residue analysis, it will be difficult to select one multi-residue separation conditions and will therefore favour a multi-method approach. Once of the results are tabulated, the task focused on the method selection. In Figure 4, all results producing a Gaussian peak shape with highest intensities are highlighted with a green box for a full score. 

Figure 2. 6 × 6 grid results for azinphos-methyl. 
Figure 3. 6 × 6 grid results for one target analyte from each selected class of pesticide.
Figure 4. MRM transition for organophosphorous pesticides.

The blue box gives the option to select conditions to widen the selection choice. The column on the right side tabulates how many pesticides in total and creates a final score for each method. By combining the final scores for each group (see Figure 5), it becomes apparent that one single method will not be sufficient and opting for a multi-methods approach will yield a higher coverage.

Figure 5. Cumulative 6 × 6 hit for all selected class of pesticides. 

Single stage captive extraction

Once the LC and MS optimization phase were completed, the next step focused on the sample cleanup and enrichment of the application. In this instance, since the target matrix is very low on the complexity scale (class A matrix), the extraction protocol will require a low to a mild cleanup methodology.

In this application, the first extraction technique we evaluated was the captive extraction approach. The technique, as the name states, utilizes a sorbent that will capture target analytes during the loading phase. The sorbent could be any type of reversed-phase, HILIC, ion-exchange or affinity sorbent as the main retention mechanism. For this work, we opted for a reversed-phase sorbent. The next phase of the extraction process targets the removal interferences while keeping the target analyte safely bound to the sorbent, thus avoiding a breakthrough effect and potential low recovery values for the target analyte. In order to isolate a target analyte from a high complex sample, understanding its retention profile on a given sorbent can lead to utilize various elution parameters (i.e., pH, polarity, solubility, etc.) to create a narrow elution profile for the target analyte and with the least amount of co-eluting interference. Since the introduction of polymer base extraction sorbent with a wide pH range than widely use silica-ligand sorbent, the pH extension capability will lead to a 3D elution profile with solubility and pH (See Figure 6). The result, in Figure 7, shows a single pesticide of the organophosphorus class with acetonitrile and methanol as elution solvent with a high pH (ammonium hydroxide) and low pH (formic acid) variant. With  the acetonitrile or methanol elution, dichlorvos does not show any typical basic moieties (ex: secondary amine) or acidic moieties  (ex: carboxylic acid). For example, if the target analyte behaves as a basic entity, at high pH elution, it will take higher percentage  of organic solvent for a complete elution with the molecule in neutral state. At low pH, with the molecule in ionized form, it is expected to have a complete elution at lower percentage value. In this instance, dichlorvos with acetonitrile seems to follow the profile of a basic entity. The results for methanol should follow the same trend but at different elution percentage (higher or lower), thus factoring in the solubility of dichlorvos in acetonitrile versus methanol. However, for methanol the high pH vs. low pH elution is not showcasing the expected separation profile, rather poor recovery at high pH and a wider distribution and at higher percentage.

Figure 6. Single stage 2D extraction protocol.
Figure 7. Single stage 2D extraction protocol results for dichlorovos and diazinon.

As for the second target analyte, the elution profile of dimethoate shows a typical basic functionality but at higher elution percentage, and the same with methanol. Clearly, this experiment indicates the behavior of both target analytes, dichlorvos is an early eluter and dimethoate is a late eluter. From an extraction point of view, if a multi residue application with a single isolation method, the gap between the wash and elution steps will most likely be very wide thus resulting in poor performance. The HLB 2D results for all pesticides in this study are listed in Table 2 to 7. From those results, an extraction strategy was selected for each class  of pesticides listed in Table 8 and a drinking water extract 100:1 enrichment at 100 ppt for triazines by 2D LC/ToF is shown in Figure 8.

Table 2. 6 x 6 grid results for organophosphorus.
Table 3. 6 x 6 grid results for carbamates.
Table 4. 6 x 6 grid results for phenyl ureas.
Table 5. 6 x 6 grid results for triazoles.
Table 6. 6 x 6 grid results for other pesticides.
Table 7. 6 x 6 grid results for triazines.
Table 8. Extraction conditions for single extraction protocol for each classes of pesticides.
Table 8A. Organophosphorus.
Table 8B. Carbamates.
Table 8C. Triazines.
Table 8D. Triazoles
Table 8E. Phenyl urea.
Table 8F. Others.
Figure 8. 2D LC-ToF chromatogram for triazines mix using single stage 2D extraction protocol.

Triple stage captive extraction

By taking in consideration the high level of chemical and physical diversity for the entire listing of pesticides in this application, it  becomes clear that finding a simple extraction method for a screening will be difficult. Also, by adding matrix complexity, the shear amount of potential interferences can overwhelm any well optimized extraction protocol. It becomes clear that manipulating elution strength and/or pH is not sufficient. As seen in Figure 9, the workflow shifted toward dual mixed mode to create multiple fractions from a single loading step as opposed to multiple loading, washing, and eluting steps with the HLB 2D protocol. 

Figure 9. Triple stage extraction protocol.

The latter protocol is best suited for smaller subset of target analyte. With the dual mixed-mode approach, the rationale behind this protocol is to use three trapping mechanisms during loading phase. By combining a cation exchanger, an anion exchanger and a reversed phase, the prospect of breakthrough during the loading phase is drastically reduced, and also provides the benefit of creating corresponding fractions based on a target analyte’s physical and chemical property. In Figure 10, the fractionation result for OP’s and carbamates show that some analytes are behaving as expected, in this instance, as neutral functionality during the initial loading phase on MAX.  

Figure 10. Triple stage extraction protocol results for organophosphorous and carbamates pesticides.

The MAX E1 refers to the elution of the reversed-phase portion of the mixed-mode sorbent, while MAX E2 captures the acidics. With the cation exchanger following the anion exchanger, any signal on MCX fractions clearly indicates that a target analyte has a strong affinity only for a cation exchange mechanism. In this application, with the OPs and carbamate pesticides showcasing distinct core structures, 13 pesticides gave high recoveries (>75%) with the reversed-phase portion of MAX which confirms a neutral behavior for a big majority. Some pesticides showed an unexpected behavior with lower recoveries on the reversed-phase (>75%), and the remainder captured by anion-exchange, thus suggesting a Zwitter behavior for 7 pesticides. Two analytes from the same group showed a strong acidic behavior with 80% recovery on the anion exchanger and show retention on the reversed phase of MCX, suggesting partial breakthrough on MAX. The loading pH could be a factor as bed mass is too low for those two analytes. One surprising result was for one analyte showing a 65% recovery on the reversed-phase portion of MCX and only 21% on MAX. This behavior strongly supports that the bed mass is too low for a single first stage loading, but quite efficient when in dual mode. The other classes of pesticides are listed in Figure 11 with similar results and behaviors. As a comparison with the captive extraction protocol and with the same enrichment process, Figure 12 shows a chromatogram for triazines using the MAX E1 at 100 ppt in drinking water. The atrazine trace shows a cleaner background with the dual mixed mode than with the HLB 2D workflow. Also, the signal intensities for all analytes are in the same range for both extraction protocols, which suggests that both workflows are very effective for a screening application. 

Figure 11. Triple stage extraction protocol results for triazines, triazole, phenyl ureas, and other pesticides.
Figure 12. 2D LC-ToF chromatogram for triazines mix using triple stage extraction protocol.
Table 9A. Triazines.
Table 9B. Organophosphorus.
Table 9C. Carbamate.
Table 9D. Triazole.
Table 9E. Phenyl urea.
Table 9F. Others.

Conclusion

This application demonstrated the effectiveness of two extraction process, single stage captive and triple stage captive for pesticides screening by 2D LC ToF in drinking water. The 100:1 enrichment process was completed in less than 30 minutes with a direct injection of the final extract without any need for solvent exchange (evaporation to dryness with reconstitution). With a 100 mL of sample to a final 1 mL with 100 uL injection, the final extract for both extraction protocols produced an intense and quantifiable signal.

References

  1. Mella, M., Schweitzer, B., Mallet, C.R., Moore, T., Botch-Jones, S., J. Anal. Toxicology, 265–275, 2018.
  2. Mallet, C.R., Botch-Jones, S., J. Anal. Toxicology, 1–11, 2016.
  3. Mallet, C.R, Multi-dimensional Chromatography Compendium: Trap and Elute vs. At-column dilution, 720005339EN 2015.
  4. Mallet, C.R., Analysis of Pharmaceuticals and Pesticides in Bottled, Tap and Surface Water Using the ACQUITY UPLC with 2D Technology, Waters Corporation, 720005167EN 2014.

720006588, May 2019

トップに戻る トップに戻る