• アプリケーションノート

Ion Mobility-Enabled Metabolite Identification of Tienilic Acid and Tienilic Acid Isomer Using Mass-MetaSite and WebMetabase

Ion Mobility-Enabled Metabolite Identification of Tienilic Acid and Tienilic Acid Isomer Using Mass-MetaSite and WebMetabase

  • Lauren Mullin
  • Giorgis Isaac
  • Ian D. Wilson
  • Adam King
  • Nathan Anderson
  • Russell J. Mortishire-Smith
  • Robert S. Plumb
  • Waters Corporation
  • Division of Computational and Systems Medicine, Department of Surgery and Cancer, Imperial College, London UK

Abstract

The aim of this application note is to demonstrate the use of HDMSE and Mass-MetaSite/WebMetabase processing for rapid identification of TA and TAI, and related metabolites, in rat urine samples collected at three time points post-administration of these drugs. Focus is given to the workflow steps involved with data transfer, processing, and review. Data was acquired on the Vion IMS QTof Mass Spectrometer, which uses travelling-wave IMS (TW-IMS), where ion mobility is determined using a high electric field moving through the IM cell segments. These values provide another data point for metabolite characterization. Processing and interpretation of this data set using Mass-MetaSite/WebMetabase occurred months after the initial acquisition and was made possible due to the DIA approach utilized, highlighting the use of historical data review with the availability of new platforms/platform compatibility.

Benefits

  • Demonstration of drift-aligned accurate mass precursor and fragment ion spectra for profiling of tienilic acid and tienilic acid isomer and their metabolites
  • Coupling of Mass-MetaSite and WebMetabase with Waters Vion IMS QTof UNIFI data for batch processing of dual compound metabolic profiles
  • Integration of unique ion mobility-derived collision-cross section measurements automatically with third-party software Mass-MetaSite and WebMetabase
  • Historical data review of ion mobility data-independent acquisition analysis

Introduction

Tienilic acid (TA) is a uricosuric diuretic, removed from the market in 1980 due to hepatotoxicity in patients.1 Though direct hepatotoxicity was not observed during pre-clinical studies prior to the market approval of TA, immune-mediated mechanism of toxicity1,2 was reported in wider population use. Early batches of TA contained small amounts of a 3-thenoyl regioisomer, 2,3-dichloro-4-(thiophene-3-carbonyl)phenoxyacetic acid (TAI), which in safety assessment studies was found to exhibit direct hepatotoxic effects.1,2 Characterization of TA and TAI metabolism has been a critical step in understanding these differential toxicity mechanisms, pursued through numerous studies using cell culture techniques, 1H NMR spectroscopy, and mass spectrometry (MS).1-5

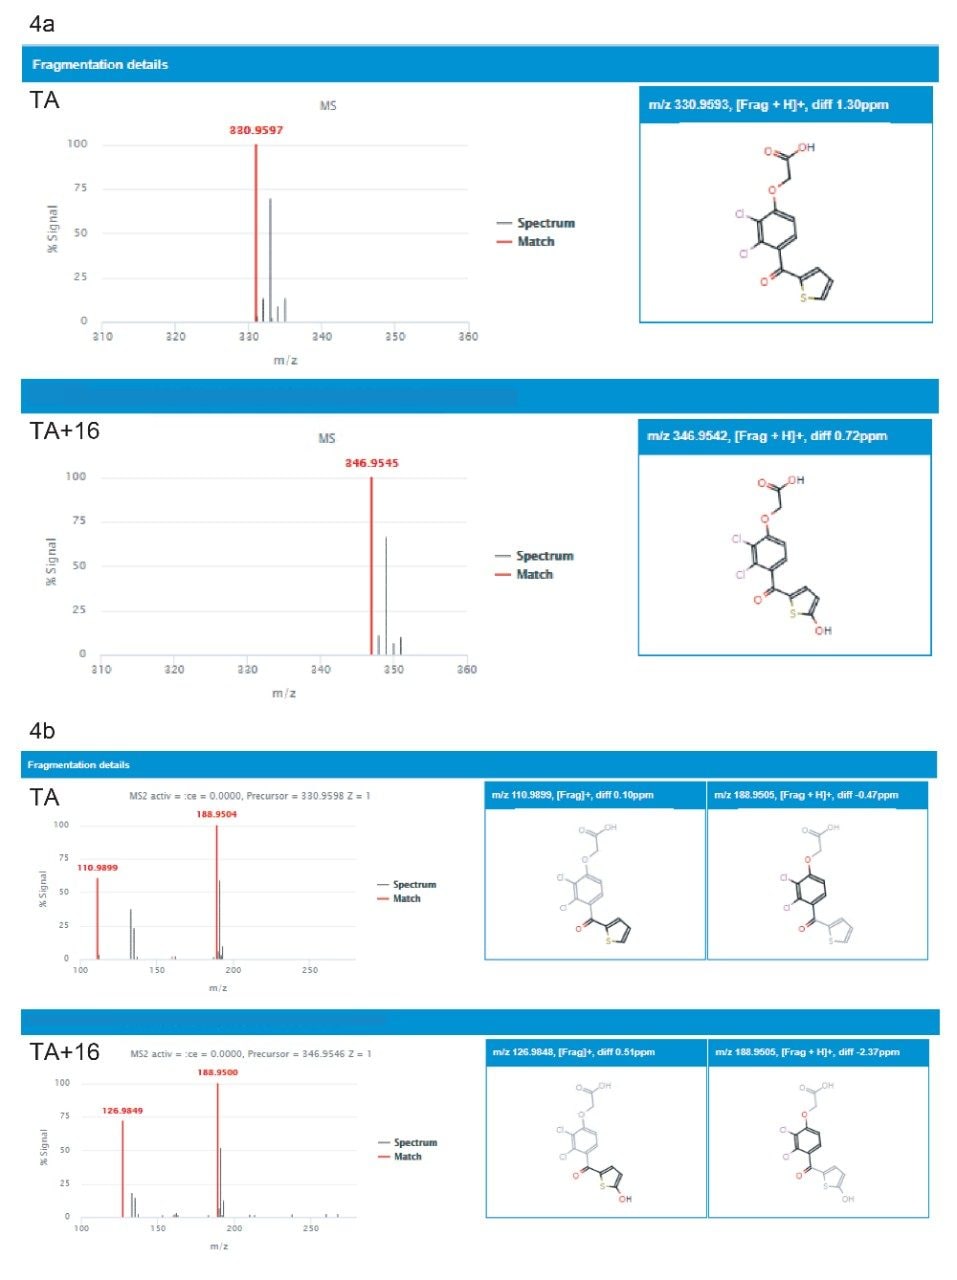
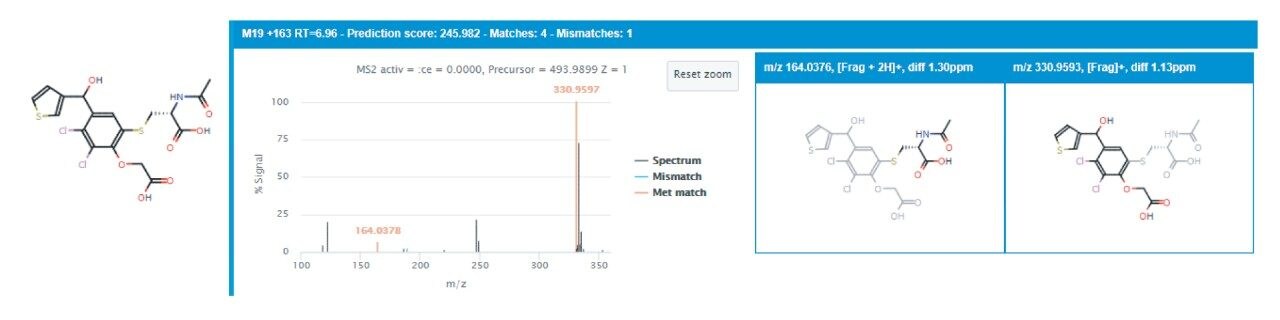
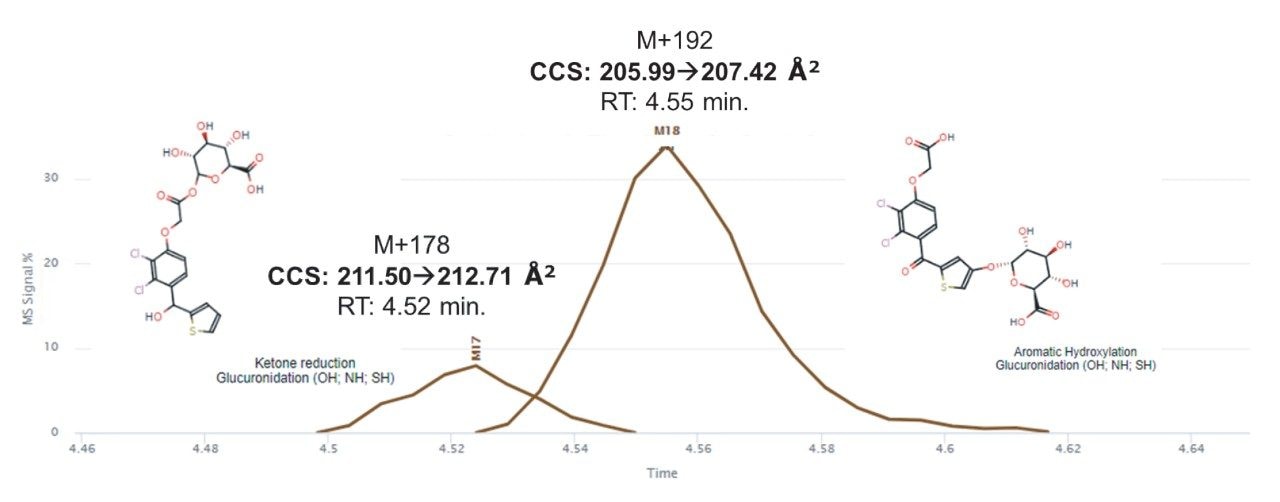
High resolution mass spectrometry (HRMS) provides a powerful tool for metabolite identification7 and was employed to further investigate the metabolism of TA and TAI. This study used quadrupole time-of-flight (QTof) MS to generate accurate mass measurements of both the precursor and fragment ions. Fragmentation is generated via collision-induced dissociation (CID) during an elevated collision energy that is applied on a timed frequency within the narrow peak width generated by UPLC chromatography. MSE is a data independent acquisition (DIA) approach that enables the collection of high and low collision energy data, simplifying structure elucidation by enabling the review of common fragment ions, neutral loss, precursor, and fragment ion scanning. The introduction of ion mobility spectrometry (IMS) between the LC and the MS step provides an additional means of analytical specificity via the gas-phase separation of ions as they pass through the ion mobility cell. IMS records the drift time (DT, measured in ms) of a molecule, which can be converted to a collision-cross section (CCS, measured in Å2) value via a calibration process, a robust and unique physical property related to an ion’s size, conformational shape, and charge distribution.8 Alignment of DT with measured m/z of product and fragment ions is also used as a filtering mechanism to resolve chromatographically co-eluting spectra if they do not share the same drift time as the mass of interest, improving spectral clarity for confident compound structural elucidation and identification. This type of acquisition mode, which combines IMS with MSE, is referred to as high-definition MSE (HDMSE).

In addition to providing comprehensive structural information, both MSE and HDMSE afford the ability to perform historical data review months or years after initial acquisition and processing, should additional analytes of interest come to light.

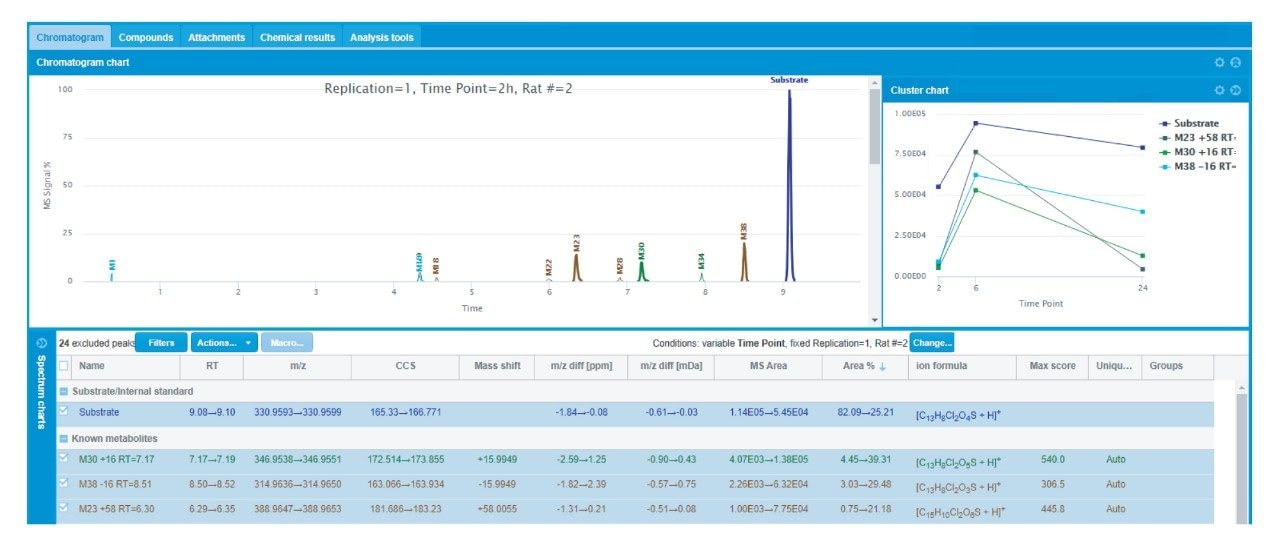
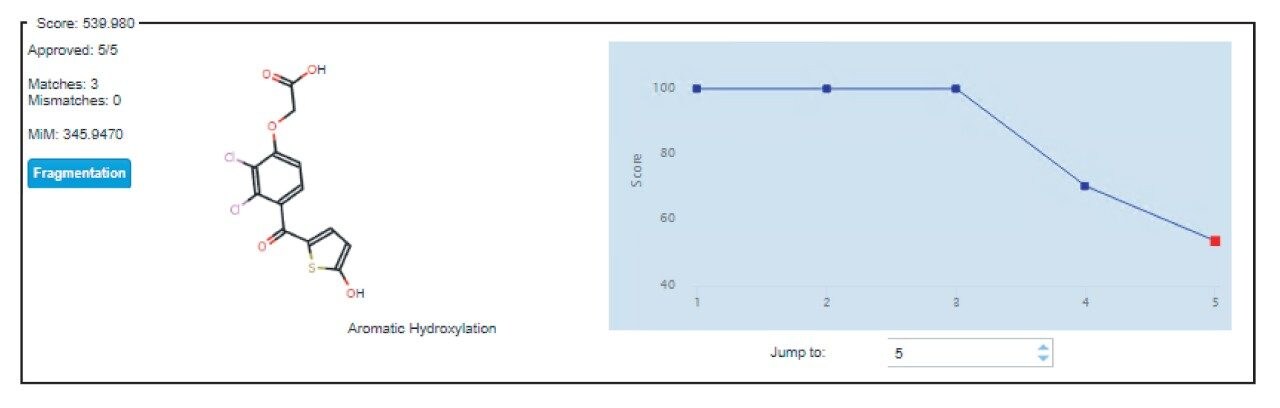
Interpretation of this highly rich HDMSE data requires a software package equipped to deconvolute spectra, integrate IMS results, and propose likely metabolites and their respective structures. Mass-MetaSite and WebMetabase (Molecular Discovery, Ltd., Borehamwood, Hertfordshire, U.K.) software packages perform vendor-neutral metabolite identification in the context of drug discovery requirements. Features include, but are not limited to, batch processing of multiple substrates, full Markush representations of metabolites, and cloud-based results storage. Specific integration of CCS values and drift-aligned spectra have been made possible through a collaboration between Waters and Molecular Discovery,9 resulting in a comprehensive data review experience.

The aim of this application note is to demonstrate the use of HDMSE and Mass-MetaSite/WebMetabase processing for rapid identification of TA and TAI, and related metabolites, in rat urine samples collected at three time points post-administration of these drugs. Focus is given to the workflow steps involved with data transfer, processing, and review. Data was acquired on the Vion IMS QTof Mass Spectrometer, which uses travelling-wave IMS (TW-IMS), where ion mobility is determined using a high electric field moving through the IM cell segments. These values provide another data point for metabolite characterization. Processing and interpretation of this data set using Mass-MetaSite/WebMetabase occurred months after the initial acquisition and was made possible due to the DIA approach utilized, highlighting the use of historical data review with the availability of new platforms/platform compatibility.

Experimental

Sample description

Male Sprague-Dawley rats were dosed intravenously with 250 mg/kg of TA or TAI. Urine was collected at 2, 6, and 24 hours post-dose. Blank vehicle-dosed rat urine was also collected. The samples were diluted 9:1 (v/v) with LC-MS grade water prior to LC-MS analysis. Additional sample information can be found in [2] and [6]. Samples were injected in randomized triplicates for each time point across replicate subjects.

Method Conditions

LC conditions

LC system:

ACQUITY UPLC I-Class PLUS

Column:

ACQUITY UPLC HSS T3 1.8 μm, 2.1 × 100 mm

Temp:

30 °C

Sample temp.:

10 °C

Injection volume:

2 μL

Mobile phase A:

0.1% formic acid in water

Mobile phase B:

0.1% formic acid in acetonitrile

Gradient:

HDMSE conditions

Instrument:

Vion IMS QTof

Ionization mode:

ESI+

Collision energy (LE):

6 eV

Collision energy (HE ramp):

35–55 eV

Scan time:

0.10 sec

Acquisition range:

50–1200 m/z

Drift gas:

N2

IMS wave velocity:

250 m/s

IMS wave height (ramp):

20–55 V

Capillary:

1.0 kV

Source temp.:

120 °C

Desolvation temp.:

500 °C

Cone gas flow:

50 L/hr

Desolvation gas flow:

800 L/hr

Lock mass:

Leucine enkephalin (556.2766 m/z)

Data management

UNIFI v1.9.4, Mass-Metasite, and WebMetaBase v4.0.1

Mass-Metasite and WebMetabase standard mode (small molecule) processing parameters

General data:

Two Energies of Collision (TEC) mode enabled

Metabolites generation, reactions monitored:

Hepatocytes default

Mass, MS peaks, isotopes, pattern filtering, and tolerance (%):

20

Mass, MetId, and metabolite generations:

2

Mass, MetId, Compound fragmenting, substrate bond breaking limit:

4

Mass, MetId, compound fragmenting, break metabolites:

True, 1

Mass, TEC, mass spectrometer:

Waters Q-TOF

Mass, TEC, algorithms thresholds:

Chromatogram/MS/MSMS: 0.95/0.90/0.99

Mass, TEC, signal threshold:

Automatic

External LC-MS file converter:

Version 2.1.9 UNIFI msvc64

Results and Discussion

The LC-HRMS data for TA and TAI dose samples was acquired on the Vion IMS QTof Mass Spectrometer; the resulting data was processed using the Mass-MetaSite (MMS) batch processor and uploaded directly to WebMetabase (WMB) for data review. Figure 1 summarizes the experimental workflow employed. Connection to MMS and WMB, as well as other third-party software from UNIFI, is enabled through the External Application managers, readily-accessed within the Administrator tab. This feature within UNIFI provides enhanced flexibility of Vion-acquired data processing, as well as the transfer of CCS values (calculated automatically by UNIFI) for all proposed metabolites to be transferred into MMS and WMB. Furthermore, for the purposes of this data set, interest in comparison of the metabolic profiles of TA and TAI required the use of batch processing, which allows importing and metabolite pathway processing for more than one drug molecule. Batch processing was achieved here via the input of both TA and TAI structural files (Figure 1). Relevant time-course UNIFI data files for each treatment group were selected to be processed and generated a unique result summary (experiment) for each compound concurrently, thus facilitating metabolite generation comparison. These experiments are accessed for interrogation within the WMB server.

Figure 1. Workflow of experimental protocol from dosing to LC-HRMS-IMS acquisition and data processing.

Investigation of TA and TAI metabolism was first initiated in WMB under the “Chromatogram” view of the saved experiment, illustrated in Figure 2. The combined chromatogram chart shows a summary of the extracted ion chromatograms (XICs) of the major metabolite masses for the two-hour time point for TA dosed Rat #2. In the case of this data set, this view can be easily switched to show triplicate injections across a given time point, a single replicate series across all time points, and, in either scenario, the results from different subjects (Rat #1 and Rat #2). Color coding of the labelled XICs indicates the status of an identification, where the substrate is coded in royal blue, single-step metabolites are in green, and multi-step metabolites are in brown. Also shown are unknown metabolites, or masses that do not correspond to a selected metabolic form specified in the processing method. Presented for initial review is the table of each metabolite illustrated in the chromatogram chart with its relevant detection information across the sample set, such as retention time, m/z, mass shift from substrate, mass error, MS signal area and total % area, formula, and the ion mobility-specific CCS measurement (Figure 2). Finally, the cluster chart (also shown in Figure 2) highlights the relative intensity of TA and its major metabolites across the three time points for Rat #2.

Figure 2. Initial overview of processed data in WMB under “Chromatogram” tab for TA experiment file. Range of experimental values for RT, m/z, CCS, m/z diff, MS Area, and Area % is displayed.

One common high-level metabolite observed in rat urine under both TA and TAI administration was hydroxylation (M+16), as shown in Figure 3, and described in previous studies of the rat/rat liver microsomes.4,5 A positional score for the site of metabolism is provided for multiple permutations of the metabolism location, based on the steric likelihood of transformation occurring at the given part of the molecule (Figure 3). Further confirmation of metabolite identity was provided by the supporting spectral data, accessed by selecting “fragmentation” next to the metabolite’s full Markush representation.

Figure 3. Structural representation of TA+OH. Where multiple positions of hydroxylation are possible, a score applied to each can be visualized by selecting the numbered square in the plot. In the case of O-dealkylation and acetylation, only one location is possible and thus a single proposed structure is generated.

Here, both precursor (MS) and fragment ion (MS2) spectrum can be viewed, as shown for M+16 for TA in Figures 4a and 4b, respectively. All precursor spectra shown for a given substrate or metabolite is drift-aligned, meaning any additional ions that share the same RT, but different DT, will be removed from view by the software. Since the collision cell is positioned after the IM drift cell, the same is also true for product/fragment ion spectra. The result is a highly specific and “clean” spectrum, which increases the confidence in structural elucidation and identification. Both TA and the TA+O (M+16) precursor ions are shown in Figure 4a and the corresponding high energy spectrum in Figure 4b. In the high energy spectrum, the localization of the hydroxy group is apparent by the mass shift of +16 Da of the thiophene group fragment ion.

Figure 4a. Precursor spectrum for TA (top) and hydroxylation (TA+16) (bottom), showing the mass difference of the [M+H]+ in the molecule header description. Figure 4b. Fragment ion spectrum for TA (top) and M+16 (bottom), showing the mass difference of the [M+H]+ in the molecule header description of each product ion (fragment).

Further exploration using the tools and approach described above resulted in the identification of conjugation metabolites, specifically hydroxylation and glucuronidation (M+192) and ketone reduction and glucuronidation (M+178) in TA administered samples only. Also unique to the TA administered samples was a hydroxylation and acetylation metabolite (M+58), a relatively unusual form of metabolism, which was supported by the presence of a fragment ion comprised of the thiophene group and hydroxy-acetyl group at m/z 168.9954. TAI administration, conversely, produced a unique metabolite resulting from reduction and an N-acetyl cysteine conjugation (M+163), present in both rat subjects across each respective triplicate injection series at the six-hour collection point. This TAI metabolite has also been described by Grant (2016).5 Figure 5 shows the fragment ion spectrum supporting this identification.

Figure 5. TAI metabolite (reduction and n-acetyl cysteine conjugation) fragment ion spectrum with proposed product ion structures.

One particularly useful benefit of IMS and resulting CCS values in this data set was the gas-phase differentiation of the two glucuronide related metabolites seen after TA administration. Though differentiated by m/z, the hydroxylation and glucuronidation metabolite (M+192, m/z 522.9863) and ketone reduction and glucuronidation metabolite (M+178, m/z 509.0070) eluted closely, with RTs of 4.54–4.56 and 4.51–4.52 minutes, respectively, an average percentage difference of 0.66%. The CCS values of these two metabolites are 205.99–207.419 and 211.50–212.71 Å2, respectively, exhibiting a much larger average percentage difference of 2.58%. Additionally, the ion mobility drift order is the opposite of the chromatographic elution order (i.e., the CCS value of M+178 is larger than that of M+192, whereas M+178 has an earlier RT than M+192). This implies that the hydroxylation and glucuronidation metabolite is more structurally compact despite its larger mass and therefore travels through the drift cell faster. Figure 6 illustrates the chromatographic separation and corresponding CCS values of the two glucuronide-type metabolites. Since the mobility separation occurs after chromatography and ionization, these values stay consistent regardless of changes in chromatographic methods and conditions.8, 10, 11 Aside from ion mobility exhibiting a chromatography-independent separation, this separation is particularly useful where future analyses may encounter shifts in the RT. These shifts can be based on differences in mobile phase composition or column aging, or even implement different chromatographic gradients/stationary phases. In these cases, use of m/z will of course differentiate the peaks, but the additional parameter of RT may not. In addition, there is the possibility of complete co-elution of these two peaks when different separation conditions are used. Here, the use of CCS would be a consistent parameter that can also be used for metabolite confirmation where RT was no longer applicable.

Figure 6. TA glucuronide metabolites elute closely, and though differentiated by mass also gain further differentiation through ion mobility separation, as demonstrated by distinctive CCS values.

Conclusion

The use of HRMS in metabolite identification studies provides valuable structural information for compound structural elucidation and identification. Advanced processing tools are required to facilitate the interpretation of this comprehensive data, such as UNIFI Scientific Information System (Waters) or Mass-MetaSite (MMS) and WebMetabase (WMB) from Molecular Discovery. Here, we have demonstrated the coupling of HRMS with an additional, ion mobility-based, gas-phase separation for the determination of metabolic profiles of tienilic acid (TA) and its 3-thiophene isomer. Determination of common and differential metabolites for both compounds in a single processing step was made possible through the coupling of the Vion IMS QTof UNIFI data with MMS and WMB. Additionally, the advantages of IMS were realized through the ability of MMS and WMB to show driftaligned spectra and CCS values when interpreting data. In the case of two glucuronide metabolites of TA, CCS provided an additional separation parameter for these closely eluting compounds.

Acknowledgements

The authors wish to thank Elisabeth Ortega-Carrasco, Fabien Fontaine, and Isma Zamora Rico of Molecular Discovery, Ltd. for continued discussion and technical support. They also wish to kindly thank Muireann Coen for TA/TAI-treated rat urine samples, and Mark Wrona of Waters Corporation for discussion.

References

  1. Bonierbale, E. et al. “Opposite Behaviors of Reactive Metabolites of Tienilic Acid and its Isomer Toward Liver Proteins: Use of Specific Anti-Tienilic Acid − Protein Adduct Antibodies and the Possible Relationship with Different Hepatotoxic Effects of the Two Compounds.” Chemical Research in Toxicology, 1999, 12.3: 286–296.
  2. Coen, M. et al. “Comparative NMR-Based Metabonomic Investigation of the Metabolic Phenotype Associated with Tienilic Acid and Tienilic Acid Isomer.” Chemical Research in Toxicology, 2012, 25.11: 2412–2422.
  3. Rademacher, P.M. “Tienilic Acid and its Positional Isomer: A Comparison of the Metabolism and Toxicity of a Presumed Immune-mediated and Intrinsic Hepatotoxin.” University of Washington, 2011.
  4. Dansette P.M. et al. “Oxidative Activation of the Thiophene Ring by Hepatic Enzymes: Hydroxylation and Formation of Electrophilic Metabolites During Metabolism of Tienilic Acid and its Isomer by Rat Liver Microsomes.” Biochem. Pharmacol, 1990, 39.5: 911–918.5.
  5.  Grant, I.J. “A UPLC-MS Based Exploration of the Xenobiotic and Endogenous Metabolic Phenotypes of Pre-Clinical Models of Hepatotoxicity.” Imperial College London, 2016.
  6. King, A.M. et al. “Capillary Ultra-Performance Liquid Chromatography–Tandem Mass Spectrometry Analysis of Tienilic Acid Metabolites in Urine Following Intravenous Administration to the Rat.” Journal of Chromatography B, 2018, 1087: 142–148.
  7. Schadt, S. et al. “A Decade in the MIST: Learning from Investigation sof Drug Metabolites in Drug Development under the “Metabolites in Safety Testing” Regulatory Guidance.” Drug Metabolism and Disposition, 2018, 46: 865–878.
  8. Paglia, G. et al. “Ion mobility-derived collision cross section as an additional measure for lipid fingerprinting and identification.” Analytical Chemistry, 2014, 87.2: 1137–1144.
  9. Kirk, J. et al. “Using Mass-MetaSite and WebMetabase to Process HDMSE Data Acquired on the Vion IMS QTof Mass Spectrometer.” Waters Application Note, 720006362EN, 2018.
  10. Nye, L.C. et al. “A Comparison of Collision Cross Section Values Obtained via Travelling Wave Ion Mobility-Mass Spectrometry and Ultra High Performance Liquid Chromatography-Ion Mobility-Mass Spectrometry: Application to the Characterisation of Metabolites in Rat Urine.” Journal of Chromatography A,2019.
  11. Righetti, L. et al. “Ion Mobility-Derived Collision Cross Section Database: Application to Mycotoxin Analysis.” Analytica Chimica Acta, 2018, 1014: 50–57.

720006887, May 2020

トップに戻る トップに戻る