• 응용 자료

The Analysis of Polychlorinated Biphenyls (PCBS) by GC-High Resolution Mass Spectrometry Using the Micromass AutoSpec Ultima NT

The Analysis of Polychlorinated Biphenyls (PCBS) by GC-High Resolution Mass Spectrometry Using the Micromass AutoSpec Ultima NT

  • Keith Worrall
  • Anthony Newton
  • Ramesh Rao
  • Waters Corporation

For research use only. Not for use in diagnostic procedures.

Abstract

This application note demonstrates the analysis of polychlorinated biphenyls (PCBS) by GC-High Resolution Mass Spectrometry using the Micromass AutoSpec Ultima NT.

Introduction

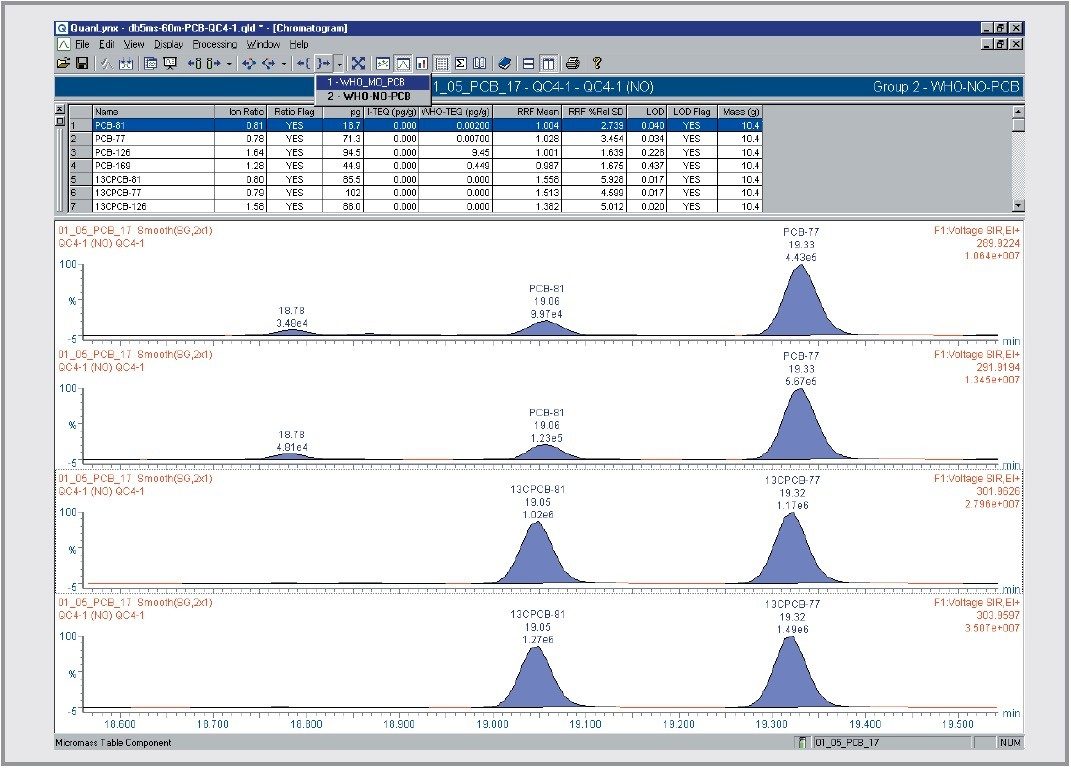
PCBs (polychlorinated biphenyls) are a class of man-made chemicals first manufactured commercially in the late 1920's and were used primarily as a dielectric fluid in electrical equipment. Subsequently, PCBs were used in many other products including hydraulic fluid, carbonless copy paper, plasticizers, pigments and vacuum systems. PCBs were useful due to their stability and resistance to thermal breakdown, and these very properties led to their persistence in the environment after use.

During the 1970's, the health risks associated with PCBs became a major consideration due to several well-publicized incidents. PCBs are now suspected to be a human carcinogen and are known to be an animal carcinogen. PCBs have also been shown to cause a number of serious non-cancer health effects in animals and potentially in humans, including effects on the immune system, reproductive system, nervous system, and endocrine system. Of additional concern is the fact that PCBs bio-accumulate in the food chain and are stored in the body fat of both animals and humans.

PCB contamination from historic uses and dumping is widespread throughout the world and disposal into waterways has caused PCB contamination of rivers, oceans, soils and even the polar ice cap. As a result, many forms of wildlife have become contaminated with PCBs. There have been bans on fishing in various locations. Regulatory authorities have implemented various advisory and compulsory maximum levels for PCBs in a variety of foodstuffs and in drinking water.

Delegates from 127 countries formally voted approval of the Stockholm Convention on Persistent Organic Pollutants on 22 May 2001, in Stockholm, Sweden.

This convention specifies twelve initial target compounds including PCBs, immediately prohibiting PCB (polychlorinated biphenyl) production and mandates a phase-out of ongoing uses over time. With a goal of completely phasing out PCBs by 2025, the treaty calls on countries to make determined efforts to remove from use all PCB containing electrical transformers and other equipment.

Regulatory Requirements

PCBs of particular toxicological concern have been identified by the World Health Organization, often described as the WHO-PCBs. Across the world there are many different methods (both legislative and non-legislative) for the analysis of PCBs (e.g. USEPA method 1668(a)).

In the UK and across much of Europe, there is no specific legislative method for the analysis of PCBs. For example UK-based laboratories use a variety of different extraction and clean-up methods, often employing the USEPA 1613 dioxin extraction and clean-up methods to isolate the PCBs from samples. Generally, gas chromatography (GC) coupled with high-resolution mass spectrometry (HRMS) is the preferred method for analysis, offering selectivity, sensitivity and certainty in results.

The analysis illustrated in this Application Note is intended to be an example of the applicability of the AutoSpec Ultima NT for the analysis of the WHO-PCBs, and could be as easily applied following any legislative method explicitly.

The general common factor in the various methods is the use of labelled internal standards for quantification and determination of recoveries, the use of resolution in excess of 10,000 resolving power (5% height, 10% valley definition) coupled with a 30m-60m GC column, either DB5(ms) type or SPB-octyl or similar.

Experimental

The instrument was tuned to in excess of 10,000 resolution at electron energy 30 eV, before calibration over the mass range for the experiment to be acquired. The experiment used was a three-function voltage selected ion recording (VSIR) acquisition system. The mass calibration is typically performed on a daily basis and by keeping a hardcopy record of the per-fluorokerosene (PFK) peaks during calibration, a permanent record of instrument resolution is maintained - essential for the level of auditing in a modern accredited laboratory. Instrument resolution is also automatically monitored and reported in a similar format to initial calibration after each sample run to keep a constant audit trail of instrument performance.

All data acquisition was controlled by MassLynx v4.0 Software, and data processing was performed using QuanLynx Application Manager.

GC Conditions

MS Conditions

Firstly, a single function survey injection was performed to allow determination of the acquisition time windows for the multi-function analysis.

A sample list was then set up to include a solvent blank injection of nonane, and a CS2 to CS6, five-point calibration using WHO-PCB standard sets.

After the calibration, more nonane solvent blank injections were made, before sample extract injections were performed.

The samples were spiked with labelled internal standards for each of the WHO-PCBs and 13C-PCB-138 was added as recovery standard.

For post-analysis processing, QuanLynx allows the use of more than one calibration curve and quantification method. In the case of these samples, following an EPA1613 type extraction and clean-up procedure, the mono-ortho (MO) PCBs were separated into one extract, and the non-ortho (NO) PCBs were separated into a second extract (which also contains all dioxins and furans (PCDD/F's) from the extracted sample. This required two injections, firstly of the MO-PCBs and secondly of the NO-PCBs. These two calibration curves can then be input into a single QuanLynx report file, ensuring that all sample results are easily traceable.

Two quantification methods were setup, one to monitor for the MO-PCBs and one to monitor for the NOPCBs, the congeners determined in each method are tabulated below:

The methods were used to produce a calibration curve, and limits of detection were calculated based upon the lowest standards signal-to-noise values for each congener.

Results and Discussion

Figure 1 shows a typical chromatogram for WHO-PCB analysis with the groups labelled.

Figure 1. Typical chromatograms for WHO-PCB analysis.

Figures 2 and 3 show the calibration curves for MO-PCB-156 and NO-PCB-17 illustrating the excellent quantitative linearity.

Figure 2. Calibration curve for MO-PCB-156.
Figure 3. Calibration curve for NO-PCB-17.

The calibration curve summary, with calculated LODs based upon a 10 g sample is presented in Table 1.

Table 1. Summary of quantitative results.

The results from the quantitative data processing are stored and displayed for ease of review in the QuanLynx Browser. Figure 4 and 5 show views of the QuanLynx Browser for the MO-PCBs and NO-PCBs respectively. The two calibration curves can be viewed in the same QuanLynx file, selecting between the two from a drop-down list (Figure 5).

Figure 4. QuanLynx Browser view for MO-PCBs.
Figure 5. QuanLynx Browser view for NO-PCBs.

Conclusion

High Resolution Gas Chromatography (HRGC) coupled with High Resolution Mass Spectrometry (HRMS) is the analytical technique of choice for analysis of PCBs - the Micromass AutoSpec Ultima NT is the market leader in this field.

The Micromass AutoSpec Ultima NT offers the ultimate sensitivity, quantitative linearity, reproducibility and stability necessary for regulatory PCB monitoring.

In addition, MassLynx v4.0 Software and the QuanLynx Application Manager give unprecedented automation, ease-of-use and data acquisition and processing functionality with numerous features dedicated to PCB analysis.

Featured Products

720000520, October 2002

맨 위로 돌아가기 맨 위로 돌아가기