• 응용 자료

SEC-MS Analysis of Aggregates in Protein Mixtures

SEC-MS Analysis of Aggregates in Protein Mixtures

  • Himanshu Gadgil
  • Da Ren
  • Paul D. Rainville
  • Bill Warren
  • Mark Baynham
  • Claude R. Mallet
  • Jeffrey R. Mazzeo
  • Reb Russell
  • Waters Corporation

Abstract

Size exclusion chromatography (SEC) coupled with mass spectrometry was used to study heat-induced aggregation in protein mixtures.

Introduction

Protein aggregation is a common problem associated with the protein products in the pharmaceutical and food industry. Protein aggregation is often accompanied by the loss of activity of the product and in the instance of therapeutic products can induce a toxic reaction. Protein aggregation can be triggered by heat, by certain chemicals used in the processing or may occur spontaneously during storage. Size exclusion chromatography (SEC) is widely used for molecular weight estimations of proteins in their native state.1 SEC has found applications in the studies on protein purity, protein-protein interactions and protein aggregation.2

Recent advances in Electrospray ionization (ESI) technique and mass spectrometry (MS) have revolutionized the field of biochemistry. ESI-MS can easily be coupled to liquid chromatography (LC) and provides an additional analytical tool for the analysis of biomolecules. The accurate molecular weight obtained by MS analysis can be used for protein identification, purity determination and for the analysis of structural isoforms in proteins.

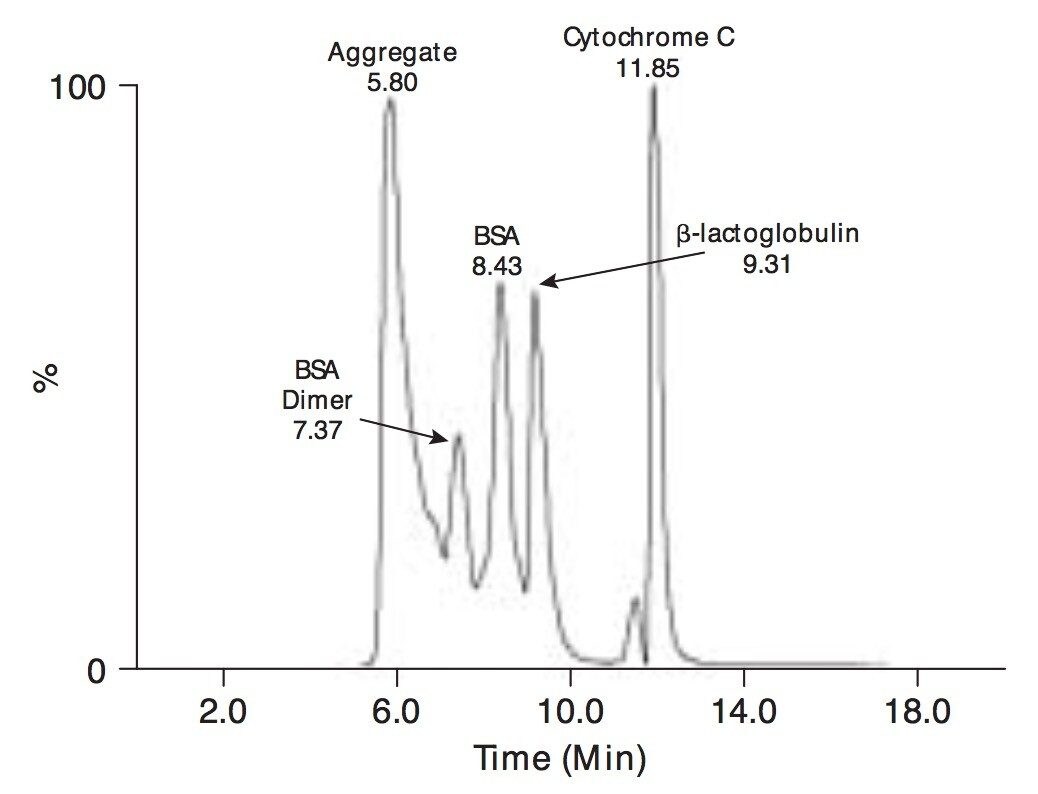
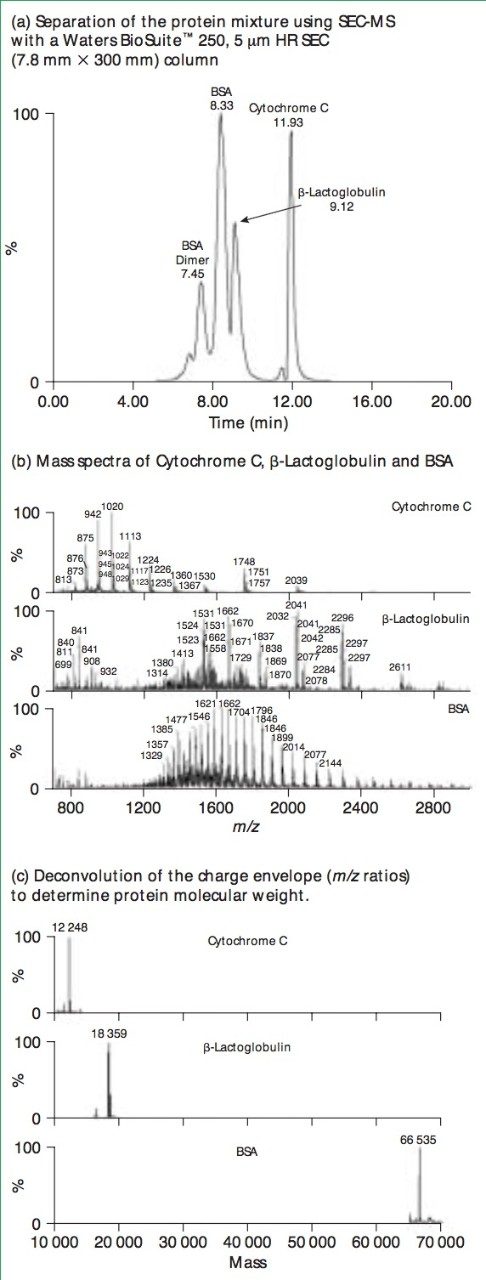
Traditionally a high salt mobile phase is used for the SEC separations and hence SEC is incompatible with ESI-MS. We have recently developed a novel method which uses MS compatible mobile phase consisting of 50 mM ammonium formate which allows the coupling of SEC to MS.3 SEC-UV/MS can be used for quantitative analysis of protein aggregate as well as to identify individual components in the aggregate peak. In this article we discuss the utility of SEC–MS in the study of aggregation in protein mixtures.

Experimental

Reagents

Ammonium formate, acetonitrile and formic acid were obtained from J.T. Baker Phillipsburg, New Jersey, USA. Bovine serum albumin (BSA), β-Lactoglobulin and Cytochrome C were obtained from Sigma, St Louis, Missouri, USA.

SEC-MS

50 μL of the protein sample containing 5 mg/mL of each protein was injected on a Waters BioSuite 250, 5 μm HR SEC (7.8 mm X 300 mm) column. The mobile phase was 50 mM ammonium formate. All the runs were carried out at a flow-rate of 1 mL/min using Alliance HPLC System with either a 2690 or a 2790 Separation Module. A post column splitter (Upchurch Oak Harbor, Washington, USA) was used to split the flow at the ratio of 4:1. 0.8 mL/min of the eluent was directed to Waters 2996 Photo Diode Array (PDA) Detector. 0.2 mL/min was mixed with an equal volume of 50% acetonitrile, 3% formic acid using a mixer and then introduced into an ESI source to be analysed by MS.

Mass Spectrometry

The mass spectrometric analysis was performed using a Waters Micromass Mass Spectrometer ZQ consisting of a Z Spray electrospray source. The analysis was carried out in the positive mode and Capillary and Cone voltages were set at 3.3kV and 35V respectively. The source and desolvation temperatures were set at 150 °C and 450 °C respectively. Nitrogen was used as cone and desolvation gas wih the flow rates of 50 L/h and 450 L/h.

The distinct multiple charged envelopes obtained for each protein were transformed using the maximum entropy software (MassLynx) to obtain the relative molecular weight.

Protein Aggregation

Protein solution containing 5 mg/mL each of BSA, β-Lactoglobulin and Cytochrome C in water was heated at 60 °C to induce aggregation. The heat-treated and untreated protein samples were then analysed by SEC–MS.

Results and Discussion

The SEC separation of heat-treated protein mixture is shown in Figure 1. Heat treatment can induce unfolding and aggregation in proteins. SEC separation of the heat-treated sample shows an additional peak with retention time 5.80 min comprising of protein aggregates which elute earlier because of their larger size. The separation of protein mixture on BioSuite 250, 5 μm HR SEC (7.8 mm x 300 mm) is shown in Figure 2(a). It can be seen from the figure that the column shows excellent separation of proteins based on their size in solution. BSA dimer which is approximately 132 kDa elutes first at 7.45 min followed by BSA, β-Lactoglobulin and Cytochrome C which are 66 kDa 18 kDa and 12 kDa respectively. SEC cannot be used for the determination of molecular weight as the separation on SEC is based on the hydrodynamic volume and not on the absolute mass of a protein. Additional MS analysis provides useful information about the precise mass of proteins separated by SEC. Figure 2(b) shows the mass spectrum of the proteins from Figure 2(a). Each protein shows a distinct isotopic envelope which is typical of ESI–MS. The isotopic envelope in ESI–MS results from different charge isoforms of the same protein. The absolute molecular weight of the protein can be obtained by deconvolution of the isotopic envelope. The deconvoluted spectrum of the different proteins is shown in Figure 2(c). The absolute masses of 66535, 18359 and 12248 were obtained for BSA, β-Lactoglobulin and Cytochrome C respectively, which agrees well with the theoretical mass of each protein. MS analysis of the peaks gives absolute mass of the components. The absolute mass thus obtained can be used for identification of different components in the peak. In a deconvoluted mass spectrum of the proteins in the aggregate peak, the major peak in the deconvoluted spectrum has mass 66524 Daltons corresponding to the mass of BSA. No peak can be seen at the mass 18359 or at mass 12248 indicating that β-Lactoglobulin and Cytochrome C are absent in the aggregate peak. Hence indicating that the aggregate peak is comprised entirely of BSA. It is interesting to note that even though the aggregates are composed of multiple protein monomers bound by non-covalent bonds the aggregates dissociate during ESI–MS due to the addition of post column acetonitrile and formic acid and due to the high cone voltage used in the analysis. Hence allowing the analysis of protein monomers within the aggregate peak.

Figure 1. SEC-MS of heat treated protein mixture using Waters BioSuite 250, 5 μm HR SEC (7.8 mm x 300 mm) Column.
Figure 2. SEC-MS of protein mixture using Waters BioSuite 250, 5 μm HR SEC (7.8 mm x 300 mm) Column.

Conclusion

We show that SEC–MS is a valuable tool for the analysis of aggregation in the protein mixtures. The additional dimension offered by MS analysis allows the identification of individual components in the aggregate peak. We recommend that UV detection should also accompany SEC–MS as it facilitates the quantification of aggregates.

References

  1. Wen J, Arakawa T, Philo JS. Size-Exclusion Chromatography With on-Line Light-Scattering, Absorbance, and Refractive Index Detectors for Studying Proteins and Their Interactions. Analytical Biochemistry., 1996; 240, 155–66.
  2. HG Barth, BE Boyes and C. Jackson “Size exclusion chromatography,” Anal. Chem., 66, 595R–620R (1994).
  3. H. Gadgil et al., A Novel SEC–MS Method for the analysis of Proteins, Manuscript under preparation.

720000743, September 2003

맨 위로 돌아가기 맨 위로 돌아가기