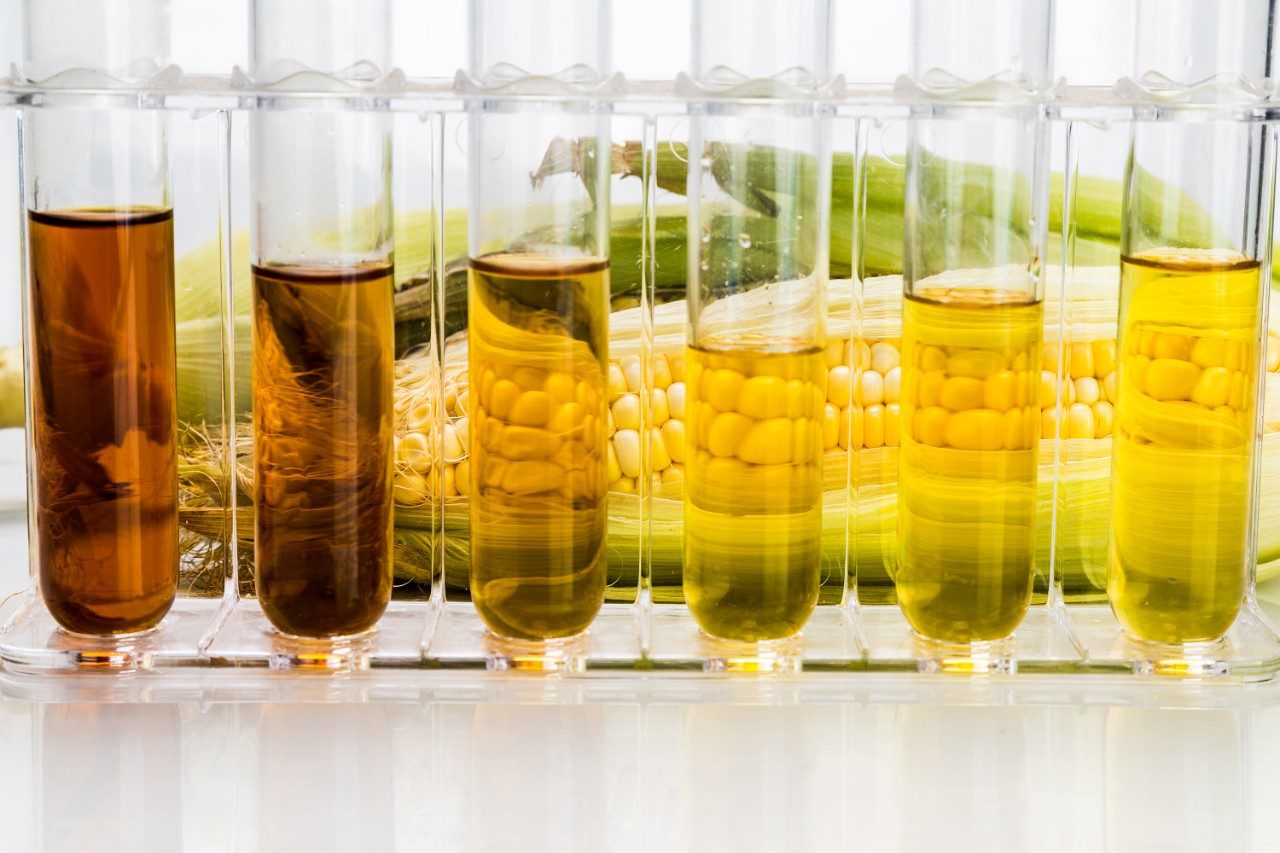
Legislation and public interest for alternative fuels call for increasing the use of ethanol/gasoline blends in the transportation industry. While some regions of the world are driving to limit fossil fuel consumption in non-transportation related applications or reduce greenhouse gas emissions, others are focused on reducing their energy dependency on imported oil1. The United States produced over 3.9 billion gallons of ethanol in 2005, about a 120% increase from 2001. There are more than 100 ethanol biorefineries in 19 states across the country and more than an additional 110 worldwide. In the U.S. alone, the biore-fineries have the capacity to produce more than 4.7 billion gallons of ethanol a year.2 The production of ethanol from a renewable resource such as corn utilizes a fermentation process with enzymes and yeast to convert starches and sugars to ethanol. To improve the productivity of the fermentation process, certain stress factors affecting the activity of the yeast are carefully managed throughout the process. These include monitoring the relative concentrations of glucose, ethanol, lactic acid, and acetic acid.3
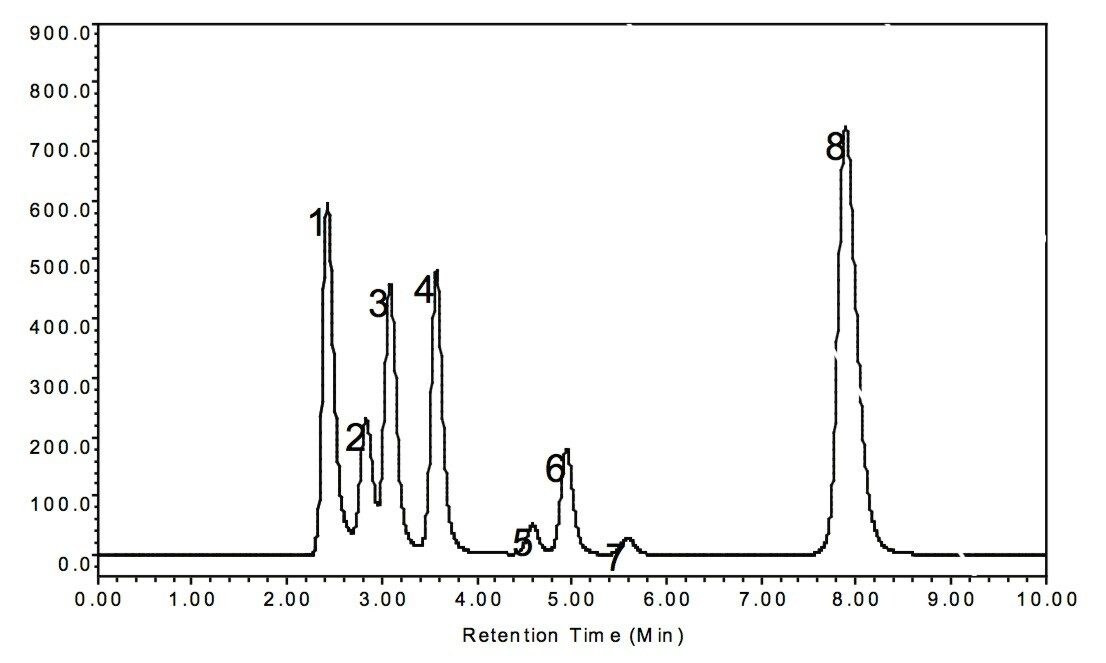
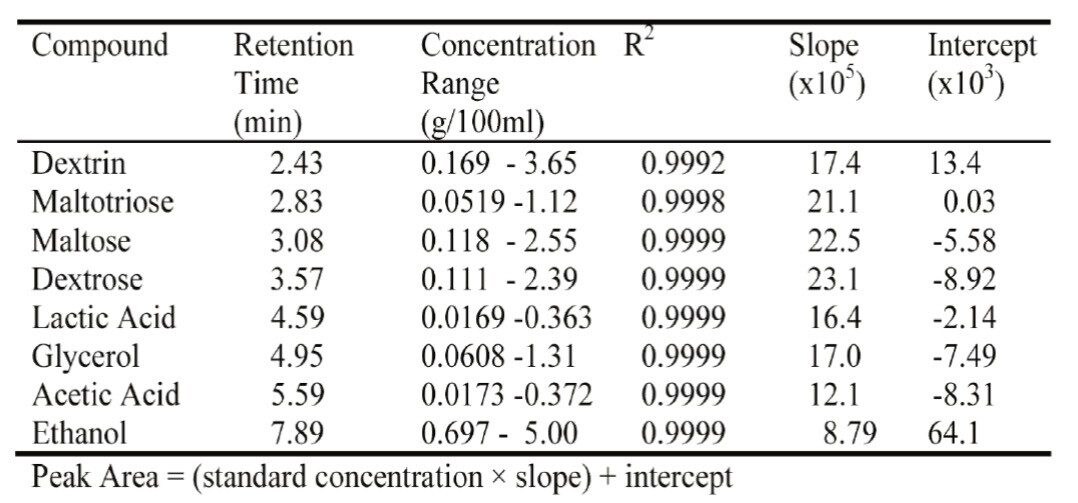
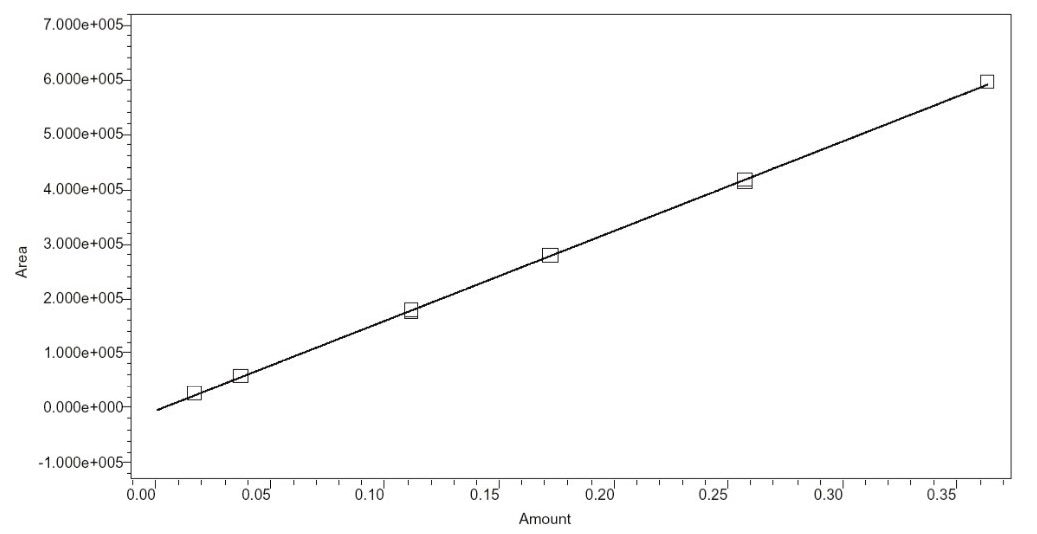
This information is then used to optimize fermentation conditions. HPLC analysis can easily provide information about the critical components and is widely used throughout the U.S. in producer labs. Typical HPLC run times are 20 to 30 minutes.4
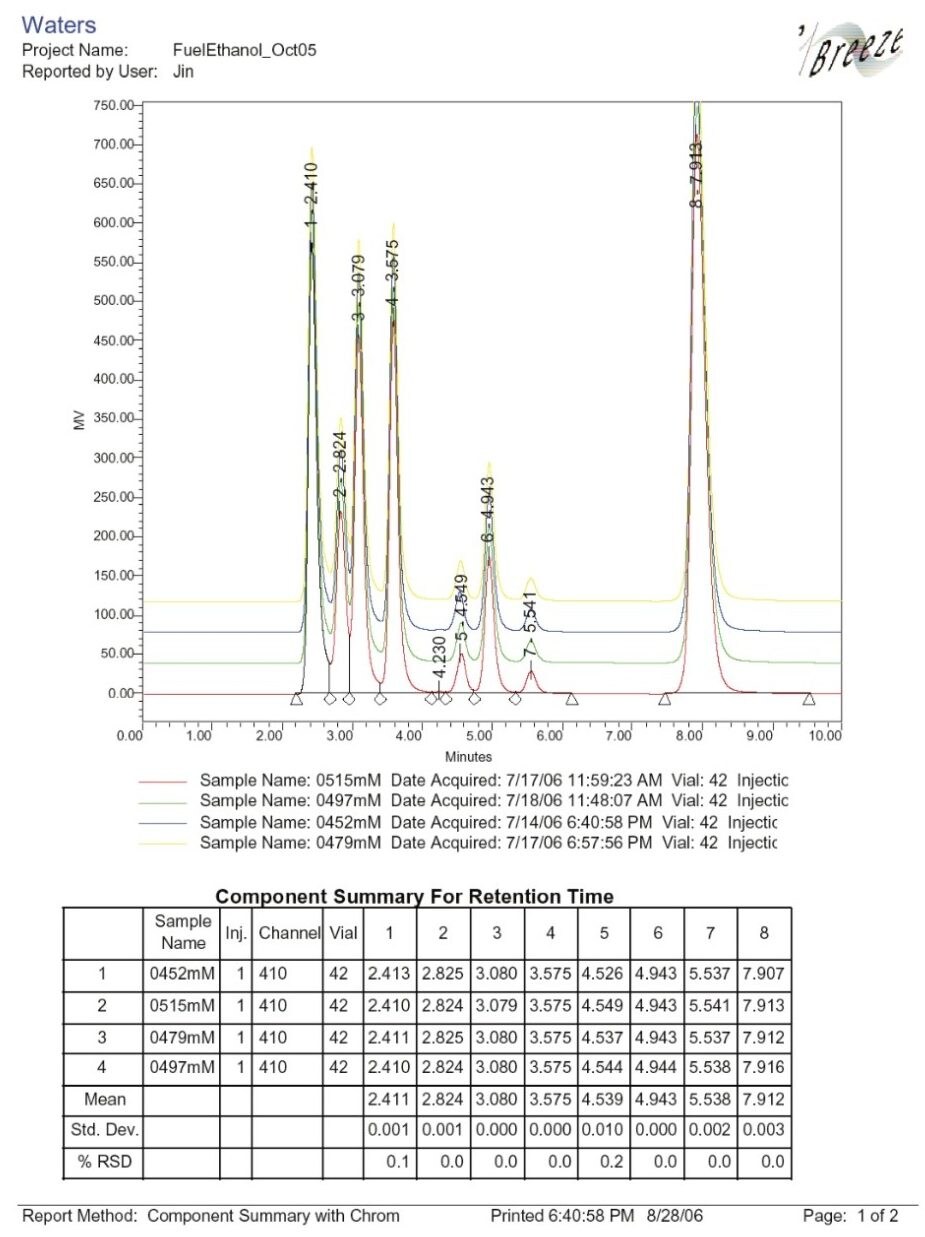
This note describes using a Waters Breeze HPLC System to obtain the necessary information in 10 minutes. With HPLC run times reduced by more than 50%, plant operators can determine component concentra-tions more quickly, resulting in superior fermentation process control. Consequently, plant managers have the potential to increase ethanol plant productivity and reduce loss due to fermentation failure.