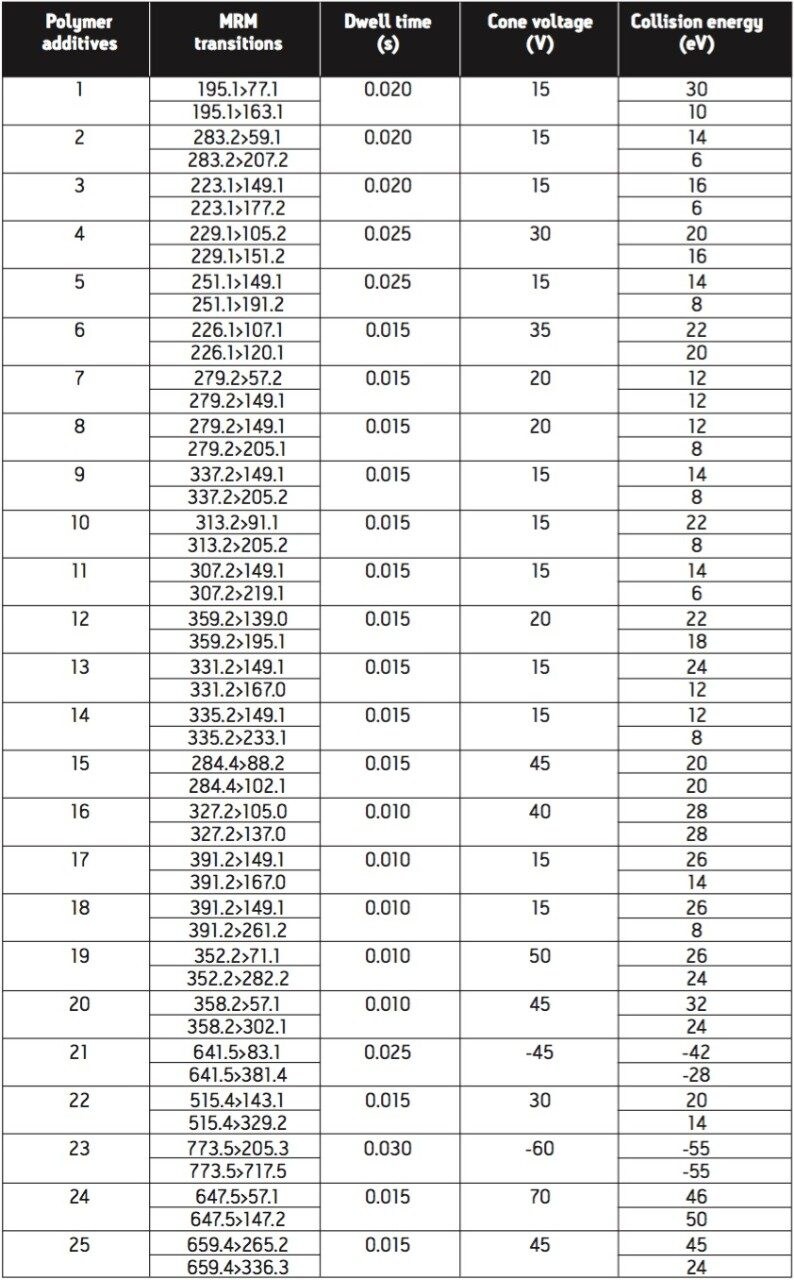
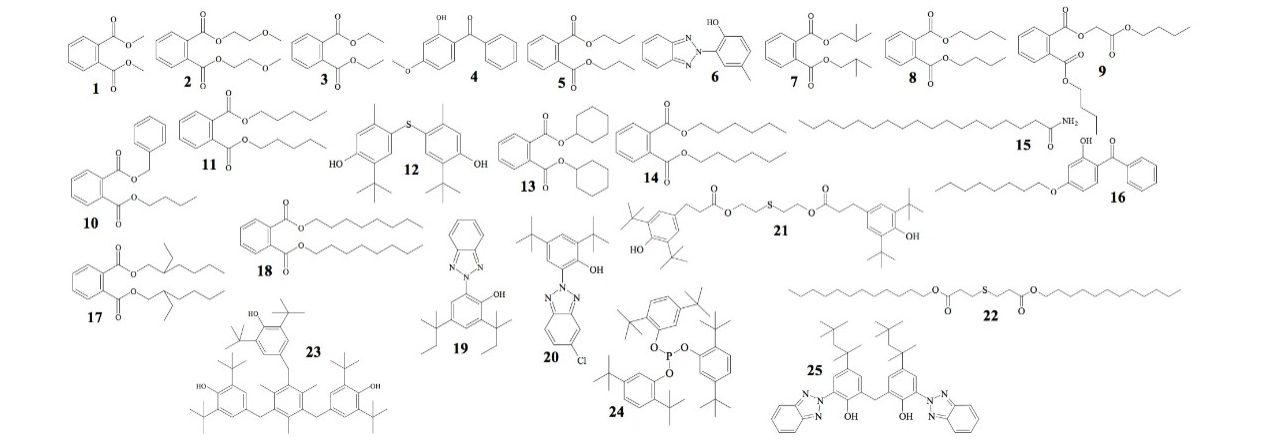
The chemical structures of polymer additives (1-25) in Figure 1 include plasticizers, light stabilizers, UV absorbers, antioxidants, heat stabilizers, slip, and mold release agents. These are commonly used to process and improve the performance of products made with the following polymer resins: PVC, ABS, PC, PE, PP, Acrylics, Polyacetal, Polyamides, Polyesters, Polystyrene, Polyurethanes, Elastomers, and Rubbers.
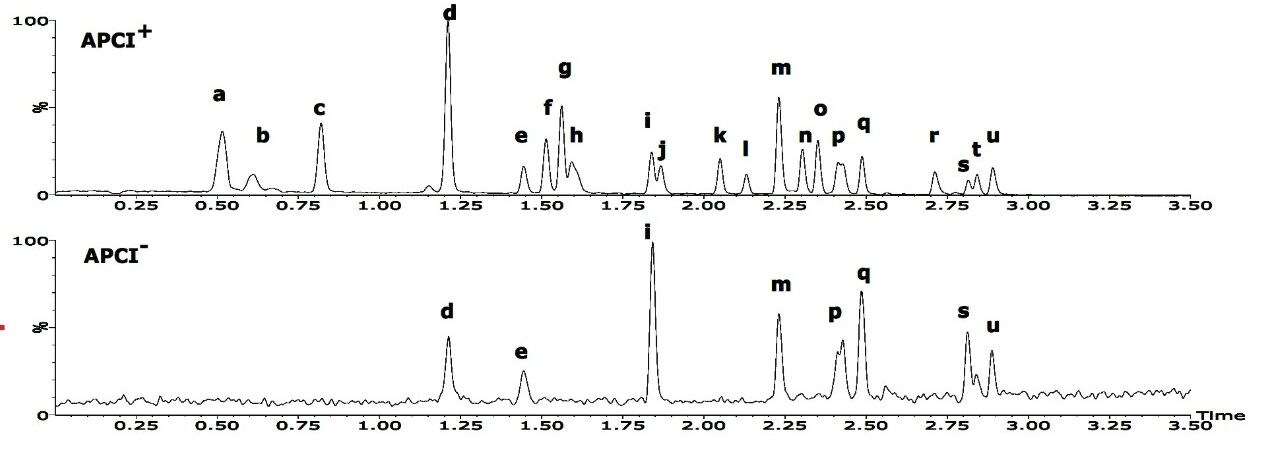
ACQUITY UPLC provides high separation efficiency, sensitivity and speed, and the rapid scanning (10,000 amu/sec) and polarity switching (20 msec) functions of the ACQUITY TQD mass spectrometer allow detection of narrow peaks and provide both positive and negative mass spectra for chemical structure information in a single run. A blend of 25 polymer additives was separated in 3.5 minutes run time using a ACQUITY UPLC BEH Phenyl 2.1 x 50 mm Column. Figure 2 shows the total ion chromatograms (TIC) of positive and negative atmospheric pressure chemical ionization (APCI) scans.
10 polymer additives (4, 6, 12, 16, 19-21, 23-25) were detected by both positive and negative APCI scans while the remaining 15 were observed with only positive APCI scan. In positive APCI scan, 21 and 23 were severely fragmented and pseudomolecular ions were barely recognizable. In negative APCI scan, almost no fragmentation occurs for pseudomolecular ions of 21 and 23, allowing identification with a high degree of confidence. An initial MS full scan provides rapid assessment of polymer additives in the analysis of unknowns in competitive polymer samples or troubleshooting product failures.
Table 1 lists peak ID, retention time, and m/z of the polymer additives. The high resolution power of UPLC/TQD and the unique chemistry of BEH phenyl column baseline resolved the polymer additives with the exception of 4 and 5 which co-eluted in peak d;, 9 and 10 in peak h; 11 and 12 in peak i, and 19; and 20 in peak p.
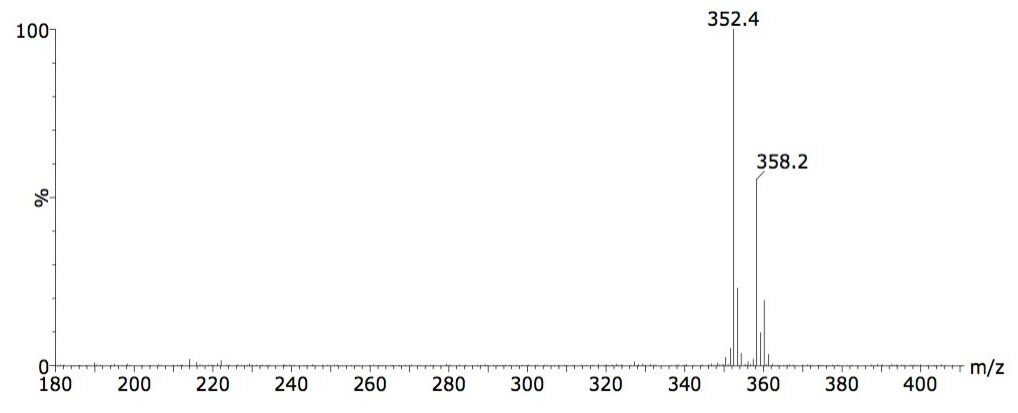
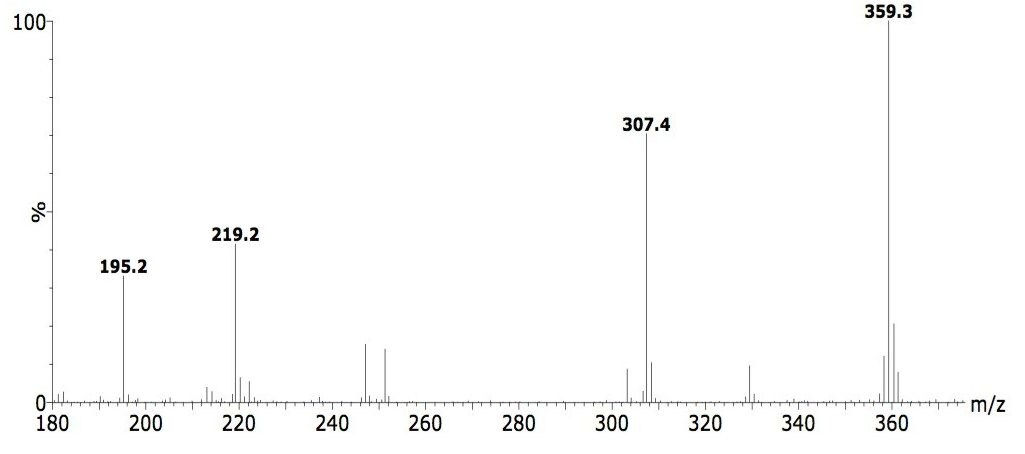
The ACQUITY TQD Mass Spectrometer enables determination of the most discriminating information for compound elucidation, molecular weight, and structural information so that co-eluted non-isomeric additives can be easily analyzed. Figures 3 and 4 show the extracted positive-ion mass spectra of peak p and peak i. The mass spectrum in Figure 3 has two peaks with m/z values of 352 and 358 which match well with the theoretical pseudomolecular ions of 19 and 20. The mass spectrum in Figure 4 has several peaks. Using product ion and precursor ion scan functions of the TQD, the mass spectrum can be interpreted: m/z 219 is a CID fragment ion of pseudomolecular ion 11 (m/z, 307), and m/z 195 is a fragment ion of 12 (m/z, 359).
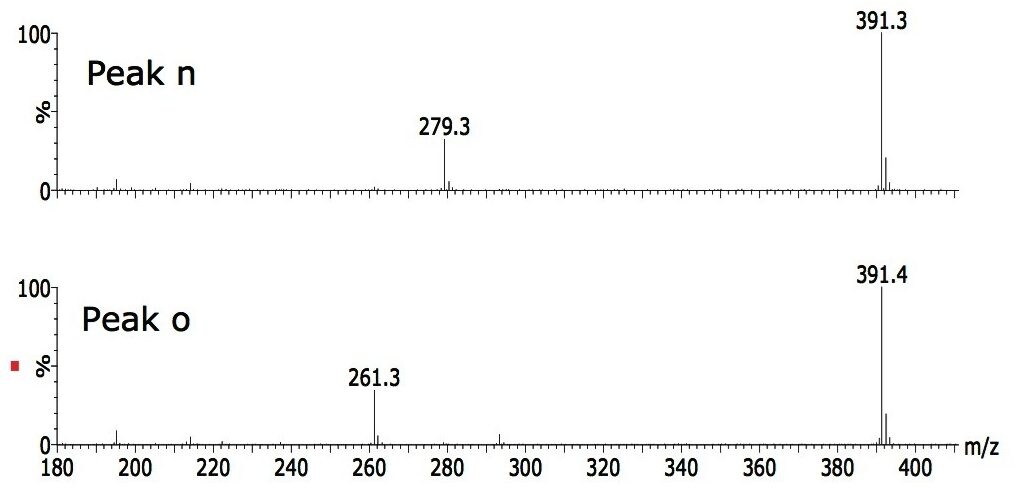
It is critical to have isomeric components chromatographically resolved for qualitative and quantitative analysis by LC-MS. The isomers 7-8 and 17-18 are well separated into four peaks f, g, n and o. Figure 5 shows the extracted positive-ion mass spectra of peak n and peak o. Each spectrum has two peaks, with the same pseudomolecular ion m/z 391. Product ion and precursor ion scan data confirm that m/z 279 is a CID fragmented ion of 17 while m/z 261 is a fragment ion of 18.

![Proposed MS-MS fragmentation pathway of 17 [M+H] + adduct ion for the major product ions in figure 6Q: 1A.](/content/dam/waters/en/app-notes/2008/720002488/720002488en-f6.jpg.82.7-10-943-1260C.resize/img.jpg)

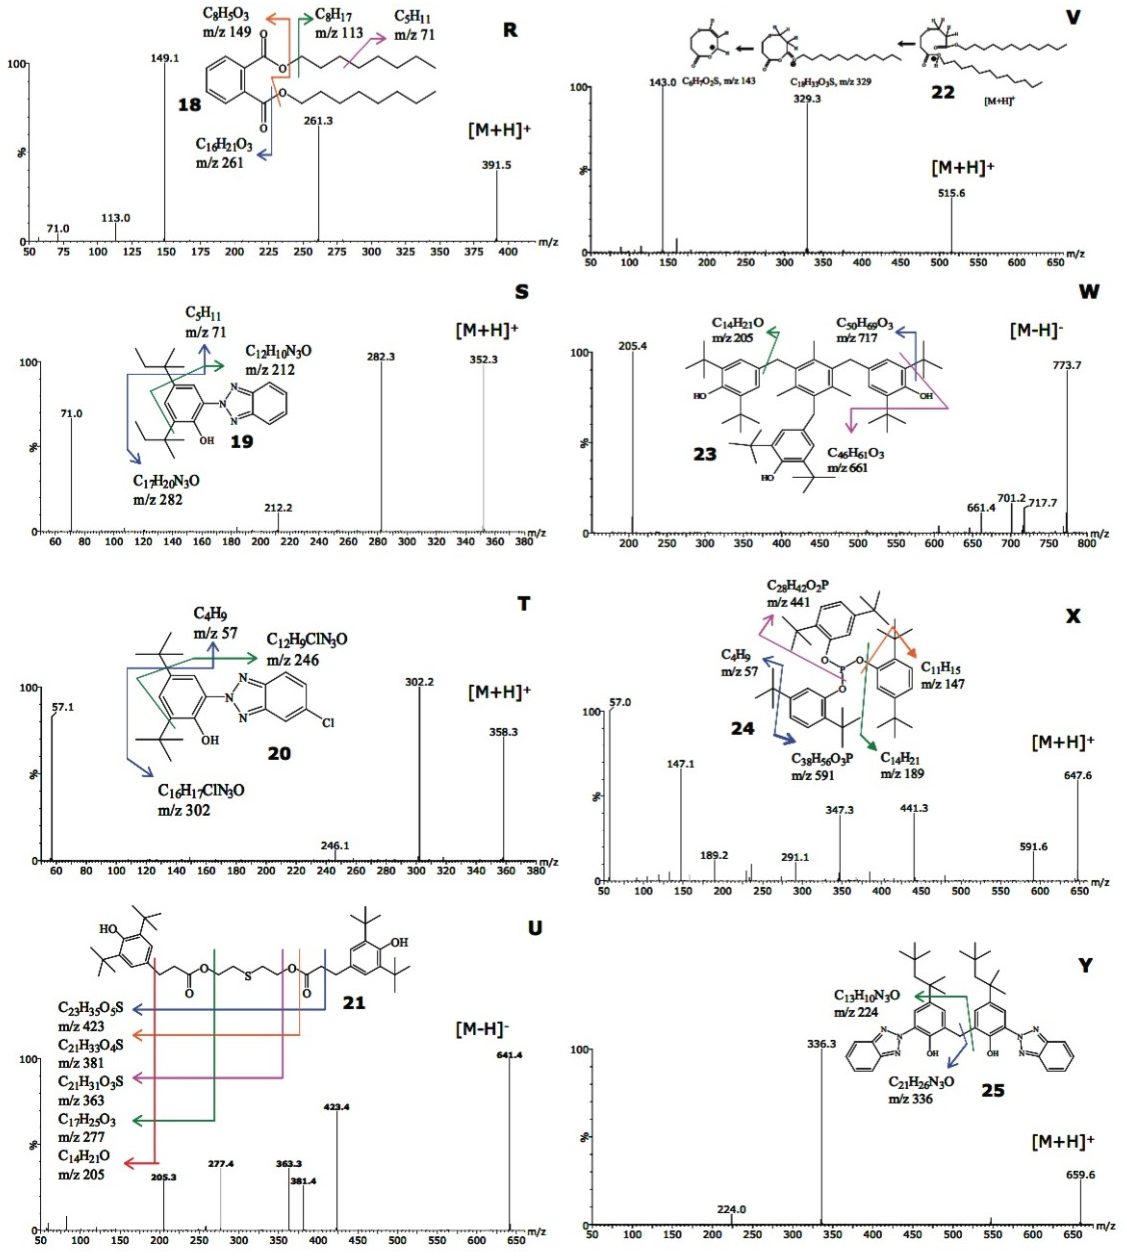
![Proposed MS-MS fragmentation pathway of 21 [M-H]- adduct ion for the major product ions in figure 6Q: 2A. and 2B.](/content/dam/waters/en/app-notes/2008/720002488/720002488en-f10.jpg.82.11-9-967-1267C.resize/img.jpg)