• 응용 자료

Quantitative Analysis of 21 Benzodiazepine Drugs, Zolpidem and Zopiclone in Serum Using UPLC-MS/MS

Quantitative Analysis of 21 Benzodiazepine Drugs, Zolpidem and Zopiclone in Serum Using UPLC-MS/MS

  • Mark Roberts
  • Michelle Wood
  • Waters Corporation

Abstract

This application note describes how to develop a UPLC-MS/MS method for the quantitation of 21 benzodiazepines, Zolpidem and Zopiclone in human serum.

Introduction

Benzodiazepines (Figure 1) are the most frequently prescribed drugs in the western world. They are indicated for a variety of disorders including: anxiety; insomnia; agitation; muscle spasms and alcohol withdrawal. They work primarily due to their interaction with the GABAA receptor.

Figure 1. Core Structure of the Benzodiazepines

Many of the benzodiazepines are potentially addictive1 and longterm use can lead to dependency. Consequently their analysis is of key importance in both clinical and forensic settings. Misuse of these medications by vulnerable populations such as the elderly2 or the mentally-ill3 is common. The elderly are at particular risk, as sensitivity to benzodiazepines tends to increase with age thus, these analytes are commonly reported in self-poisonings4-7. Recreational use of benzodiazepines has also been reported; they are often used in combination with other narcotics e.g., they can be used to augment the ‘high’ of heroin or cocaine or can be used to reduce the after-effects of LSD or amphetamine use8. Drug-facilitated crime often involves benzodiazepines due to their sedative properties and amnesia-producing effects9.

Traditional techniques used for the quantitation of benzodiazepines include gas chromatography/mass spectrometry (GC-MS) and high performance liquid chromatography/mass spectrometry (HPLC-MS). The former typically requires inclusion of an additional derivatisation step and analysis can be problematic due to the thermo-labile nature of some of the analytes within this class. In contrast, HPLC-MS can separate a wide range of substances without the need for derivatisation and utilises ‘softer’ ionisation techniques e.g., electrospray ionisation (ESI) which allows the protonated molecular species to remain intact.

Since its introduction in 2004, UltraPerformance LC (UPLC) has repeatedly demonstrated significant advantages compared to HPLC-based methods e.g., enhanced resolution, sensitivity and throughput. Thus our aim was to develop a method utilising this technique.

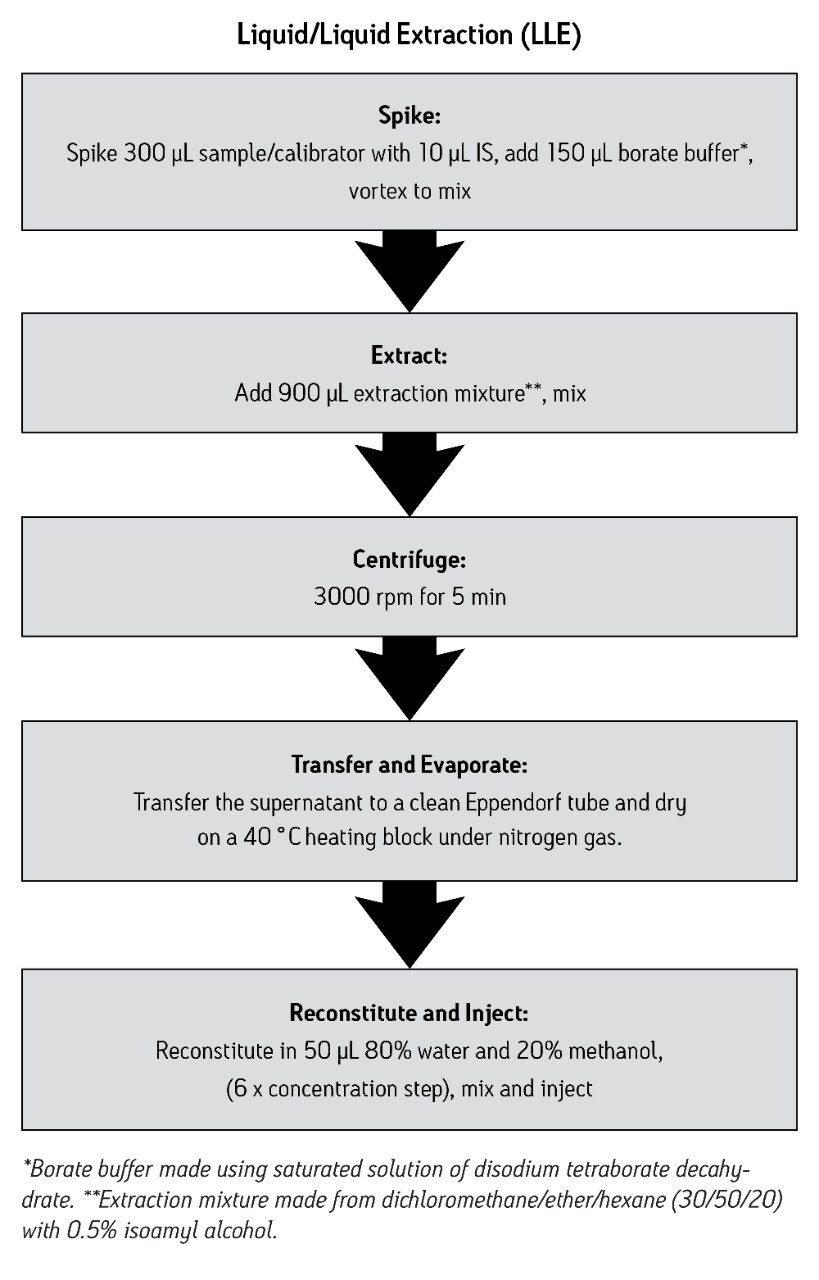
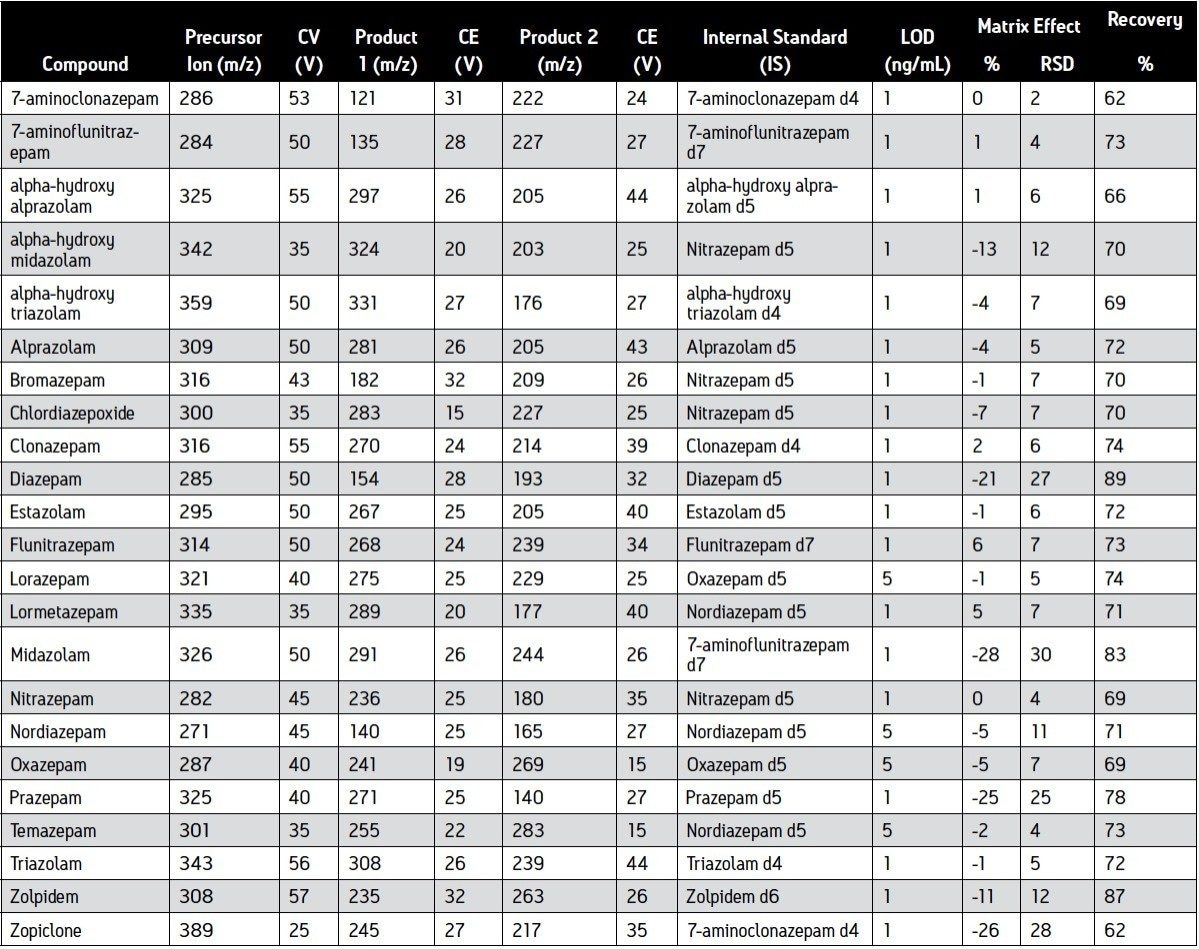
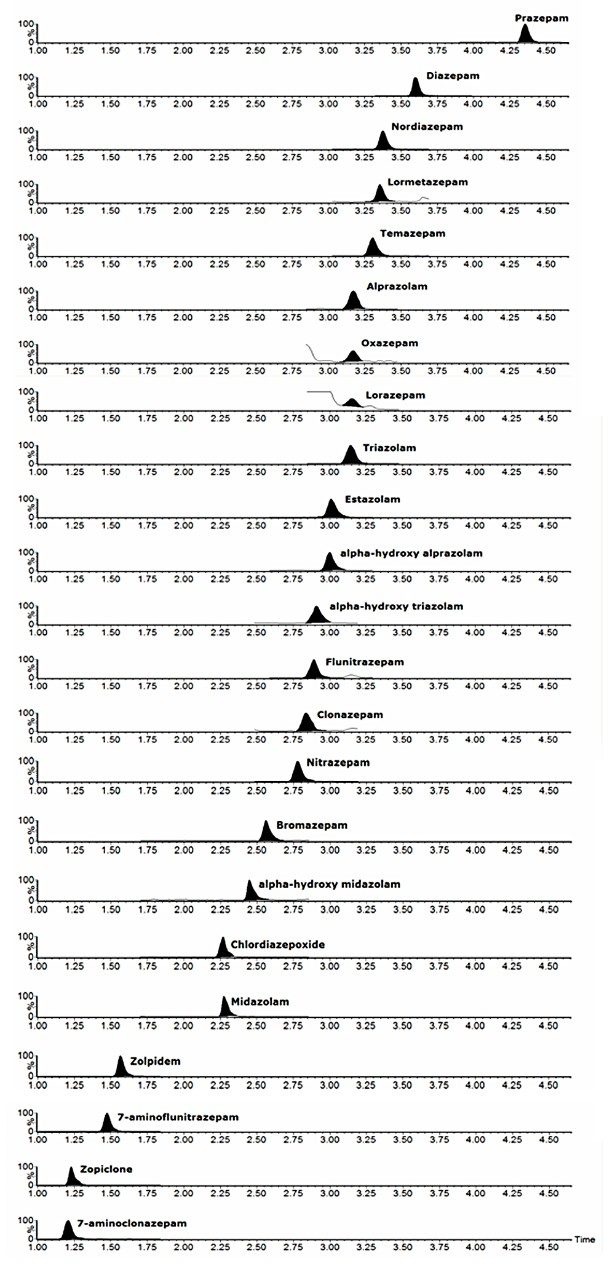
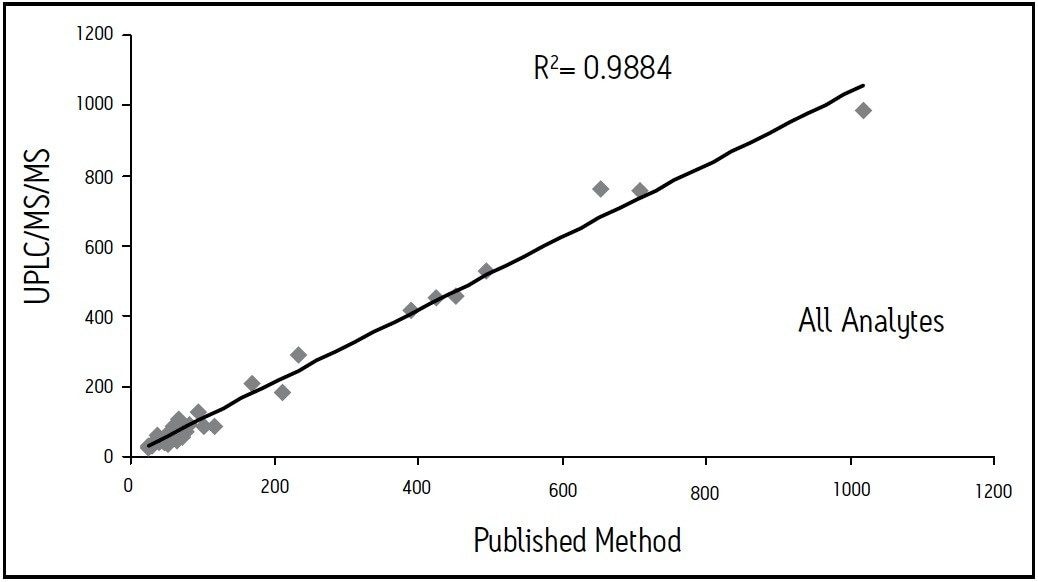
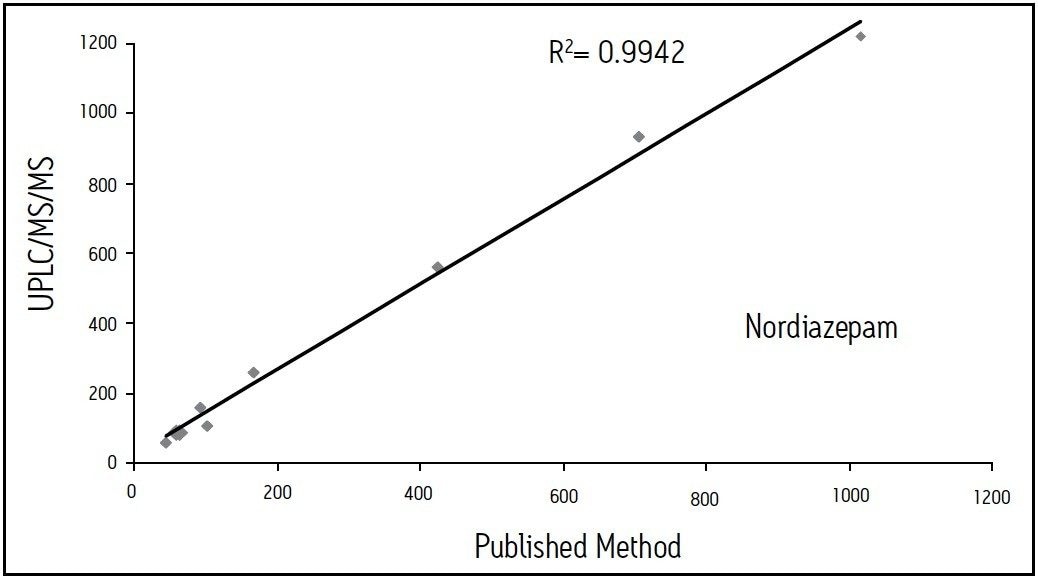
We describe a quantitative method based on liquid/liquid extraction (LLE) and UPLC with tandem mass spectrometry (MS/MS). The method’s performance has been evaluated using authentic samples. Data were compared to results obtained with a validated method based on HPLC-MS/MS10.

Experimental

Materials

Samples

Twenty-seven authentic serum and plasma samples were received which had previously been analysed by a published method involving conventional SPE and HPLC-MS/MS analysis10.

Standards, Internal Standards and Blank Serum

Standards (1 mg/mL) and their deuterated internal standards (IS) at 0.1 mg/mL were purchased from LGC Standards (Teddington, UK). Internal standards were made into a mixed stock of 5 μg/mL in water.

Blank serum was obtained from Scipac (Sittingbourne, UK). Serum calibrators (0 to 1000 ng/mL) were prepared by adding mixtures of drug standards to the blank serum.

Sample Preparation

LC Conditions

LC System:

Waters ACQUITY UPLC System

Column:

ACQUITY UPLC BEH C18 Column, 2.1 x 100 mm, 1.7 μm

Column Temp:

50 ˚C

Flow Rate:

400 μL/min.

Mobile Phase A:

0.1% formic acid in water

Mobile Phase B:

0.1% formic acid in methanol†

Injection Volume:

10 μL

Strong Wash:

Mobile Phase B (500 μL)

Weak Wash:

Mobile Phase A (1500 μL)

†The organic mobile phase chosen for this UPLC chromatography method was methanol, avoiding the use of acetonitrile which has been more difficult to obtain due to global shortages.

Gradient:

Time/min

%A

%B

Curve

0

70

30

-

2.5

35

65

6

3.25

30

70

6

4.5

23

77

6

4.55

5

95

6

5.55

5

95

6

5.6

70

30

6

7.5

70

30

6

MS Conditions

MS System:

Waters TQ Detector (TQD)

Ionization Mode:

ESI Positive

Capillary Voltage:

3 kV

Desolvation Temp:

400 ˚C

Desolvation Gas:

800 L/Hr

Source Temp:

120 ˚C

Acquisition Mode:

Multiple Reaction Monitoring (MRM)

Results and Discussion

Method Validation

The MRM transitions and optimised conditions for all of the drugs and metabolites are shown in Table 1. Each analyte was monitored using two transitions i.e., a quantifier and qualifier. Internal standards were monitored using a single transition.

Table 1. MRM transitions with cone voltages (CV) and collision energies (CE) for 23 analytes, product 1 is the quantifier ion and product 2 is the qualifier ion.

To investigate linearity for all of the analytes, spiked serum calibrators were prepared in triplicate at 0, 1, 5, 10, 100, and 1,000 ng/mL, and extracted using LLE as previously described. Following analysis, calibration curves were plotted with a 1/x weighting. Average r2 values were all >0.995 except for alphahydroxy triazolam which was 0.975 for 1-100 ng/mL.

Quantitation was performed by integrating the area under the peak for each analyte MRM trace and referencing to the appropriate deuterated internal standard peak area. Figure 2 shows the quantifier ion traces for all analytes at 1 ng/mL. The limit of detection (LOD) was defined as the concentration which gave a signal to noise (S:N) ratio >7:1 (for both qualifier and quantifier). The data is summarised in Table 1.

Figure 2. Quantifier ion traces for all analytes for the extracted 1 ng/mL serum calibrator. N.B. Lorazepam, Nordiazepam, Oxazepam and Temazepam are below LOD for this UPLC-MS/MS method.

Recoveries and matrix effects were assessed using six different sources of blank sera (Table 1). Recoveries were investigated using pre- and post-spiked serum at 50 ng/mL and ranged from 62% to 89%.

Matrix effects were determined by comparing the responses for analytes spiked into extracted blank sera to those spiked into mobile phase. Generally these were considered to be satisfactory and ranged from -28% suppression to +6% enhancement (0% indicates no matrix effect).

Extracted sample stability was assessed using 16 blank serum samples which were spiked at 50 ng/mL and extracted by LLE as described. The reconstituted extracts were pooled into one vial which was placed in the ACQUITY autosampler at 5 °C for 11 hours and injections made every 45 minutes. No significant loss in peak area, for either the standards or the IS, was observed over the period investigated.

Sample Analysis

A total of 27 authentic serum and plasma samples were anonymised, extracted by LLE and analysed by the described method. The following criteria were used for a positive identification: analytes must be within 0.2 min of the expected retention time, ion ratios within 15% of the predicted ratio. For these analyses, the predicted ratio was defined as an average of the calibrator ratios at 1, 10 and 100 ng/mL. The TargetLynx application manager was used to process the data for these samples, it was set to automatically flag any analytes with a retention time or ratio that fell outside the user-defined settings mentioned above. This minimises the amount of time required for the user to interrogate processed data.

The data were subsequently compared to those obtained previously at a separate laboratory using a published, validated method for a smaller panel i.e., 13 benzodiazepines. These data are shown in Figures 3 and 4.

Figure 3. Comparative data for the newly-developed UPLC-MS/MS method versus a previously-published method. The 39 results plotted include all found analytes with concentrations in ng/mL.
Figure 4. Comparative data for the newly-developed UPLC-MS/MS method versus a previously-published method. Nine results are plotted for nordiazepam only with concentrations in ng/mL.

Overall there was excellent correlation (r2 values above 0.98) between the newly-developed method and the published method. An example of a positive authentic sample is shown in Figure 5; a negative control is also included for comparison.

Figure 5. A positive result for clonazepam at 40 ng/mL. A is the zero serum calibrator and B is the authentic sample. The top trace is the internal standard, middle is 316>214 (qualifier) and bottom is 316>270 (quantifier). The numbers above the peaks show peak area and to the right of the peak is the peak intensity.

Conclusion

Benzodiazepines need to be monitored in both clinical and forensic laboratories and so an accurate, reliable and robust method is needed to quantitate these drugs in biological samples. To this end we have developed a fast, sensitive method for an extensive panel of commonly-prescribed benzodiazepines using UPLC-MS/MS.

Unlike GC-MS, this technique requires no derivatisation and due to softer ionisation it is possible to monitor specific fragmentations from the protonated molecular species of the analytes. In comparison to HPLC-based methods, those based on UPLC offer superior chromatographic resolution, enhanced sensitivity and shorter analytical run times.

The results for 27 authentic serum and plasma samples analysed using the described LLE-UPLC-MS/MS method were compared to those obtained previously with a published, validated method; the data showed excellent agreement.

This application is an example of an assay that can be performed using Waters systems. Complete method validation by the end user is required.

References

  1. Longo LP and Johnson B. American Academy of Family Physicians http://www.aafp.org/afp/20000401/2121.html (2000) 61 (7) 2121-2130
  2. Bogunovic O and Greenfield S. Pyschiatric Services http://ps.psychiatryonline.org (2004) 55 (3): 233-235
  3. Brunette M et al. Pyschiatric Services http://ps.psychiatryonline.org (2003) 54 (10): 1395-1401
  4. McLoone P and Crombie IK. The British Journal of Psychiatry (1996) 169: 81-85
  5. Prescott LF and Highley MS. British Medical Journal (1985) 290: 1633-1636
  6. Stern TA et al. Annals of Clinical Psychiatry (1991) 3 (3): 223-231
  7. Wang H et al. Zhonghua Nei Ke Za Zhi/Chinese Journal of Internal Medicine (2002) 41 (6) 408-410.
  8. Wood M et al. Journal of Analytical Toxicology (2003) 27: 505-512
  9. Dorandeu A et al. Journal of Clinical Forensic Medicine (2006) 13: 253-261
  10. Marin SJ et al. Journal of Analytical Toxicology (2008) 32: 491-498

Acknowledgements

Stephanie Marin (ARUP laboratories, Salt Lake City, Utah, USA) for supplying pre-analysed authentic samples containing benzodiazepines.

This method is an example of an application using the instrumentation, software and consumables described in this Application Note. Waters has not verified that this method is transferable to different instrumentation, software or consumables. Application Notes are intended as a proof of concept and may serve as a reference as end users develop & validate their own laboratory developed tests (LDTs). The end user is responsible for completion of the method development and validation of any such LDT. The method has not been cleared by any regulatory entity for diagnostic purposes.

720003388, June 2010

맨 위로 돌아가기 맨 위로 돌아가기