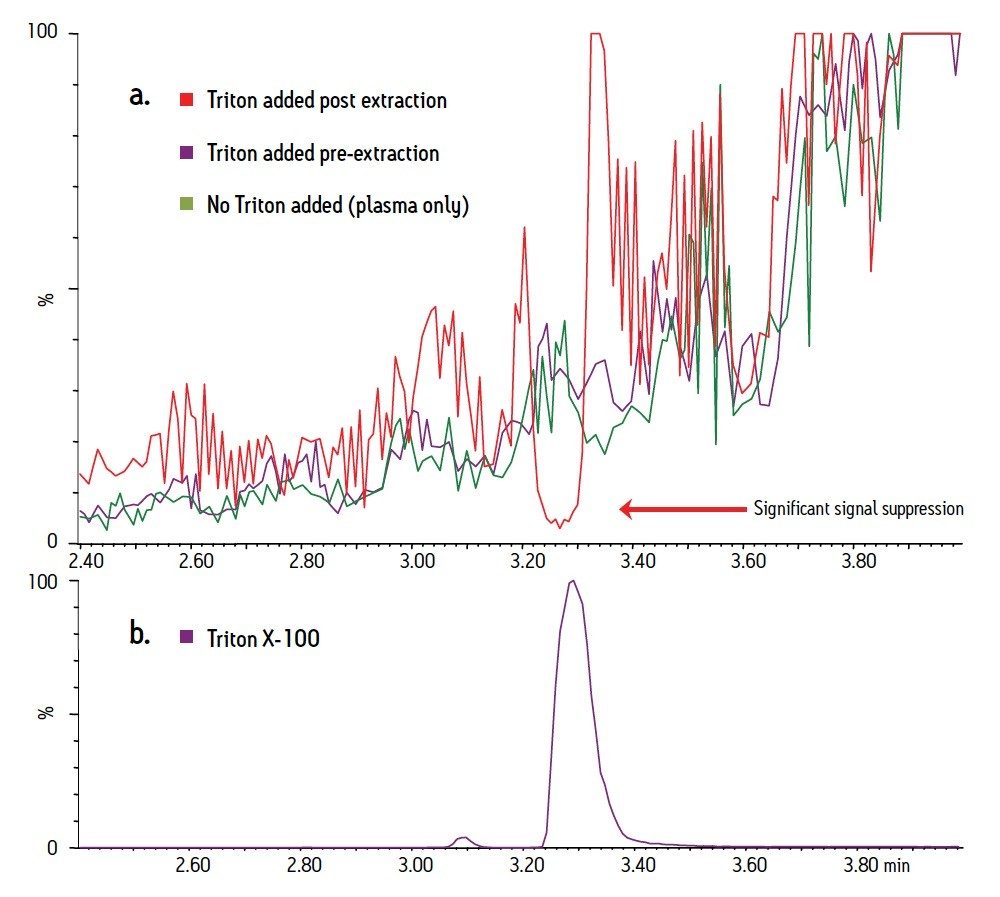
Pharmaceutical dosing vehicle excipients such as Triton X-100 are often added to formulations to facilitate dissolution in dosing media. Unfortunately, these compounds can cause significant matrix effects, typically ion suppression, in LC-MS/MS analyses. The use of fast LC gradients, common in drug discovery, can result in co-elution of target analytes with these compounds. Early pharmacokinetic (PK) time points, when the concentration of these excipients is elevated, can be particularly troublesome as this co-elution has been shown to be a major contributing factor to excipient related ion suppression.1-3 Several approaches have been investigated to attempt to minimize this problem, including LC gradient manipulation,2,3 alternative analytical column choices,1 different sample preparation strategies,1-3 sample dilution,5 and even the development of a novel formulating agent.4 While some of these strategies have been successful, they each have their limitations. Clearly, the choice of formulation excipient is often beyond the control of the analyst. LC optimization, either by gradient or mobile phase manipulation, or by alternative column selection can solve this problem for some analytes, but not always, and requires additional method development. In addition, extensive manipulation of LC conditions is not always conducive to a high-throughput screening environment.
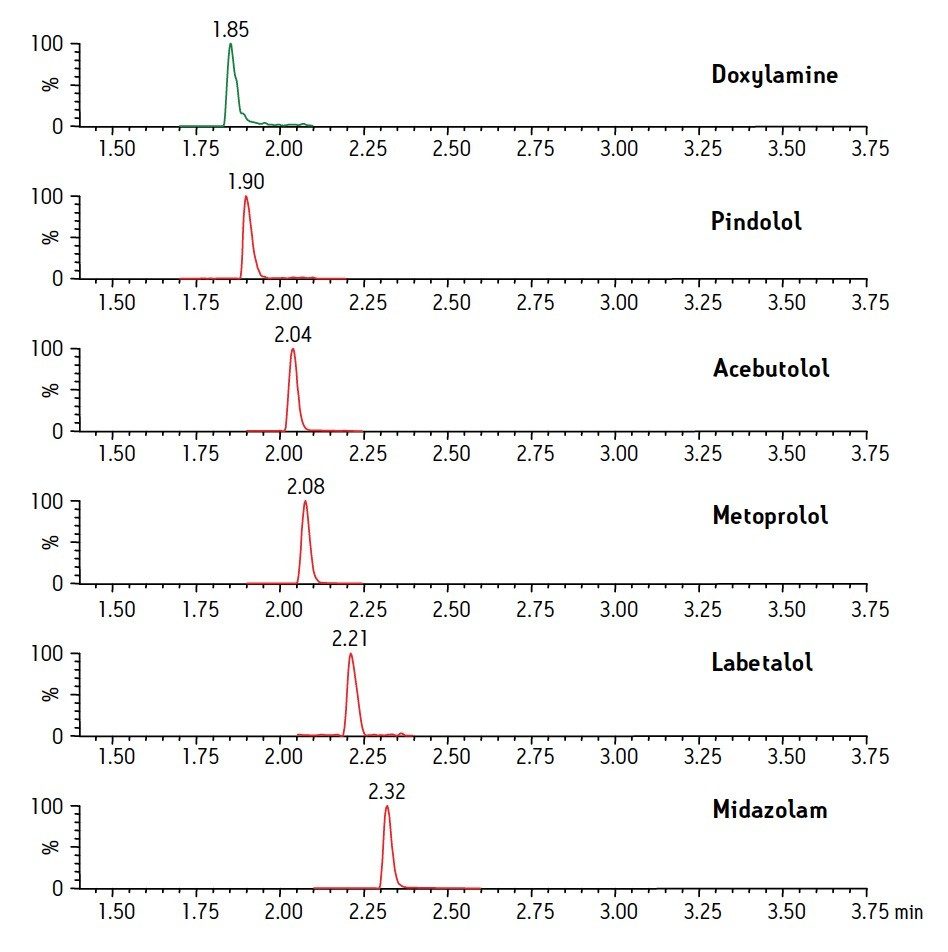
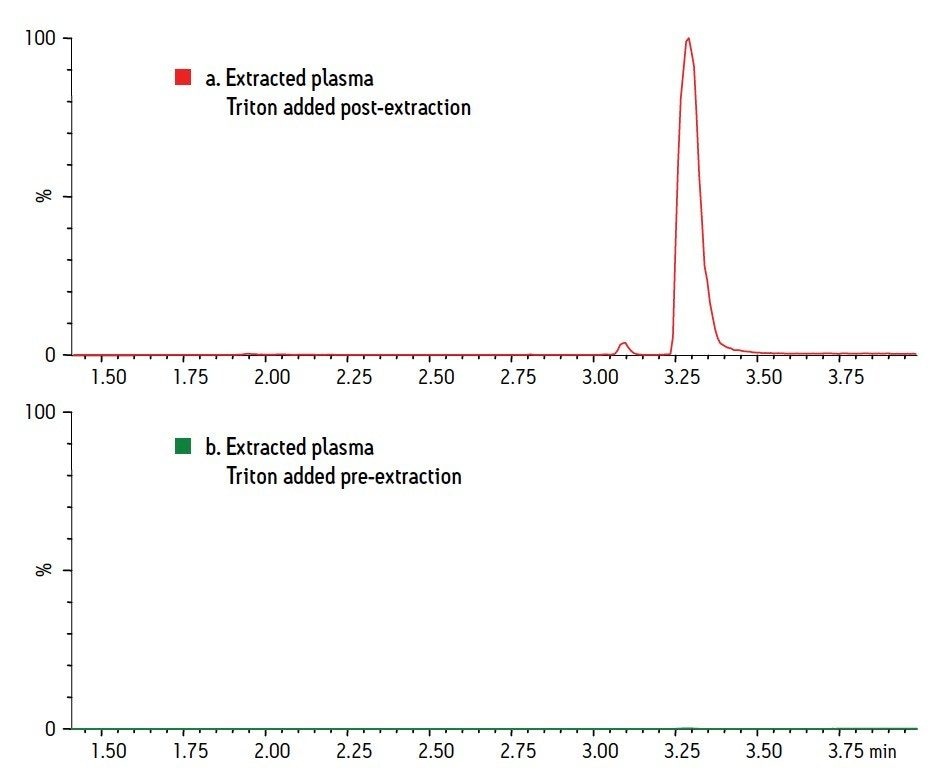
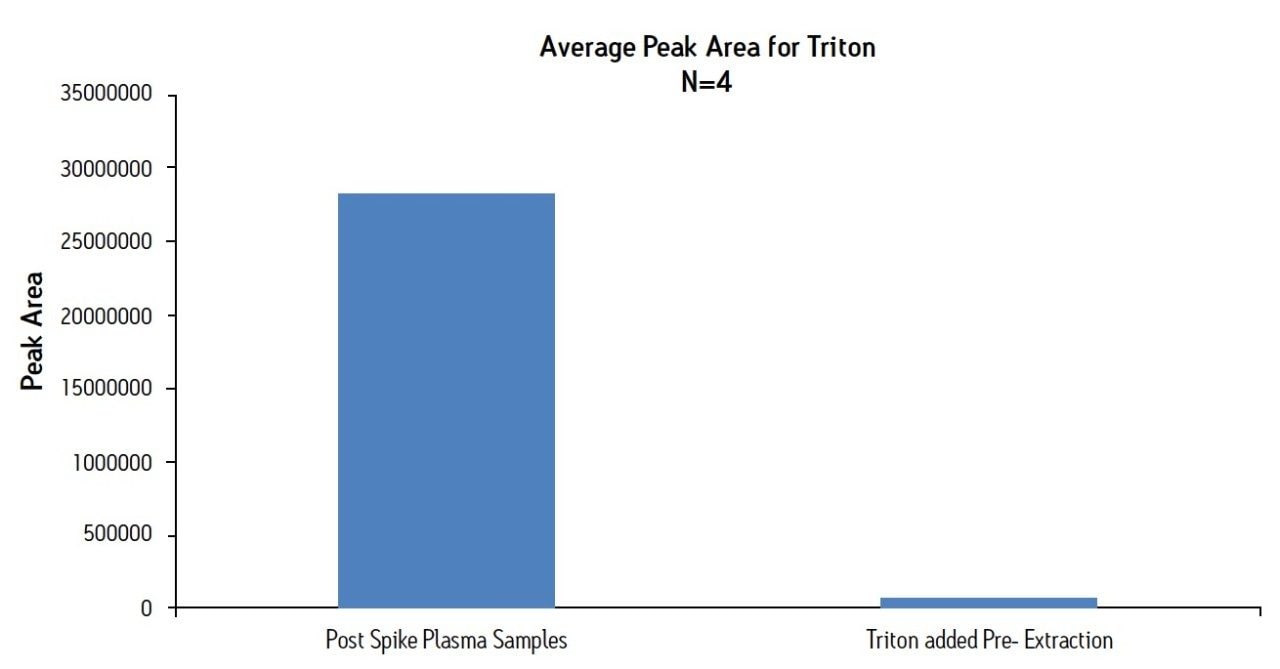
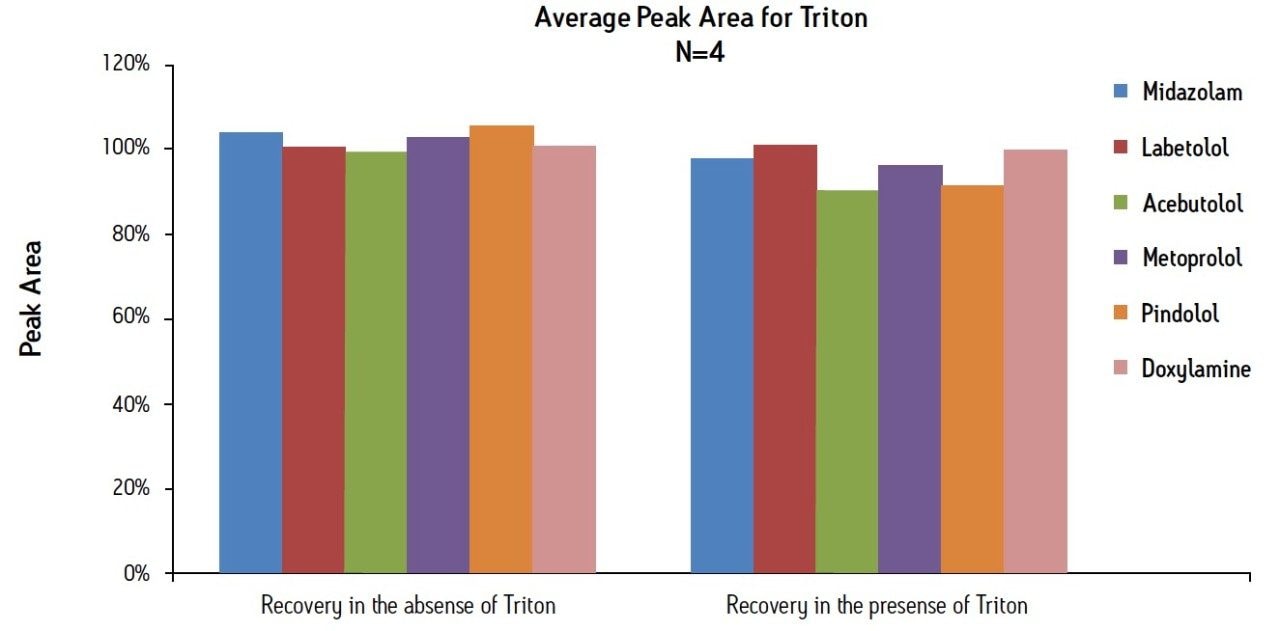
This work represents a fast, simple, and elegant solution to this problem through the use of Oasis mixed-mode cation exchange (MCX) SPE. Basic analytes are bound to the sorbent by strong cation exchange, while non-ionic excipients such as Triton bind by reverse phase, and can be selectively removed before analyte elution.