• 응용 자료

Standardization of LC-MS for Therapeutic Drug Monitoring of Tacrolimus

Standardization of LC-MS for Therapeutic Drug Monitoring of Tacrolimus

  • Thomas Annesley
  • Denise McKeown
  • David W Holt
  • Christopher Mussell
  • Elodie Champarnaud
  • Leonie Harter
  • Lisa J. Calton
  • Donald Mason
  • University of Michigan
  • University of Glasgow
  • Analytical Services International Ltd.
  • Chemical Measurement and Calibration, LGC Limited
  • Waters Corporation

Abstract

In this study we have performed a proficiency-testing survey of laboratories using the Waters MassTrak Immunosuppressants Kit on the ACQUITY TQD LC-MS/MS instrument to assess whether interlaboratory imprecision could be improved through standardization of LC-MS analysis. Further, we compared a subset of the results obtained using this test system to a reference measurement procedure for tacrolimus.

Benefits

  • Rapid, routine LC-MS method for tacrolimus TDM
  • Method is specific for the active parent compound 
  • Test results are in close agreement with a reference measurement procedure 
  • Test results across multiple laboratories are comparable 
  • Calibrators, QCs, and internal standards from a single source

Introduction

The immunosuppressant drug tacrolimus (FK506, Prograf) is the most commonly prescribed calcineurin inhibitor for the prophylaxis of rejection following kidney transplantation. Monitoring trough whole blood concentrations, the preferred specimen in clinical settings,1 is used as a surrogate for tacrolimus exposure. Although dose adjustments that are critical to regulating the degree of immunosuppression are made, in part, on the basis of laboratory results, precise therapeutic ranges have yet to be established.2 Likewise, the concentration – effect relationship for tacrolimus remains poorly defined perhaps owing to the variety of analytical methods used for measuring tacrolimus that are neither standardized nor traceable to a single defined accuracy standard.

In this study we have performed a proficiency-testing survey of laboratories using the Waters MassTrak Immunosuppressants Kit on the ACQUITY TQD LC-MS/MS instrument to assess whether interlaboratory imprecision could be improved through standardization of LC MS analysis. Further, we compared a subset of the results obtained using this test system to a reference measurement procedure for tacrolimus.

Experimental

Tacrolimus proficiency testing panel

A whole blood tacrolimus panel was prepared at Analytical Services International Ltd (ASI). The panel consisted of 10 patient pools (target 0-25 ng/mL) and 10 tacrolimus-supplemented samples (target 2-25 ng/mL), prepared in duplicate for a total of 40 samples. The samples were randomized and sent blindly to seven laboratories in the USA and Europe. Four of the patient pools were prepared in sufficientvolume (approximately 20 mL) to allow for value assignment by an exact-matching isotope dilution mass spectrometry method (the reference measurement procedure, RMP) at LGC.

Sample analysis

Samples were analyzed initially at ASI by an LC-MS method used for value assignment of samples distributed by the International Proficiency Testing Scheme (IPTS) for tacrolimus. This method has previously been shown to be in good agreement with the RMP at LGC.3 Participating laboratories analyzed the samples in the test panel as unknowns, following the directions for use that accompany the test kit and as outlined in Figure 1.

Figure 1. Sample pretreatment protocol used by all participating laboratories for the analysis of tacrolimus in whole blood.

Data analysis

Data from the participating laboratories were used to estimate interlaboratory imprecision. The data were also compared to the ASI method as an initial measure of accuracy. Accuracy was further assessed for a subset of the patient pools (n = 4) by comparing the mean concentrations from the 7 laboratories to the RMP.

Statistics

Passing-Bablok regression analysis, Pearson correlation analysis, and Bland-Altman bias estimation were calculated using Analyse-it for Microsoft Excel (version 2.30).

Results and Discussion

Interlaboratory agreement

Table 1 lists the mean, %CV, and range of results returned by the participating laboratories. For tacrolimus-supplemented samples the range of imprecision (%CV) was 3.7% to 12.2%. One whole blood sample was a blank sample not supplemented with tacrolimus, and no center reported any tacrolimus in that sample above the lower limit of quantification of the assay (0.38 ng/mL). The lower limit of quantification was defined as the lowest concentration at which both the CV and bias from anticipated values of QC material were <20%.4 For patient pools, which more closely represent true patient samples vs supplemented samples, the %CV for the standardized MassTrak LC-MS assay ranged from 2.0% to 5.4%, with a mean of 4.3% (Table 1). For all of the supplemented samples and patient pools, the mean interlaboratory CV for the standardized LC-MS assay was 5.5% compared to a mean CV of 6.4% for the Abbott Architect assay in an earlier, comparable study.3

Table 1. MassTrak Immunosuppressants assay imprecision with tacrolimus proficiency panel

The concentration for the supplemented samples is the amount of tacrolimus added to blank whole blood. The concentration for each pool from patients receiving tacrolimus was quantified by the validated liquid chromatography–tandem mass spectrometry method at ASI. Samples were tested in duplicate by each method.

Comparison to the IPTS Method

Figure 2 shows the combined method comparison data (MassTrak LC-MS vs the ASI LC-MS assay) for the 7 laboratories. For the 40-member panel the MassTrak assay demonstrated overall excellent agreement (y = 1.02x - 0.02; r = 0.99) with the validated LC-MS method used by ASI.

Figure 2. Passing–Bablok regression (left panel) and Bland–Altman bias estimation (right panel) plots comparing the combined data for the 7 sites using the MassTrak assay to data obtained with the assay in use at ASI.

Comparison to the RMP

Table 2 lists the mean values for patient pools P-02, P-04, P-06, and P-09 obtained by the MassTrak assay, the value reported by the ASI method, and the value assigned by the RMP. The percentage difference from the ASI method ranged from 0% to 2.6%, and the percentage difference from the RMP ranged from 0.4% to 4.4%, demonstrating excellent agreement with both measurement procedures across the generally accepted therapeutic range for tacrolimus. These data are also presented graphically in Figure 3 as box-and-whisker plots with the measurement from the RMP and its associated measurement uncertainty overlaid.

Table 2. Comparisons of the MassTrak LC-MS method to ASI LC-MS and the RMP.

a Measured values are expressed as the mean (SD) of the mean at the 95% CI (n = 7 sites).
b Between MassTrak LC-MS and ASI LC-MS method: (MassTrak - ASI)/ASI x 100.
c RMP values are expressed as the reference value ± expanded uncertainty of the measurement. Expanded uncertainty includes all aspects of the measurement procedure, including the uncertainty associated with the purity of the standard material used, enabling traceability to the SI and is expressed at the 95% CI.
d Between MassTrak LC-MS and the RMP: (MassTrak - RMP)/RMP x 100.
Figure 3. Box-and-whisker plots for patient pools P-02, P-04, P-06 and P-09. The left boundary of the box represents the 1st quartile, the right boundary represents the 3rd quartile of results and the line intersecting the box represents the median value of results from the seven laboratories. The whiskers represent the lowest and highest value returned by any laboratory. For comparison, the reference values (solid line) and associated measurement uncertainties (dashed lines) for the RMP are overlaid.

Conclusion

Laboratory developed mass spectrometry assays lack standardization, especially in calibrator value assignment, which contributes to greater interlaboratory imprecision. In this study, we used the MassTrak Immunosuppressants LC-MS assay for tacrolimus TDM, a common LC-MS instrument platform (the ACQUITY TQD), and a proficiency testing survey of laboratories using this assay, to assess whether interlaboratory imprecision could be improved through standardization of LC-MS analysis. Further, we compared the results obtained using this test system to a reference measurement procedure for tacrolimus.

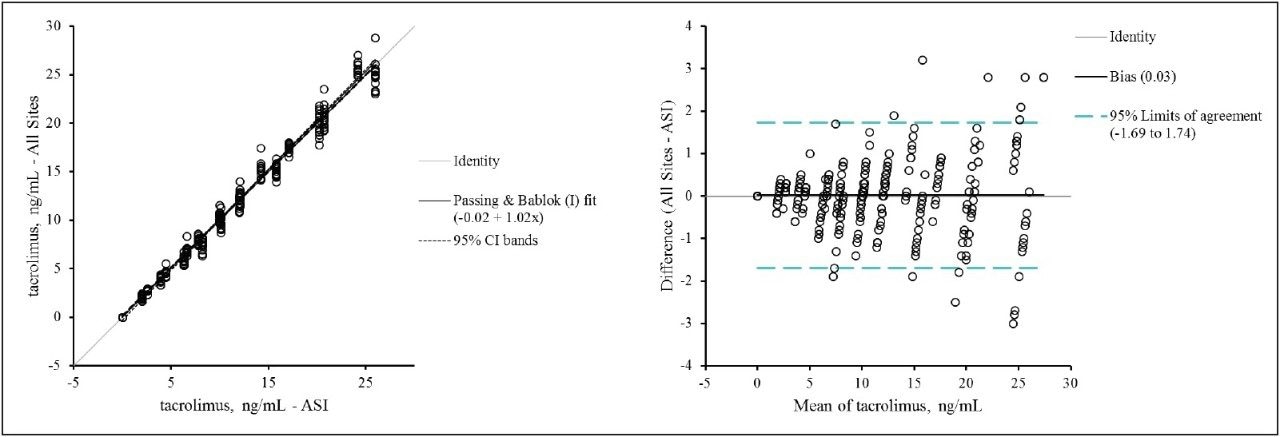
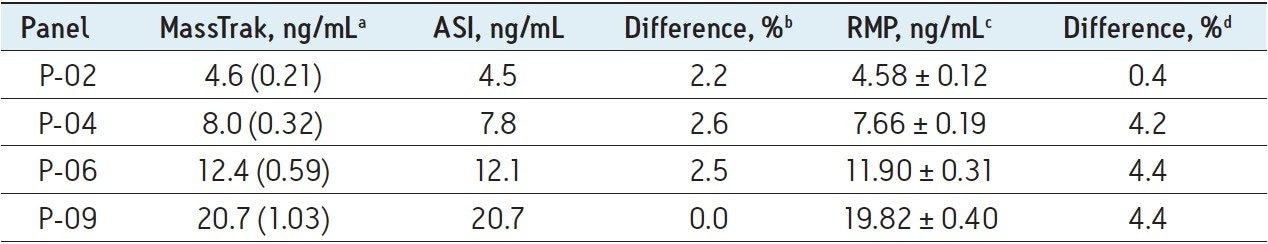
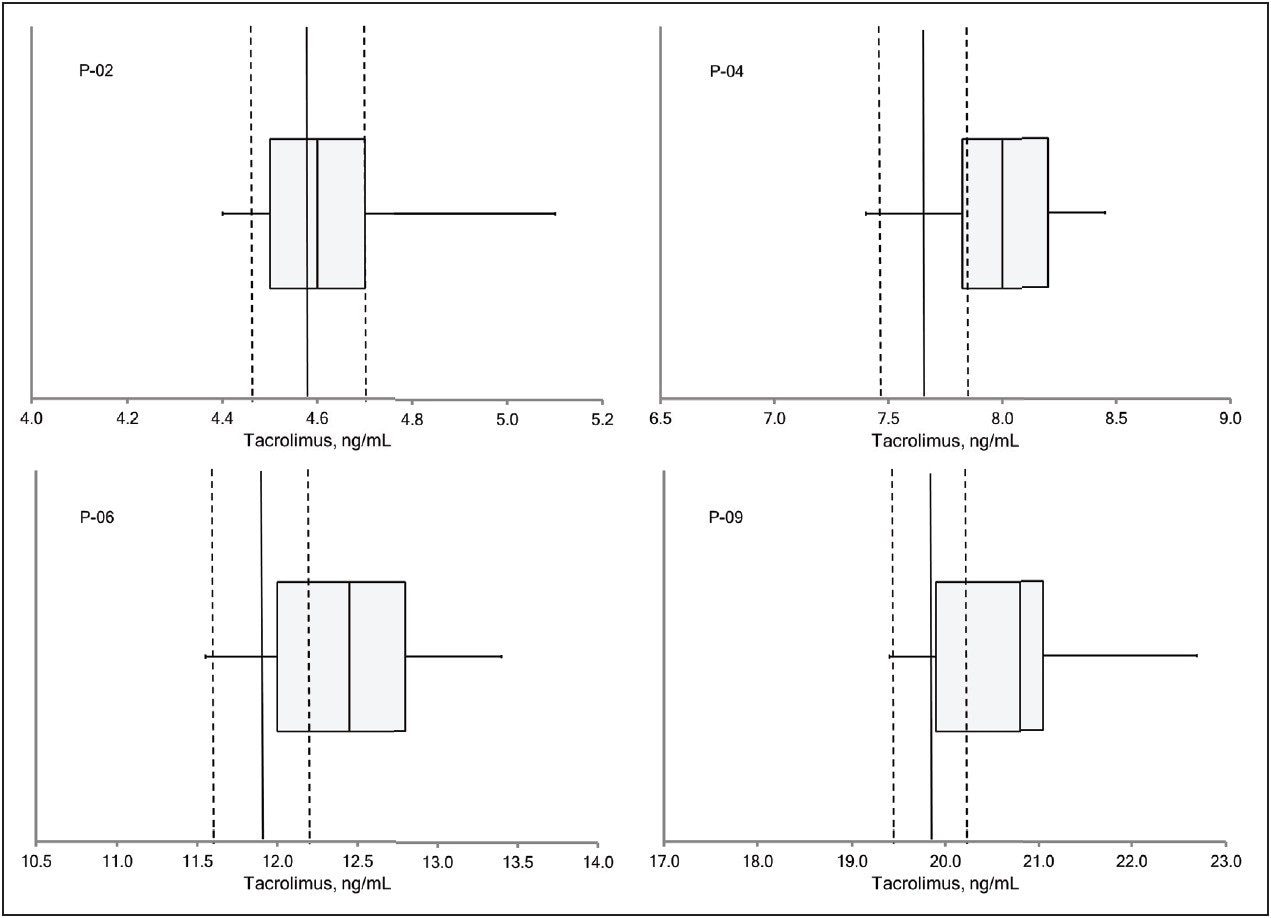
The results of our study demonstrate that the standardization of key analytical variables (calibration materials, sample pretreatment protocols, and chromatography) in the LC-MS analysis of tacrolimus yields highly reproducible tacrolimus measurements across laboratories. This standardization was achieved through the use of the MassTrak Immunosuppressants Kit on a common LC-MS instrument platform. In addition, the MassTrak Immunosuppressants Kit for tacrolimus demonstrated excellent agreement with both a higher-order measurement procedure (ASI) and a reference measurement procedure having a very small measurement uncertainty (LGC). The technique has also been shown to be free from the many factors that negatively impact commercially available immunoassays, namely interference from tacrolimus metabolites,5 hematocrit and serum albumin,6-8 and heterophilic antibodies.9

In summary, while current laboratory developed LC-MS assays may lack optimal interlaboratory accuracy and imprecision, our study demonstrates that improved interlaboratory accuracy and imprecision can be achieved through standardization of the LC-MS analysis with a commercially available LC-MS assay and platform. This level of standardization represents a major improvement over both immunoassays and laboratory-developed LC-MS tests for tacrolimus therapeutic drug monitoring.

References

  1. Wallemacq P, Armstrong VW, Brunet M, Haufroid V, Holt DW, Johnson A, et al. Opportunities to optimize tacrolimus therapy in solid organ transplantation: report of the European consensus conference. Ther Drug Monit 2009;31:139-52.
  2. Bouamar R, Shuker N, Hesselink DA, Weimar W, Ekberg H, Kaplan B, et al. Tacrolimus predose concentrations do not predict the risk of acute rejection after renal transplantation: a pooled analysis from three randomizedcontrolled clinical trials. Am J Transplant 2013;13:1253-61.
  3. Levine DM, Maine GT, Armbruster DA, Mussell C, Buchholz C, O’Connor G, et al. The need for standardization of tacrolimus assays. Clin Chem 2011;57:1739-47.
  4. Napoli KL, Hammett-Stabler C, Taylor PJ, Lowe W, Franklin ME, Morris MR, Cooper DP. Multicenter evaluation of a commercial kit for tacrolimus determination by LC-MS/MS. Clin Biochem 2010;43:910-20. 
  5. Staatz CE, Taylor PJ, Tett SE. Comparison of ELISA and an LC-MS/MS method for measuring tacrolimus concentrations and making dosage decisions in transplant recipients. Ther Drug Monit 2002;24:607-15.
  6. Napoli KL. Is microparticle enzyme-linked immunoassay (MEIA) reliable for use in tacrolimus TDM? Comparison of MEIA to liquid chromatography with mass spectrometric detection using longitudinal trough samples from transplant recipients. Ther Drug Monit 2006;28:491-504.
  7. Brown NW, Gonde CE, Adams JE, Tredger JM. Low hematocrit and serum albumin concentrations underlie the overestimation of tacrolimus concentrations by microparticle enzyme immunoassay versus liquid chromatography-tandem mass spectrometry. Clin Chem 2005;51:586-92.
  8. Taylor PJ, Morris RG. Tacrolimus measurement by microparticle enzyme immunoassay II [Editorial]. Ther Drug Monit 2003;25:259-60.
  9. Altinier S, Varagnolo M, Zaninotto M, Boccagni P, Plebani M. Heterophilic antibody interference in a non-endogenous molecule assay: an apparent elevation in the tacrolimus concentration. Clin Chim Acta 2009;402:193-5.

Featured Products

720004949, February 2014

맨 위로 돌아가기 맨 위로 돌아가기