• 응용 자료

Determination of Triphenylmethane Dyes and their Metabolites in Shrimp Using QuEChERS Extraction and the ACQUITY UPLC H-Class System with Xevo TQD

Determination of Triphenylmethane Dyes and their Metabolites in Shrimp Using QuEChERS Extraction and the ACQUITY UPLC H-Class System with Xevo TQD

  • Elizabeth Brady
  • Jennifer A. Burgess
  • Waters Corporation

Abstract

The practice of farming aquatic species has seen significant growth as certain areas of the world’s fish stock become overexploited. One of the main challenges in the aquaculture industry is the control of infectious diseases.

Due to their efficacy and low cost, triphenylmethane (TPM) dyes including malachite green (MG), crystal violet (CV), and brilliant green (BG) have been implemented to combat this problem. Originally used as textile and paper dyes, they were introduced to aquaculture in 1933 as antibacterial, antifungal, and antiparasitic agents.

Both MG and CV are easily absorbed and known to metabolize to the equivalent, colorless leuco-forms, leucomalachite green (LMG) and leucocrystal violet (LCV), which are also mutagenic.

These compounds accumulate in fish and when this contaminated seafood is consumed by humans it poses a potential health risk. In addition to the toxic effects demonstrated in animal studies, these dyes have not been registered as veterinary drugs and have been banned for use in aquaculture by many countries.

In this application note, we report a highly sensitive and efficient LC-MS/MS method for simultaneously analyzing triphenylmethane (TPM) dyes in shrimp.

Benefits

  • Simultaneous analysis of triphenylmethane dyes in aquaculture products using the ACQUITY UPLC H-Class System and Xevo TQD
  • A modified QuEChERS sample preparation procedure provides a fast and efficient method for accurately analyzing seafood matrices resulting in little to no matrix effects.

Introduction

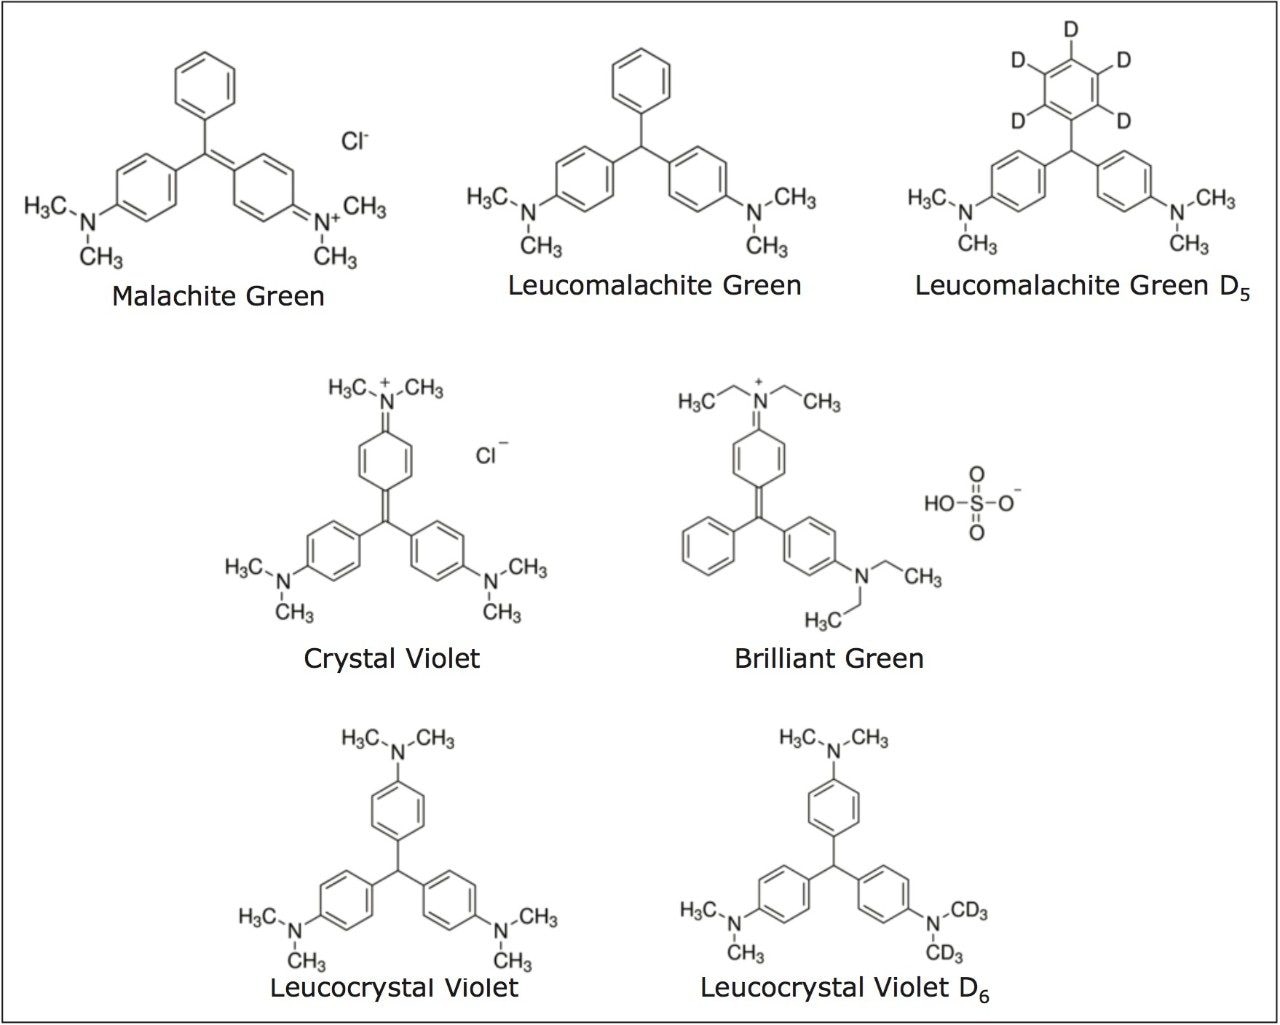
Motivated by the various potential health benefits, global consumption of  seafood continues to increase. In order to meet this demand, the practice of farming aquatic species has seen significant growth as certain areas of the world’s fish stock become overexploited. One of the main challenges in the aquaculture industry is the control of infectious diseases. Due to their efficacy and low cost, triphenylmethane (TPM) dyes including malachite green (MG), crystal violet (CV), and brilliant green (BG) have been implemented to combat this problem. Originally used as textile and paper dyes, they were introduced to aquaculture  in 1933 as antibacterial, antifungal, and antiparasitic agents.1 Both MG and CV are easily absorbed and known to metabolize to the equivalent, colorless leuco-forms, leucomalachite green (LMG) and leucocrystal violet (LCV), which are also mutagenic. 

These compounds accumulate in fish and when this contaminated seafood is consumed by humans it poses a potential health risk. In addition to the toxic effects demonstrated in animal studies, these dyes have not been registered as veterinary drugs and have been banned for use in aquaculture by many countries. Despite these bans, the frequent occurrence of TPM dye residue in seafood products has resulted in emergency measures to test imports, import bans, and product recalls. In the United States MG and CV are monitored to a detection limit of 1 µg/kg, whereas the EU has implemented a minimum required performance limit (MRPL) for the sum of MG and LMG of 2 µg/kg.2,3 Sensitive and selective methods are needed to monitor the presence of TPM dyes in aquaculture products as an important means of monitoring the safety of seafood and managing  global health risks.

Preparation for the simultaneous analysis of TPM dyes in aquaculture samples typically includes aqueous or organic solvent extractions and several cleanup steps including solid phase extractions. These methods, however, can be tedious, time consuming and costly. To address these concerns, a modified QuEChERS technique was employed for preparation of shrimp.4

Experimental

UPLC conditions

UPLC system:

ACQUITY UPLC H-Class

Mobile phase A:

Water + 20 mmol ammonium acetate adjusted to pH 4 with acetic acid

Mobile phase B:

Acetonitrile

Column:

ACQUITY UPLC BEH C18 2.1 x 100 mm, 1.7 μm

Column temp.:

40 °C

Injection volume:

5 μL

Flow rate:

0.3 mL/min

Total run time:

6 min

Gradient

Time

%A

%B

Initial

70

30

0.25

50

50

0.67

5

95

2.67

5

95

2.68

70

30

6.00

70

30

MS conditions

MS system:

Xevo TQD

Ionization mode:

ES+

Capillary voltage:

2.5 kV

Source temp.:

150 °C

Desolvation temp.:

400 °C

Desolvation gas:

780 L/hr

Acquisition:

Multiple Reaction Monitoring (MRM)

The most commonly employed form of analysis for TPM dyes in seafood is high performance liquid chromatography (HPLC) coupled to an optical detector or mass spectrometer. The use of mass spectrometry avoids the need for a post column oxidation step which is necessary with UV/Vis detection to convert leuco forms to their parent compounds for simultaneous analysis. LC-MS/MS is now more commonly used for the detection, identification, and quantification of TPM dyes and residues as it meets the EU Commission Decision 657/2002/EC.

In this application note, we report a highly sensitive and efficient LC-MS/MS method for simultaneously analyzing MG, LMG, CV, LCV, and BG using the Waters ACQUITY UPLC H-Class System with the Xevo TQD.

Sample description

Shelled, headless tiger shrimp were homogenized in a blender and 10 g of homogenized shrimp were weighed out. 10 mL of acetonitrile with 1% acetic acid were added and the sample was shaken for 1 minute. A Waters DisQuE QuEChERS Pouch (p/n 186006812) containing 1.5 g sodium acetate and 6 g magnesium sulfate was added and shaken for 30 seconds. The mixture was placed in an ultrasonic bath for 12 minutes and centrifuged at 4000 rpm for 10 minutes at  15 °C. The supernatant was transferred to a 15-mL DisQuE QuEChERS PSA Tube (p/n 186004833) containing 900 mg magnesium sulfate, 150 mg primary secondary amine, and C18. The sample was shaken for 1 minute and centrifuged at 4000 rpm for 5 minutes at 15 °C. 

For pre spiked samples: 10 g of homogenized shrimp were spiked with 1 μg/kg of internal standards and 1 ppb of TPM dye mixture. After spiking, the sample was allowed to sit for 10 minutes to let the tissue and dyes interact. The sample preparation procedure described above was then carried out.

For post spiked samples: After the above procedure was performed on the unspiked shrimp samples, the resulting solution was spiked with the appropriate concentration of TPM dyes and 1 μg/kg of internal standards. Matrix matched calibration standards ranged from 0.05 to 40 ppb.

Solvent calibration standards were created by making dilutions in acetonitrile from 0.05 to 40 ppb.

Acquisition and processing methods

For each analyte, two MRM transitions were acquired. The most intense transition was used for quantification and the second transition was used for identification. Two deuterated internal standards, Leuomalachite Green D5 (LMG-D5) and Leucocrystal Violet D6 (LCV-D6) were incorporated into the analysis to evaluate their application as internal standards. The retention times, MRM transitions, cone voltages and collision energies of all analytes are given in Table 1. Chemical structures of all analytes are displayed in Figure 1. TargetLynx Software was used for all processing.

Table 1. List of triphenylmethane dyes, retention times, MRM transitions, cone voltages, and collision energies.
Figure 1. Chemical structures of the analytes.

Results and Discussion

Linearity and matrix effects

The chromatograms of each analyte at 1 µg/kg in a shrimp matrix shown in Figure 2 display the sensitivity obtained at the detection level monitored in the US. Excellent linearity was achieved for all compounds with all R2 values greater than 0.998 as shown in Figure 3. The limits of the curves are ten to twenty times lower than the FDA limit of 1 µg/kg. This was achieved without a concentration step in the sample preparation step demonstrating the sensitivity of this method. The matrix effects were calculated by comparing the slope of the solvent calibration curves to those of the matrix matched calibration curves. The results are shown in Table 2.

Figure 2. Chromatograms showing the primary MRM transitions for the three TPM dyes, two metabolites, and two internal standards at 1 µg/kg in shrimp matrix.
Table 2. Matrix effects in shrimp.

A slope ratio value of 1 indicates no matrix effect, a value >1 indicates signal enhancement, and a value <1 indicates an effect of ion suppression. Most of the dyes showed little to no matrix effect while LCV showed a slight signal enhancement. This demonstrates the effectiveness of the QuEChERS sample preparation for the analysis of TPM dyes in seafood.

Figure 3. Matrix matched calibration curves for the five TPM dyes. Leucomalachite Green and Leucocrystal Violet are corrected with deuterated internal standards. Ranges for MG and CV span from 0.1 to 40 ppb, while BG, LCV, and LMG span from 0.05 to 40 ppb.

Recovery

Published articles often use internal standards to correct for losses in the sample preparation and ensure reproducible results. To evaluate the use of deuterated leuco forms as internal standards, three separate shrimp samples were spiked with 1 μg/kg LCV and LMG and 1 μg/kg of the internal standards LCV-D6 and LMG-D5. These samples were subjected to the QuEChERS sample preparation procedure described above. 

Concentrations were calculated using the matrix matched calibration curves. The average recovery for LCV with internal standard correction was 104% and 106% for LMG. The average recoveries for MG, CV, and BG without internal standard correction were 33%, 83%, and 54% respectively. It is recommended that internal standards of the parent TPM dyes also be employed for  laboratories planning to use this methodology.6 Factors that affect recovery in sample preparation of the triphenylmethane dyes are described in detail by  López-Gutiérrez et al.3 Even with recoveries below 50%, the sensitivity of modern LC-MS/MS systems enables the detection of these compounds well below the required limits and allows for the use of generic but less labor-intensive sample preparation techniques such as QuEChERS. 

Conclusion

A fast, sensitive method combined with simple sample preparation has been demonstrated for the analysis of TPM dyes in seafood. The analysis produced excellent linearity for each compound and minimal to no matrix effects. 

The ACQUITY H-Class System with the Xevo TQD provide sensitivity levels far below the required performance limits set by the FDA and the EU for TPM dyes in aquaculture, allowing analysts to efficiently monitor the safety and quality of seafood products. The enhanced MS sensitivity of the Xevo TQD removes the need for time-consuming concentration steps during sample preparation, which results in increased sample throughput and improved lab efficiency.

References

  1. A A Bergwerff, P Scherpenisse. J Chromatogr  B: Anal Technol Biomed Life Sci. 788: 351-359, 2003.
  2. European Commission Decision 2002/657/EC of 12 August 2002 implementing Council Directive 96/23/EC concerning the performance of analytical methods and the interpretation of results, as amended by Decision 2003/181/EC(4), (Official Journal of the European Communities L 221, 17.08.2002, p. 8–36).
  3. Lopez-Gutierrez et al. Anal Methods. 5: 3434–3449, 2013.
  4. J C Hashimoto et al. J AOAC Int. 95: 913–922, 2012.
  5. M Kaplan et al. J Chromatogr A. 1349: 37–43, 2014.
  6. Hurtad-Pessel et al. J AOAC Int. 96: 1152–1157, 2013.

720005307, February 2015

맨 위로 돌아가기 맨 위로 돌아가기