• 응용 자료

Automating Metabolic Flux Analysis with Symphony and Polly

Automating Metabolic Flux Analysis with Symphony and Polly

  • David Heywood
  • Hans Vissers
  • Abhishek Jha
  • Raghav Sehgal
  • Kailash Yadav
  • Sahil Kumar
  • Waters Corporation
  • Elucidata

For research use only. Not for use in diagnostic procedures.

Abstract

This application brief demonstrates to identify pathway dynamics, the direction, and flow of metabolites, using stable isotope tracing to reveal biological insight that is critical in understanding metabolism.

Benefits

Increase throughput and reproducibility in metabolomics and complex metabolic flux studies with automation of the experimental workflow from data collection to data review using Symphony Data Pipeline and Polly informatics.

Introduction

Data generated for relative metabolic flux analysis is complex, often consisting of multiple experimental conditions and time points along with the relevant isotopologue/isotopomer information for each metabolite of interest. Processing these data files and plotting of the data to visualize the incorporation of the isotope label is a time consuming task often requiring multiple manual data processing steps and utilization of various software.

Results and Discussion

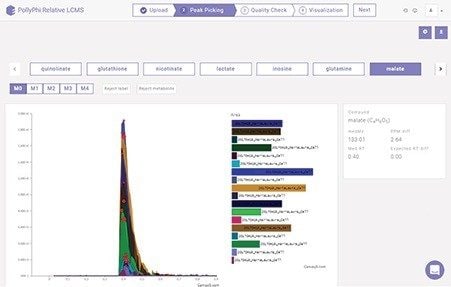
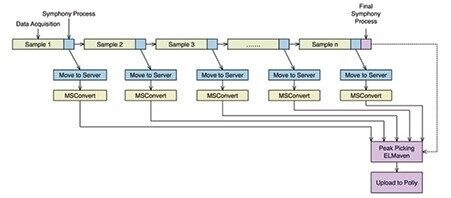
Symphony Data Pipeline is specifically designed to form custom chains of data processing steps in order to improve efficiency in complex LC-MS analysis applications. In this technology brief, we show how Symphony can be coupled to PollyPhi, a software tool specifically designed for processing and analyzing isotope labelled metabolic flux data. On a per sample basis, the high resolution LC-MS data file is converted, peak integration performed and uploaded to Polly, a cloud-based platform, where the PollyPhi workflow can be utilized to measure and visualize isotopic incorporation for a user-defined set of metabolites. The simplicity and customizability of this automated workflow package will allow for iterative and routine analysis of stable isotope labeling experiments in any metabolism lab.

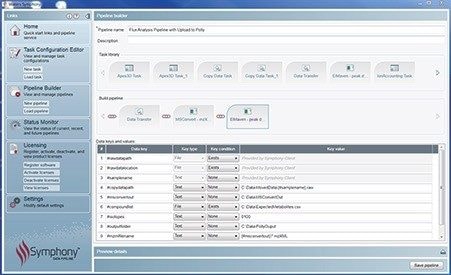
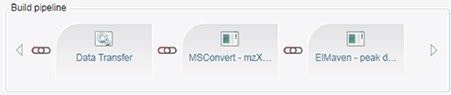
Customized informatics tools are required to streamline LC-MS based fluxomics studies that allow the user to detect and quantify the incorporation of isotopically labeled atoms with the necessary level of detail (e.g. natural abundance correction, fractional enrichment computations, error calculations, cohort designation, etc.). Figures 1 and 2 show the software user interface and basic components of a Symphony pipeline, a client/server application that is triggered by the MassLynx data acquisition system. A server request is executed, which consists of a list of tasks that are executed based on data input. Tasks are requests that cover the execution of command line interface driven modules (i.e. exe, bat, script). Symphony provides users with the ability to configure and combine a sequence of tasks as well as set up so-called pipeline definition files. The pipeline applied here consists of three basic components: Data transfer from the acquisition to a storage server or processing PC, conversion of the native MassLynx format into mzXML open source standard by MSconvert, and import of the converted data by ElMaven and Polly for peak detection, curation, natural abundance correction, and results visualization.

Figure 1. Symphony Pipeline Builder interface showing the task library and the metabolic flux analysis pipeline with key user parameters being passed to the tasks.
Figure 2. Symphony pipeline chains Robocopy data transfer followed by MSconvert, raw to mzXML data conversion and ElMaven peak detection, integration, annotation and upload.

Two software tools specifically designed for metabolism flux studies were applied; ElMaven for peak detection, integration, and annotation, and PollyPhi for analysis and visualization of the results. Figures 3 and 4 highlight some of the features and functionality, showing the peaks detected data and their relative abundances and distribution mapped on a metabolic pathway.

Figure 3. PollyPhi Relative LC-MS showing extracted and integrated ion chromatograms for Glutathione and relative peak areas across samples (color coded by experimental groups).
Figure 4. Pathway mapping and isotopic corrected intensity differences between experimental groups for a selected metabolite in PollyPhi Relative LC-MS.

In total, 100 LC-MS data files were collected to study the metabolic flux in human lung cell lines treated with 13C-glucose. This included all relevant QCs, experimental conditions, positive and negative ionization modes. This reflects a typical study of this type and demonstrates the need for batch data processing and automation. Once moved, converted, and processed a series of cloud based applications can be applied to the project. Typical steps performed in the Polly environment include data quality analysis, isotopic natural abundance correction, and finally visualization of the data mapped to pathways, as shown in Figure 4. Individual metabolites can be reviewed to inspect their extracted ion chromatograms and relative responses across study groups, illustrated in Figure 4 as well.

Conclusion

In this technology brief, we have outlined the application of the Symphony Data Pipeline Software in the automation of data processing for a metabolic flux experiment. Applying Symphony to design and develop a customized workflow can streamline downstream processing and analysis of high resolution accurate mass LC-MS data with customized tools and will allow for iterative and streamlined experimental data generation in labs studying metabolism. Symphony was triggered from the MassLynx sample list to transfer, convert, peak detect, and upload LC-MS data to online tools for data analysis and results interpretation. Symphony initiates the designed pipeline automatically for each data file after the sample acquisition has been completed, removing the need to wait until a complete sample list has been finished, as demonstrated in Figure 5, increasing overall workflow productivity.¹

Figure 5. Schematic flow diagram showing the sequence of the Symphony tasks.

References

  1. Improved Efficiency of Proteomics Data Processing Using Symphony Data Pipeline Software, Waters Corporation, 720005784EN. 2016.

720006380, October 2018

맨 위로 돌아가기 맨 위로 돌아가기