Aiding the Exploration of Multiple-Sample Imaging Experiments by Providing Native Data Support for Waters Mass Spectrometry Imaging Data in the SCiLS Lab Software Platform
For research use only. Not for use in diagnostic procedures.
Abstract
As the use of Mass Spectrometry Imaging (MSI) continues to expand in its range of applications the studies in which the technology is applied are becoming more thoroughly designed. The incorporation of multiple replicates, time points, and controls is commonplace. The challenge then becomes dealing with multiple MSI datasets within the same analytical environment.
As part of a study into the role of hypoxia as a cause of radiotherapy resistance in the treatment of colorectal tumors, a Desorption Electrospray Ionization (DESI) mass spectrometry imaging experiment was carried out on mouse-borne xenografts of HCT116 cell-line. By administering different irradiation regimes, the lipidomic profile of the tissue as a response to treatment was compared.
To most efficiently visualize the data in this study, the data was loaded directly into the SCiLSTM Lab Software using the newly implemented native data support for Waters data. Within this platform, multivariate analyses were carried out to identify molecular species that differed between the treated and untreated xenografts.
Benefits
- Native data support for Waters *.raw data means no need for conversion to *.imzML file format prior to loading data to SCiLS Lab, optimizing the workflow
- SCiLS Lab Software complements Waters High DefinitionTM Software (1.6) with the ability to build and save projects of multiple datasets and has a range of inbuilt statistical tools
- SCiLS Lab Software is currently the only commercial software to have support for 3D re-construction of MSI data (data not shown here)
Introduction
Understanding the role of tumor heterogeneity in relation to resistance to treatment is critical in the improvement of patient outcomes. Low oxygen consumption in cancers, hypoxia, is one of the main reasons for radiotherapy resistance1 and with the oxygen supply to different regions of a tumor being dependent upon a range of factors, though mainly proximity to blood vessels, there may be certain volumes of the tumor that are at a higher risk of being resistant.
For this reason, metabolomic and lipidomic studies of these tissues must take into account this heterogeneity, the most suitable method is to conduct MSI experiments, to map the distribution of these molecules, then to co-register the chemical maps to the histology information derived subsequently by hematoxylin & eosin (H&E) staining the sample and obtaining an optical microscopy image. When included in the full workflow of research tools typically used within these studies, MSI can be powerfully complementarity to immunohistochemical and in situ hybridization approaches to obtain an understanding of the system as a whole.
The tumor tissues from the different treatment conditions are collected, snap frozen then sectioned on a cryo-microtome. These are then analyzed by DESI MS imaging on a Q-Tof Mass Spectrometer to obtain an untargeted molecular map of the tissue. Software such as Waters High Definition ImagingTM (HDITM) can then be used to co-register the mass spectrometry and optical images and visualize how different molecular species have different distributions across the sample. Regions of interest can be drawn, and data is exported for analysis in external statistical packages.
However, when imaging MS experiments move beyond that of a single sample, the difficulty becomes how to effectively compare these data. For software that uses peak picking to present a lightweight representation of the data to the user, there is the necessity as described above to export the data in a format that can be imported into a suitable statistical package. For large studies, each sample must be processed in this manner with care taken to ensure all data is treated equally prior to being exported.
Here we demonstrate that the SCiLS Lab Software provides a solution by allowing multiple data sets to be combined into a single MS imaging project with a common, continuous m/z array, so no prior knowledge of the data is required. The statistical analysis in built into the software allows for biological conclusions to be drawn from the samples under study, with a range of phospholipids shown here to vary with the treatment type.
Results and Discussion
DESI Condition
|
DESI solvent: |
Methanol 95% : Water 5% |
|
DESI solvent flow rate: |
2 µL/min |
|
DESI nebulizing gas pressure: |
4 bar |
|
DESI spray voltage: |
2.5 kV |
|
Imaging pixel size: |
70 µm |
|
Stage speed: |
350 µm/s |
MS Conditions
|
MS system: |
XevoTM G2-XS QTof Quadrupole Time-of-Flight Mass Spectrometry |
|
Ionization mode: |
DESI Negative Ion Mode |
|
Acquisition mode: |
Tof MS |
|
Acquisition range: |
50–1200 Da |
|
MS scan rate: |
5 Hz |
|
Cone voltage: |
40 V |
Data Management
|
MS software: |
MassLynxTM v4.2 |
|
Imaging and informatics: |
Waters High Definition Imaging v1.6, SCiLS Lab 2021c (v9.02) |
|
Processing PC specifications: |
Processor: IntelTM Xeon CPU E5-2690 v4 Installed RAM: 128 GB OS: WindowsTM 10 Pro GPU: NVIDIA QuadroTM K620 |
|
Data size: |
Total 18 GB raw data |
|
Import time: |
1 hour 18 minutes |
Sample information
For this study three treatment conditions were studied for the colorectal cancer tumor model grown from HCT-116 cell line implantation. These conditions represent a no-treatment sample, a mid-treatment where 2x 2Gy irradiation was administered with collection on day 8, and a post-treatment where 2 xGy irradiation was administered with collection being on five days following the final treatment.
The snap frozen xenograft samples and sections prepared on a cryo-microtome for i) DESI MS imaging and ii) Immunofluorescence staining for hypoxia with pimonidazole; both sections being at 12 µm thickness. Following DESI MS analysis, the sections were stained with hematoxylin and eosin and images collected with a 3D HISTECH PANNORAMIC™-250 microscope slide-scanner.
To understand the effect of the different treatments on the biochemistry of the xenografts the DESI MS, optical and immunofluorescence data from all three samples was combined in a single SCiLS Lab project for statistical analysis.
Creating the SCiLS Lab project
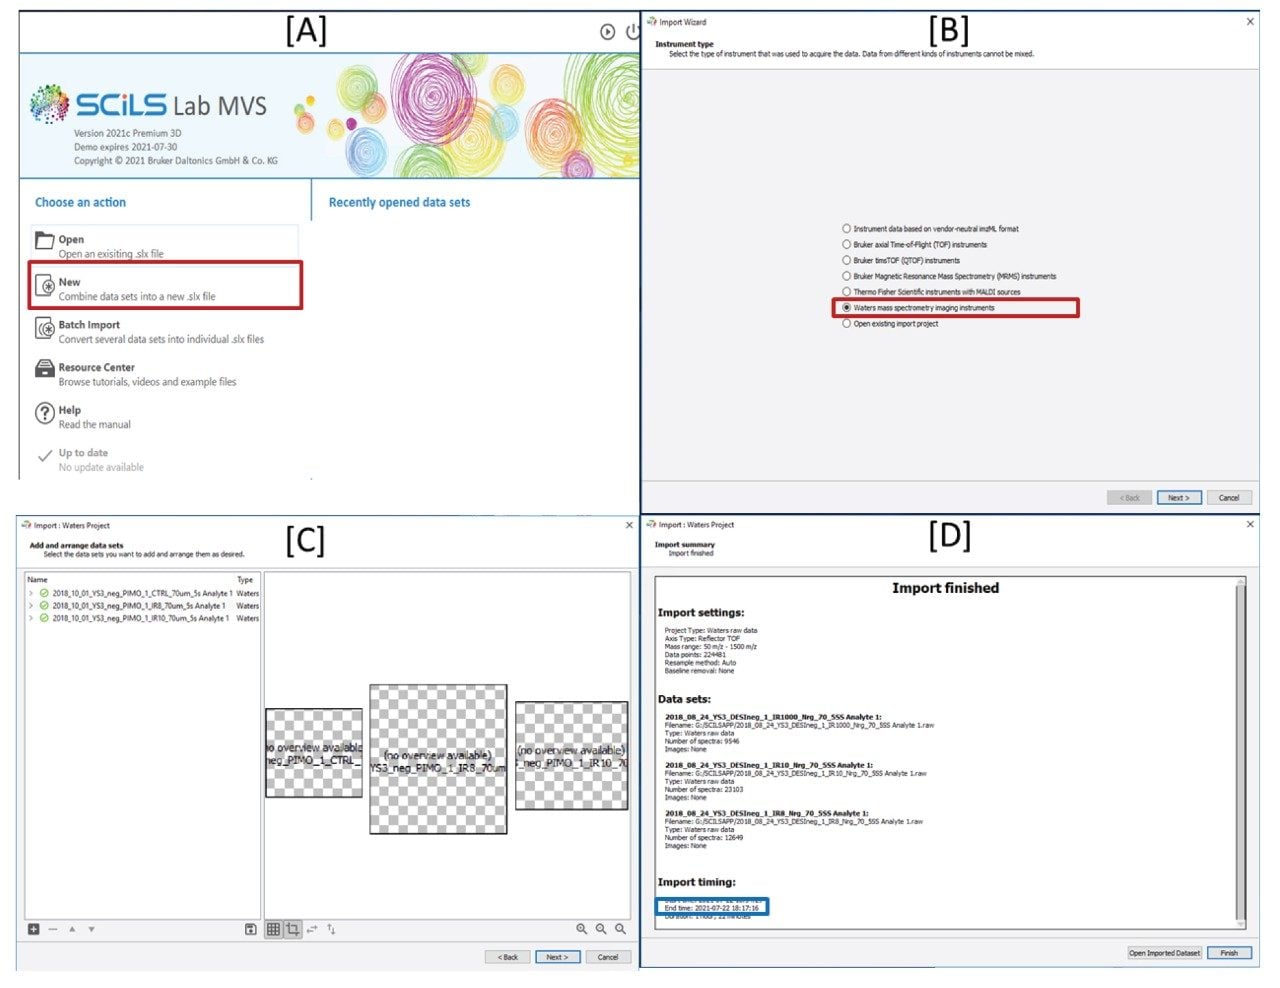
The three MS imaging files total 18 GB of data, to import this into the SCiLS Lab Software, the workflow outlined in Figure 1 was followed. First (Figure 1A) the ‘New’ option is selected, which then allows Waters MSI Instruments to be chosen from a supported file type menu (Figure 1B). On the next screen one or more raw data files can be selected (Figure 1C-left) and arranged within the display window (Figure 1C-right). Once all the files are selected and arranged correctly optional processing steps, m/z array resampling (default selected) and baseline subtraction (none) are offered prior to the data being imported. After the import, a report screen is displayed (Figure 1D). For the three samples here the total import time was 1 hour 18 minutes as shown.
A particular strength of the SCiLS Platform is that all process, co-registrations, and analyses that are done on a data set are stored within the project. There is then the possibility to switch between projects without losing progress made.
Co-registering the H&E and MS images
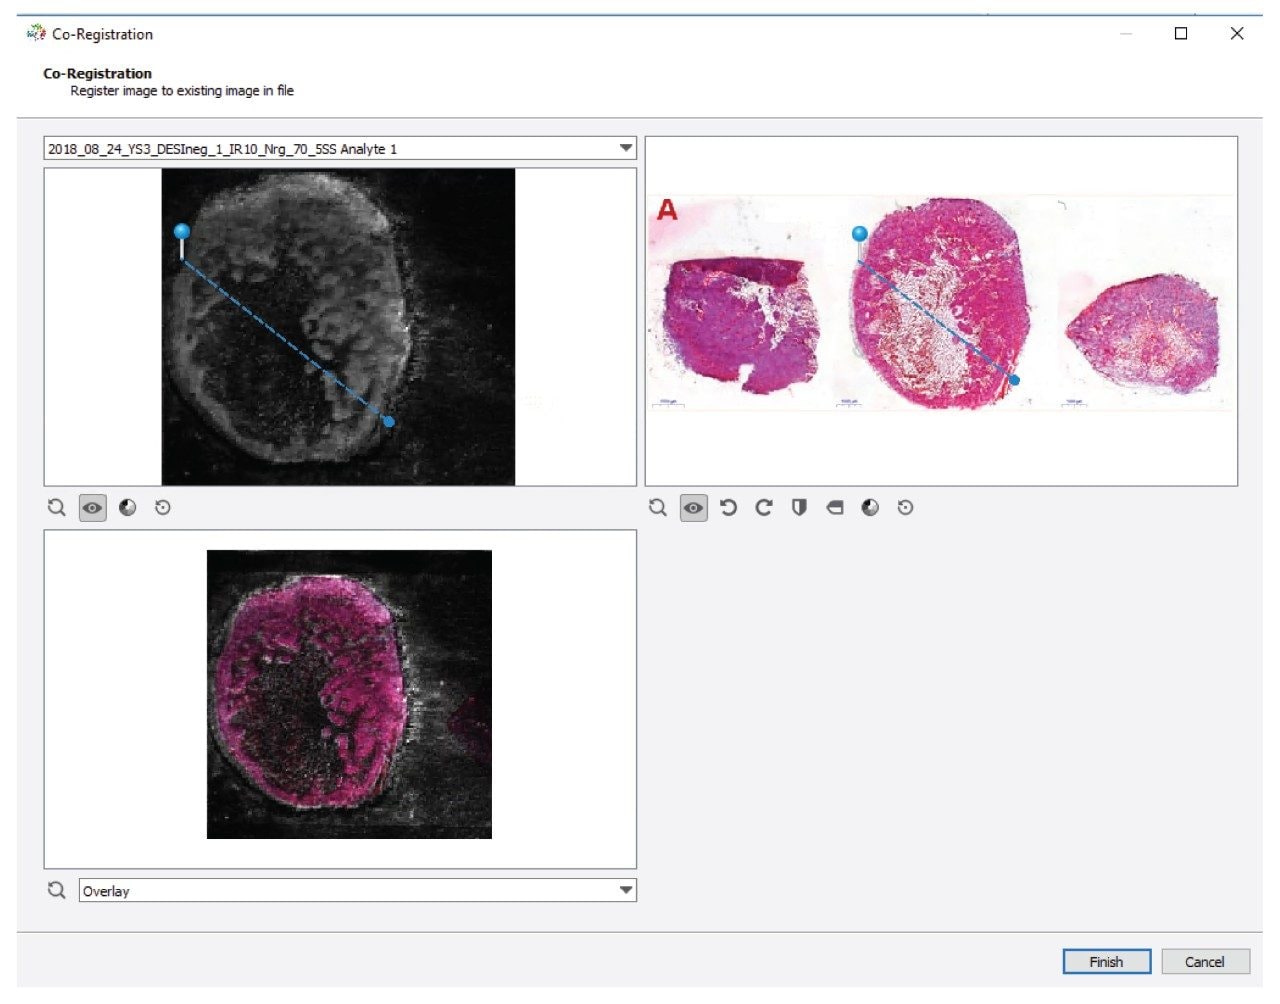
In order to overlay the MS and optical image this is done on a sample-by-sample basis via: File>Import>Optical Image.
Once the optical image is selected, an alignment window is opened as shown in Figure 2. By selecting the correct MS data from the drop-down list, a two-point alignment method is implemented by identifying the same points on the MS image (top left) with those on the optical image top right. The resulting co-registration can be assessed in the bottom left pane and viewed as one of three options for best clarity [multiply, difference, overlay].
Compare ion distributions
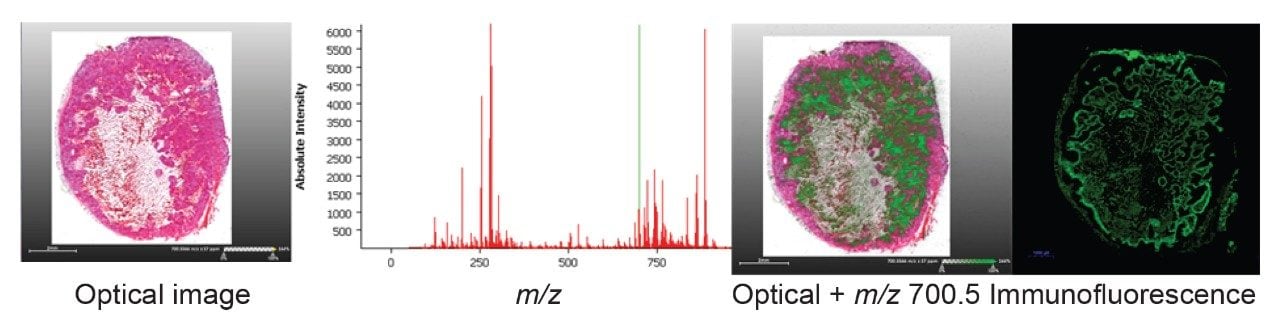
With the data and optical images co-registered, selecting an ion from the spectrum view will allow it to be visualized superimposed over the optical image. Figure 3 shows firstly the optical image, then upon selecting a peak (m/z 700.5) in this case, that ion map is projected onto the optical image. From the distribution of this ion we can see that it is in good agreement with the immunofluorescent staining, suggesting that this phospholipid species is more abundant within hypoxic regions of the tumor.
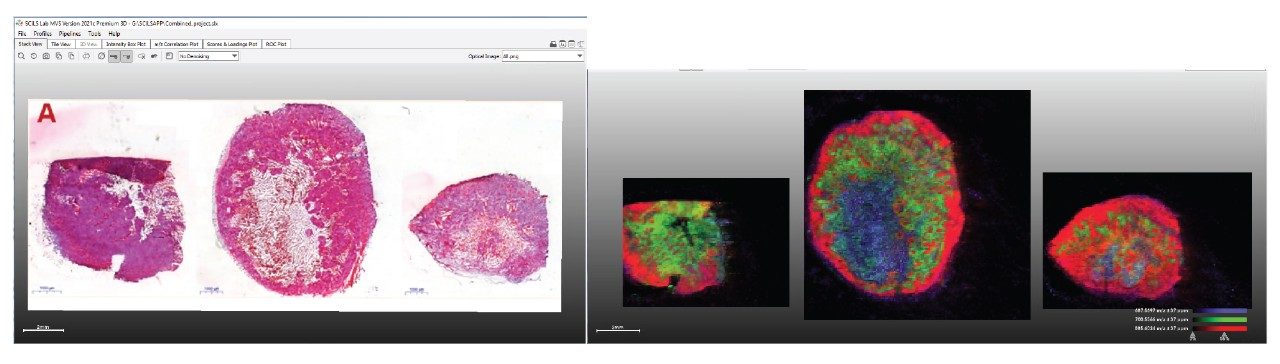
As the SCiLS Lab Software imports all the data from the multiple analysis into a single project, the same ion map selection approach can be done for an ion species and visualized across all samples in the project. In Figure 4, a red-green-blue overlay of three lipid species (m/z 885.6, 700.5, and 687.6, respectively) is shown where the same ions describe the same tissue types within the different xenograft sections.
Performing multivariate analysis
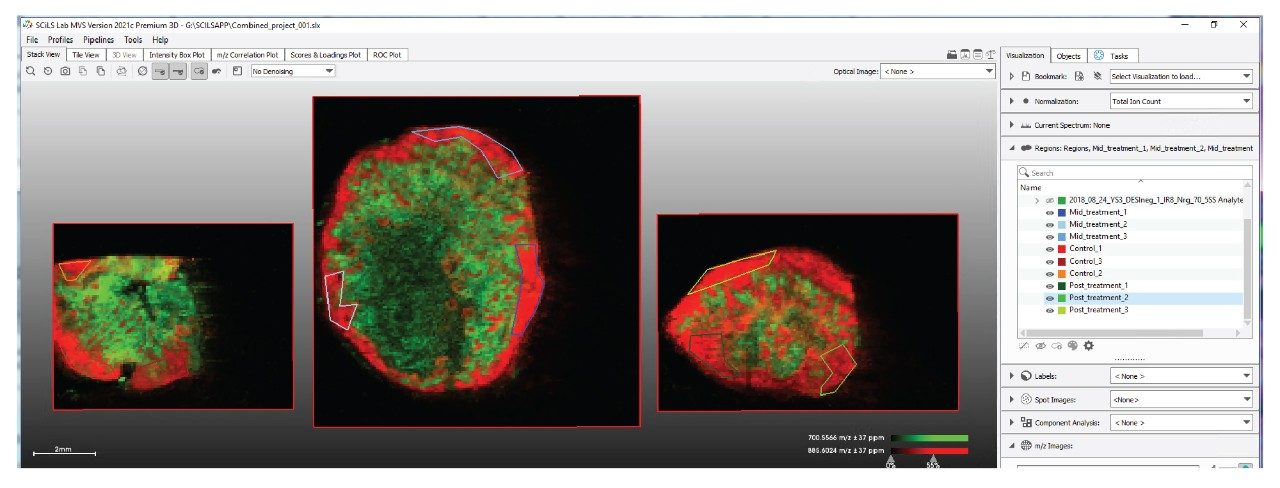
While it is of interest to see that ions selected in Figure 4 map to common tissue types (viable-red, hypoxic-green, necrotic-blue) over all three samples, the aim of this study is to find variations between the different treatment regimes. For this, the tissue of interest is the viable area, and therefore this needs to be selected by the user. In Figure 5 we see three regions of interest are drawn onto the viable tumour regions of the different samples. These are then labelled with their treatment condition in the ‘region’ tab to the right.
The next step is to create a peak list for the analysis to work from in oder to reduce the processing time.
Once the regions have been defined, the peak list made and the data processing settings (image de-noising [no de-noising selected here] and normalization [TIC selected here]), the data analysis can be carried out. SCiLS offers a range of tools for segmentation and statistical analysis. Here we will use a principal component analysis (PCA) to determine if the negative ion DESI Data allows for these three treatment types to be differentiated.
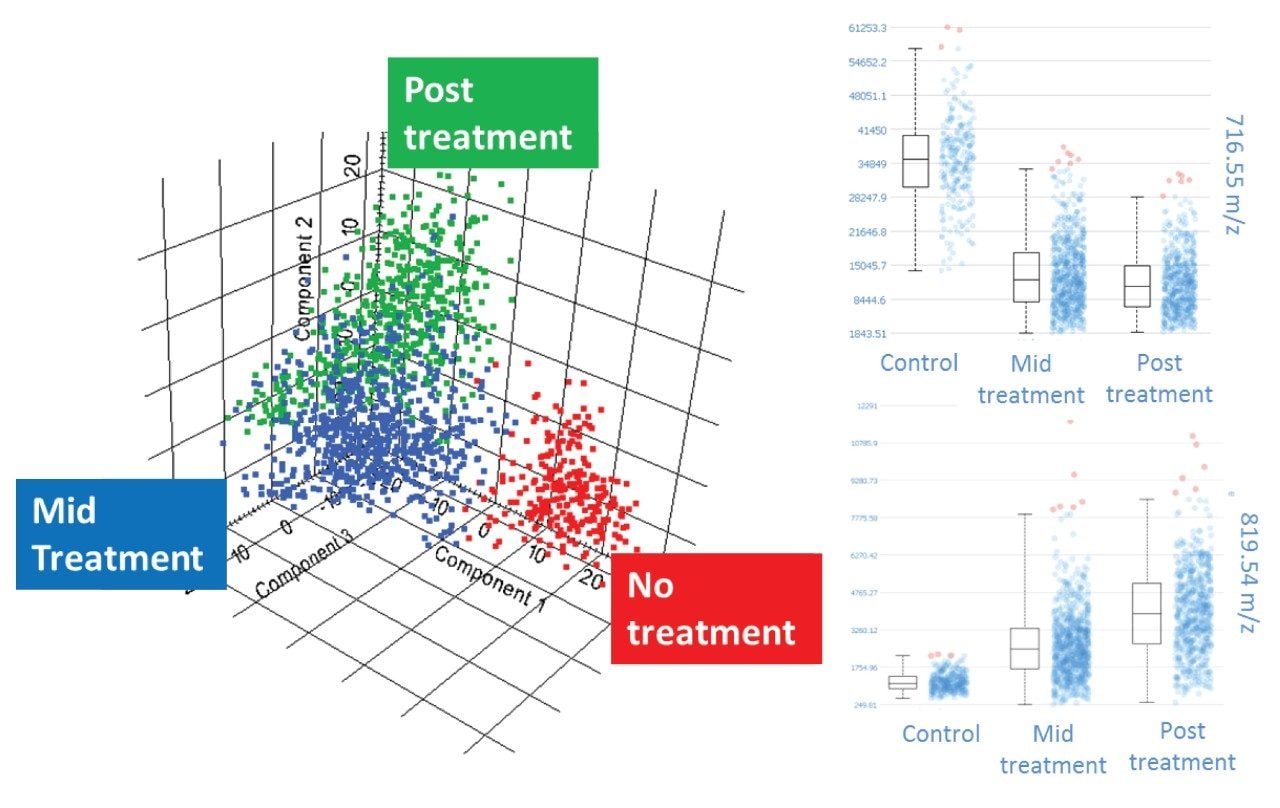
As we can see in Figure 6, the three xenograft classes are clearly separated, with principal component 1 (PC1) differentiating the treated from the un-treated, and PC2 differentiating the mid and post treated. From the loadings plots that accompany the score plot shown here, m/z species that are most significant in describing the variation in the data can be selected, and also from within the SCiLS Lab Software, intensity box plots can be created to demonstrate how these molecular species vary across the different sample types.
Conclusion
The ability to directly read native Waters data formats and create projects with multiple raw datasets combined together makes SCiLSTM Lab a powerful tool for exploring Waters MS imaging data. A selected ion or ions can be quickly displayed over all the samples within the project. For a deeper understanding of the data, multivariate analyses can be conveniently carried out, all from within the same interface. As all the processes that have been applied to the data are stored with the project, the data analysis can be revisited at a later date with no loss of progress.
Acknowledgements
Waters, High Definition, High Definition Imaging, HDI, Xevo and MassLynx are trademarks of Waters Technologies Corporation.
SCiLS™ Lab is a trademark of Bruker Daltonics GmbH & Co. KG
Intel is a trademark of Intel Corporation or its subsidiaries.
Windows is a trademark of Microsoft Corporation or its subsidiaries
NVIDIA Quadro is a trademark of Nvidia Corporation
PANNORAMIC is a trademark of 3DHISTECH.
720007400, October 2021