Sample Description and Pre-treatment
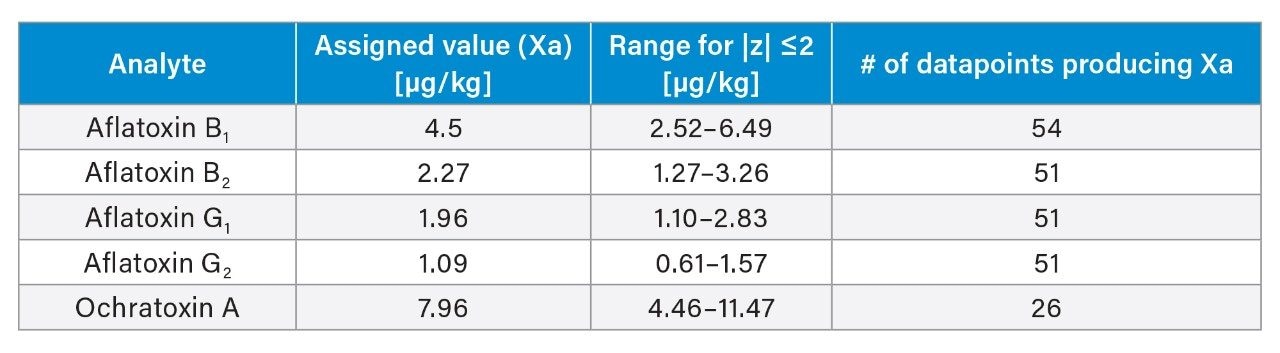
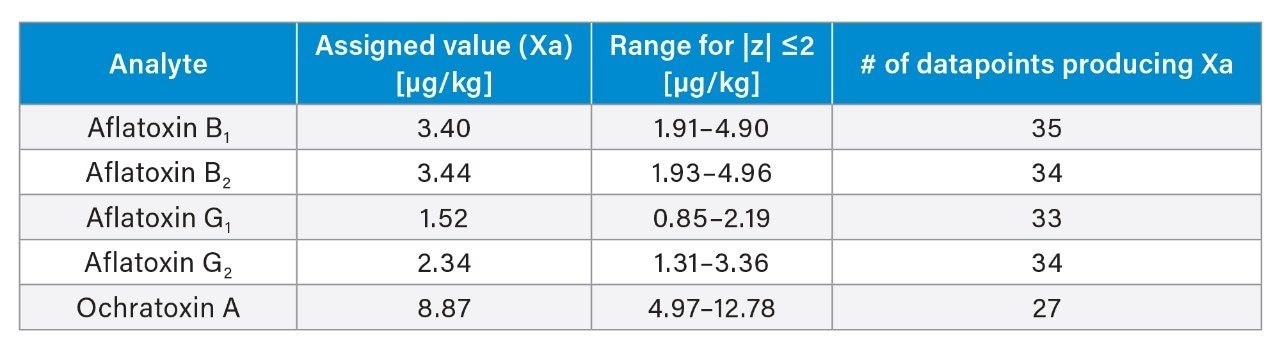
Black peppercorns were purchased at a local market. About 200 g of sample were ground and homogenized using an analytical mill (IKA) prior to extraction. Powdered black pepper reference materials were provided by Fera Science Ltd. (FAPAS T04332QC). The assigned values and range of concentrations of aflatoxins and ochratoxin A in the FAPAS QC material are listed in Appendix A.
Sample Extraction and Cleanup
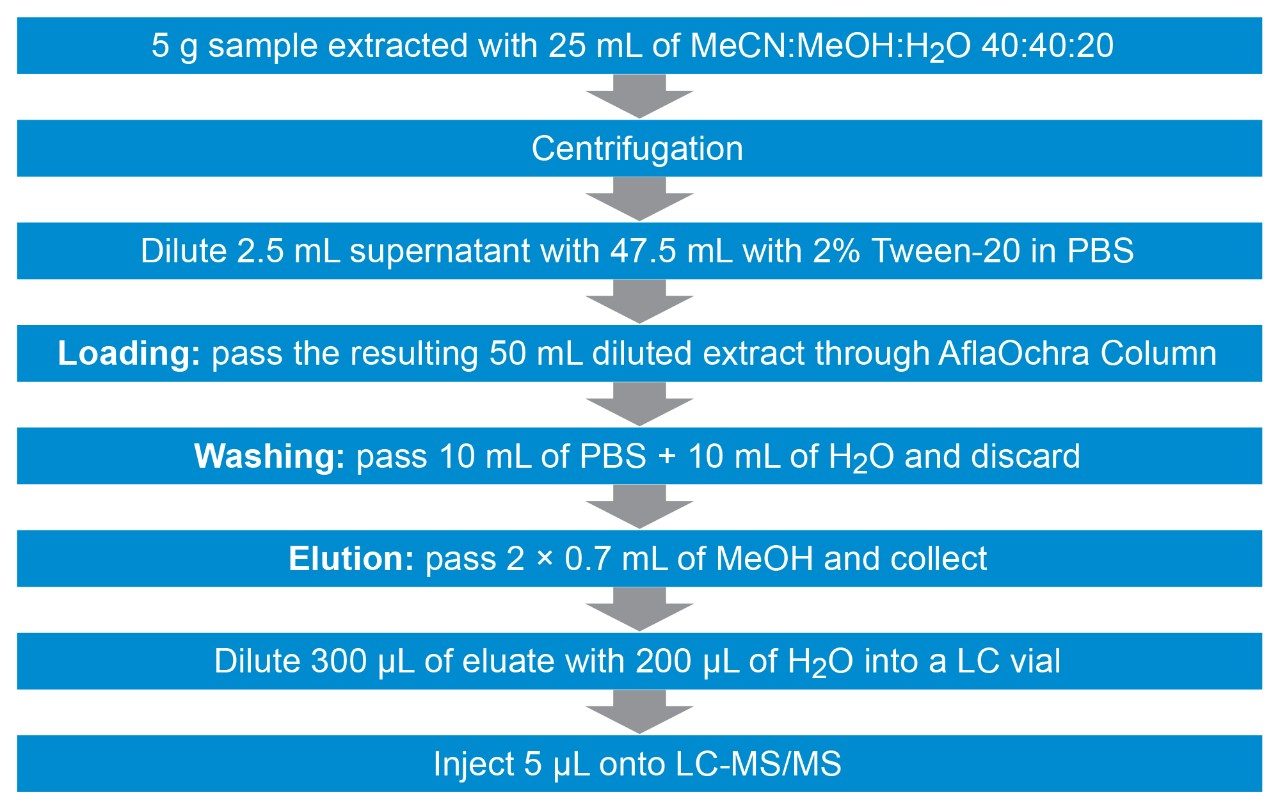
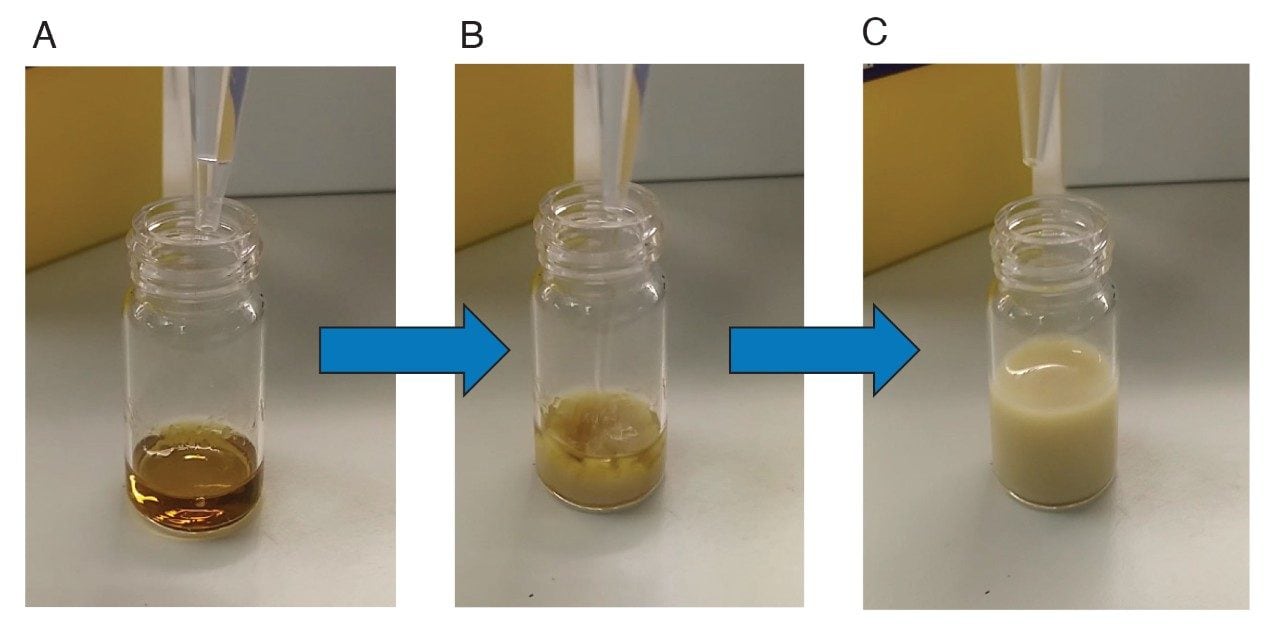
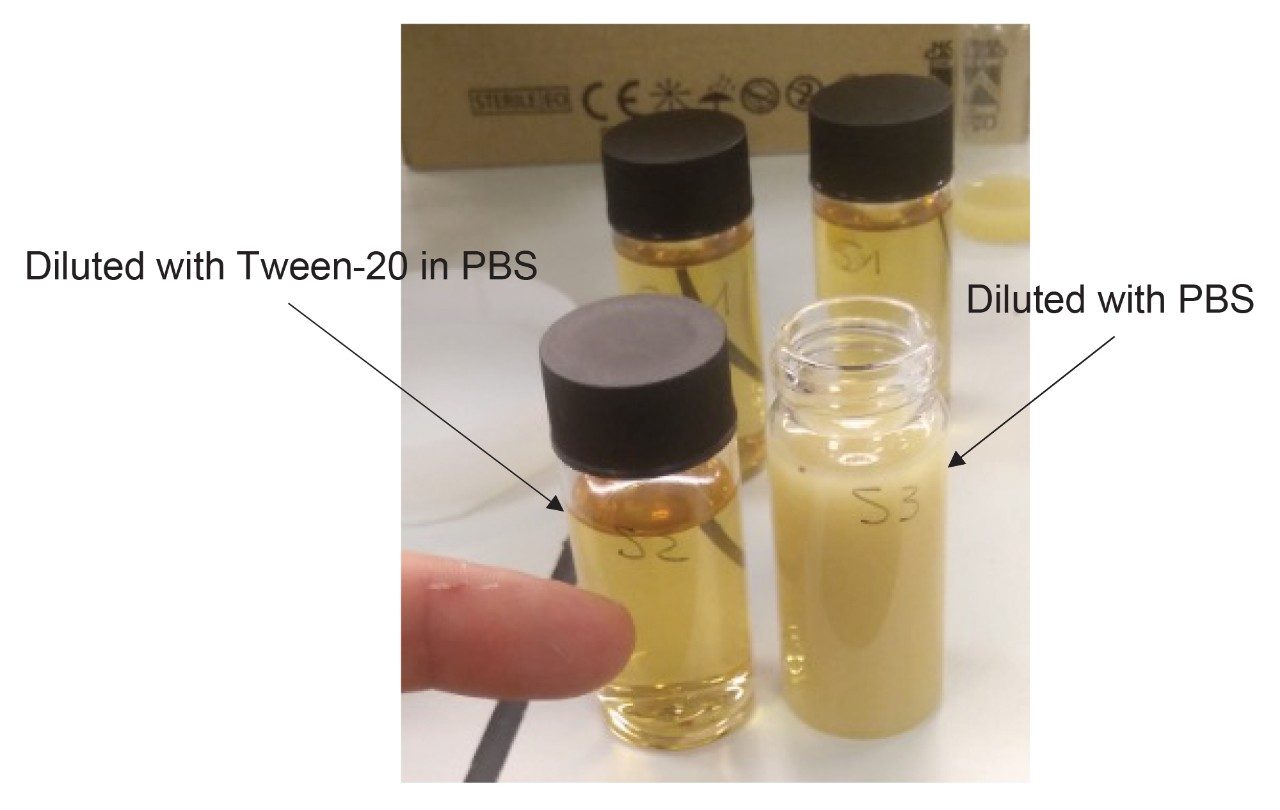
Before extraction, 5.0 ± 0.01 g of homogenized solid samples are placed in a 50-mL falcon tube. Ten mL of MeCN:H2O 84:16 (v/v) are added and the tube is vortexed for 3 minutes. Fifteen mL of MeOH:H2O 80:20 (v/v) are added and the tube is vortexed for an additional 3 minutes. After centrifugation at 5000 rpm (~5300 g) for 6 minutes, 2.5 mL of supernatant are diluted with 47.5 mL of 2% (w/w) Tween-20 in phosphate buffer solution (PBS)a. The entire diluted extract (50 mL) is passed through a VICAM AflaOchra Column (p/n G1017) at a rate of 1 drop/second (loading step). Then, 10 mL of PBSb are passed through the column at a rate of 1-2 drops/second (washing step 1) and an additional 10 mL of water are passed through (washing step 2). About 3 mL of air are slowly pumped to dry the cartridge. 0.7 mL of MeOH are passed through at 1 drop/second and collected (elution 1). The column is let to run dry without pumping extra air through and let to stand for 1 minute. An additional 0.7 mL of MeOH is passed through (elution 2) and collected with the previous portion by forcing 10 mL of air through. Finally, 300 µL of eluate extract are mixed with 200 µL of water directly into an LC vial prior to LC-MS/MS analysis. The resulting dilution factor is 4.67 (14/3).
(a) Preparation of the diluent (2% Tween-20 in PBS): weigh 20 g of Tween-20 in a 1 L glass bottle. Add 100 mL of VICAM 10X concentrate PBS (p/n G1113) and 900 mL of purified water. Mix well and place the bottle into an ultrasound bath for 10 minutes.
(b) Preparation of PBS: To a 1-L glass bottle add 100 mL of VICAM 10x concentrate PBS (p/n G1113) and 900 mL of purified water (pH 7.0).
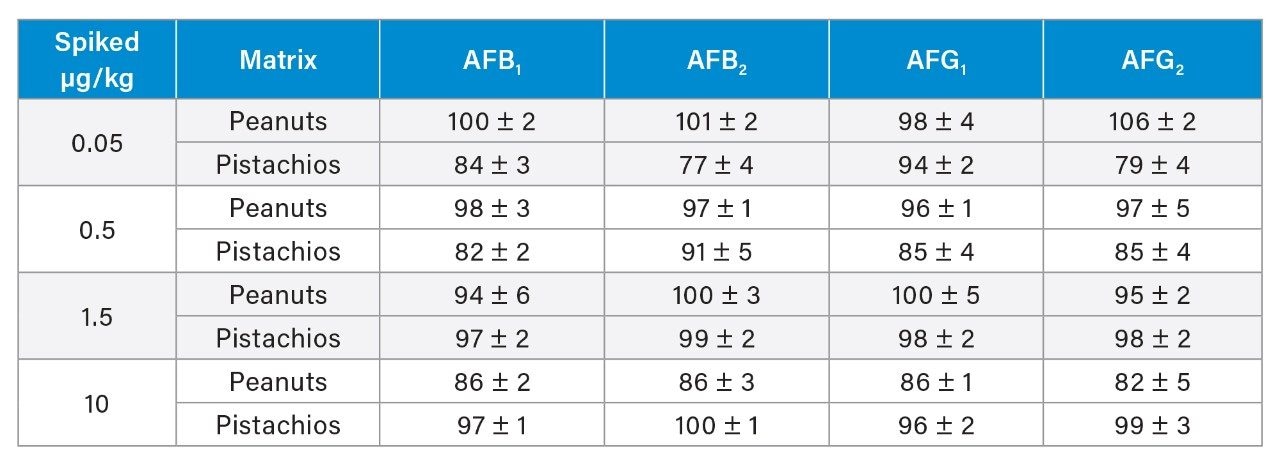
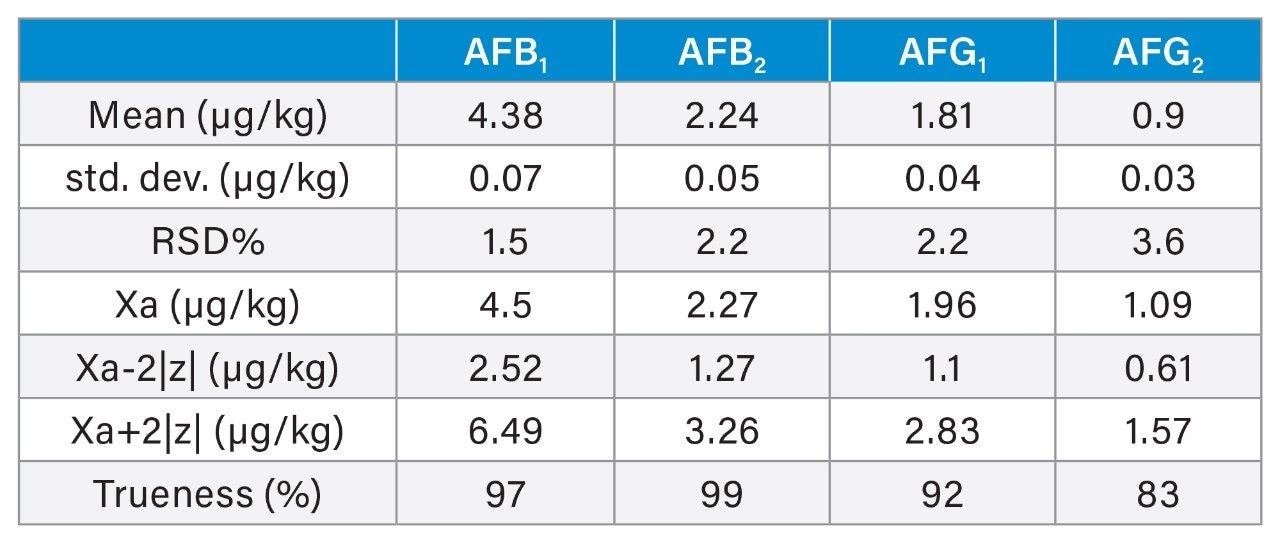
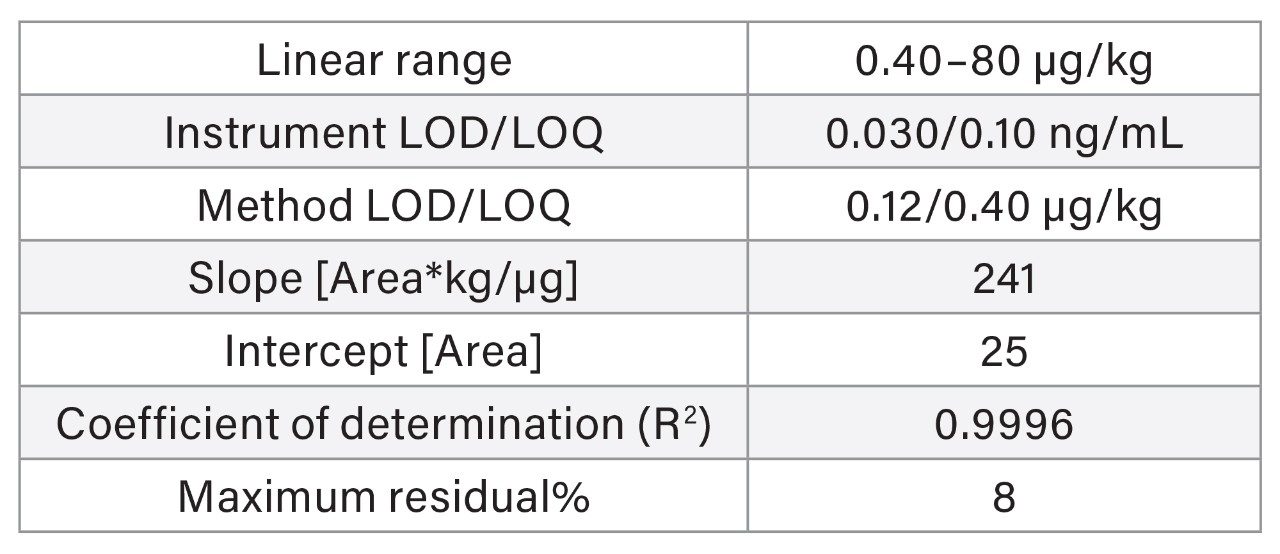
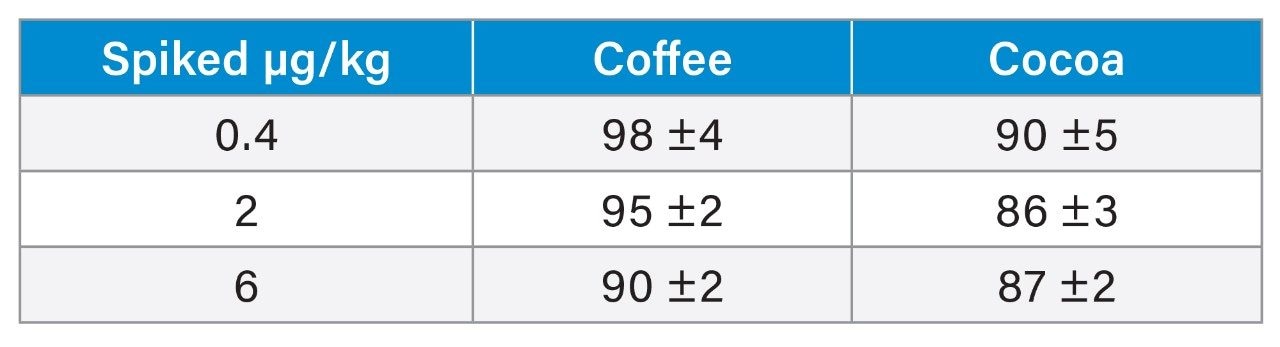
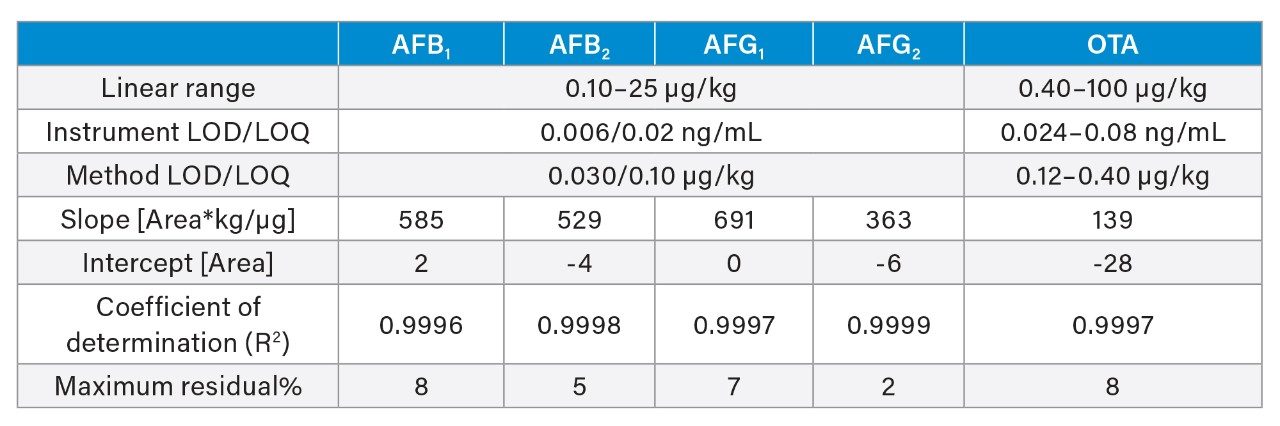
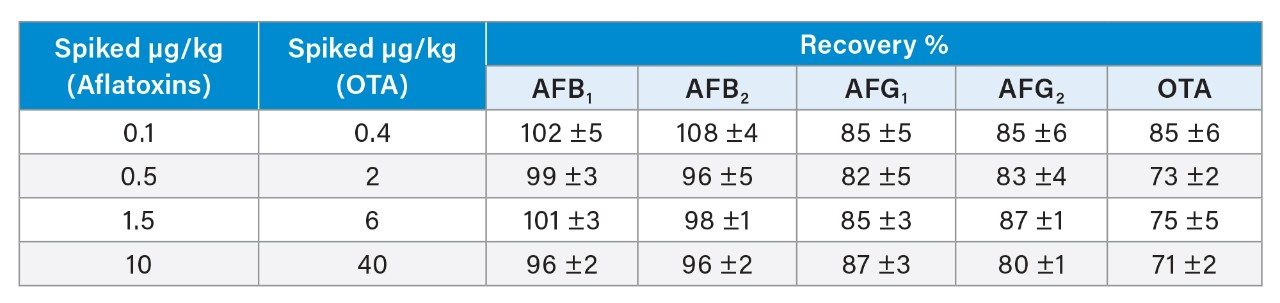
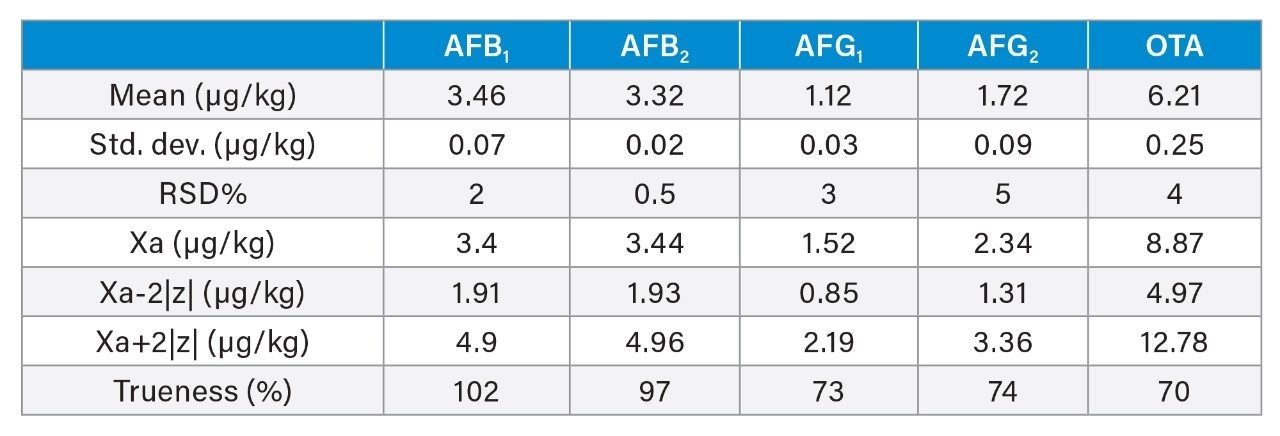
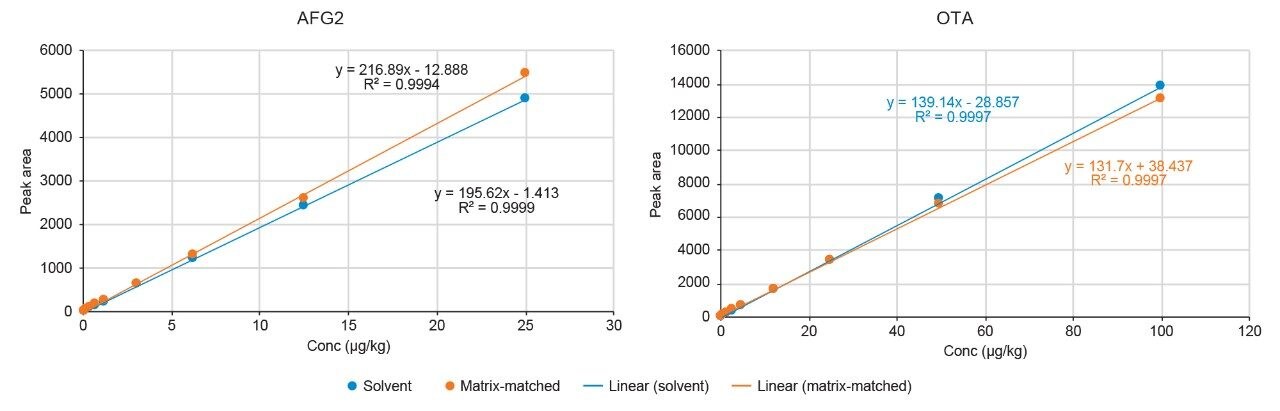
Method Validation
A recovery experiment was performed by spiking separated black pepper samples with a mix of aflatoxins and OTA at four concentration levels (0.1, 0.5, 1.5, 10 µg/kg of each aflatoxin and 0.4, 2.0, 6.0, 40 µg/kg of OTA) in triplicate. Blanks and fortified samples were then extracted and analysed as described in the previous section. Trueness and precision were also verified by analysing a black pepper certified reference material in six independent replicates.