• 응용 자료

Rapid AAV Concentration Determination Using Size-Exclusion Chromatography with Fluorescence and UV Dual Detection

Rapid AAV Concentration Determination Using Size-Exclusion Chromatography with Fluorescence and UV Dual Detection

  • Stephan M. Koza
  • Weibin Chen
  • Waters Corporation

Abstract

A method using an SEC guard column as an online buffer exchange device prior to intrinsic protein fluorescence detection was demonstrated to be effective for the rapid, two minute, determination of capsid content (Cp/mL) in AAV8 samples from 2.6 x 10¹¹ Cp/mL to 2.0 x 10¹² Cp/mL. The method uses 1 µL of sample per replicate with minimum sample preparation. A detector monitoring intrinsic protein fluorescence was used for concentration measurements. FLR response was adjusted for capsid DNA content (Empty/Full ratio), which was estimated using the ratio of SEC-A280 and SEC-A260 peak areas obtained from a UV/VIS PDA detector positioned prior to the FLR detector (SEC-UV-FLR).

Benefits

  • Rapid and high throughput AAV capsid concentration determination
  • Measurements down to 2 x 10¹¹ capsids/mL or lower
  • Approximation of AAV ssDNA E/F ratio

Introduction

Determining the concentration of capsid in a preparation of adeno-associated virus (AAV) designed for gene therapy treatments is essential in both process development and product quality analyses. Currently ELISA methods are typically used for capsid quantification. These methods are quite reliable, however they may take several hours to generate results, require well characterized reagents, and generally have lower precision (~20% CV at limits of quantification) than chromatographic methods.1,2 Methods have also been introduced that use the differential ultraviolet absorbance (UV) of the capsid proteins and ssDNA of the AAV under denaturing conditions.3 This approach is generally amenable to high throughput testing with minimal analysis times but may require significant sample volumes (100 µL) and will be susceptible to the presence of interfering chromophores. Additionally, the use of non-denaturing size-exclusion chromatography (SEC) with UV absorbance detection has also been reported (SEC-UV).4 While linear calibration curves are demonstrated for this approach, the method would be limited to samples with little variation in ssDNA content.

In a more recent publication, the relative quantification of AAV capsid that does not contain ssDNA (empty) was evaluated using anion-exchange chromatography with intrinsic protein fluorescence (FLR) detection.5 In this study, it was shown that the relative change of intrinsic protein fluorescence intensity for empty capsid versus those AAV that contain the requisite ssDNA was several fold lower than was observed for UV absorbance at 280 nm (A280) or 260 nm (A260). This potentially makes FLR better suited than A280 for AAV quantification since errors in the estimate of ssDNA content of the capsid in the sample will have significantly less impact on the final concentration determination. Other advantages of FLR include greater selectivity for the protein component versus other sample components including surfactants and DNA, and enhanced sensitivity for low concentration samples.

Two challenges presented by AAV as an analyte relative to UV absorbance and FLR optical detection methods are light scattering effects due to AAV particle size and the impact that can have on the UV absorbance and FLR quantum yields. As a result, the empirical UV absorbance and FLR response for intact AAV will be most effectively determined when other solution components in the AAV sample remain constant. In addition, the level of particulates in the samples with sizes approaching or exceeding that of the UV wavelengths being employed should be minimized. In traditional optical methods this is generally accomplished using 0.2 µm and smaller filters to further purify the sample prior to spectral analysis.6

Here we present a rapid SEC method (two minutes) with FLR detection for the determination of AAV capsid concentration (Cp/mL). An SEC approach provides a consistent solution in which optical measurement of an analyte is undertaken and may provide additional removal of interfering components from the sample. In this method, the FLR signal response may be corrected for ssDNA content of the capsid in the sample as determined by a separate analysis such as anion-exchange chromatography (720006825EN). Alternatively, as demonstrated in this study the ssDNA content may be estimated from the ratio of UV absorbance based on peak areas at 260 nm and 280 nm (A260/A280) measured by a UV/VIS PDA detector in tandem with and positioned prior to the FLR detector (SEC-UV-FLR).

Experimental

Sample Preparation

AAV8 capsids without ssDNA (AAV8-Empty) or with Green Fluorescent Protein genes (AAV8-CMV-GFP) were injected directly onto the SEC column. The concentration of the AAV8-Null and AAV8-CMV-GFP samples were estimated to be approximately 1.67 x 10¹² and 2.48 x 10¹² capsid/mL (Cp/mL), respectively.

LC Conditions

System:

ACQUITY UPLC H-Class PLUS Bio

Detection:

Fluorescence detector: excitation: 280 nm, emission: 350 nm;(10 points/sec) and ACQUITY UPLC PDA Detector with 5 mm titanium flow cell, 280 nm and 260 nm; (10 points/sec)

Vials:

Polypropylene 12 x 32 mm Screw Neck Vial, with Cap and Pre-slit PTFE/Silicone Septum, 300 µL Volume, 100/pk (p/n: 186002639)

Guard column:

ACQUITY UPLC Protein BEH SEC, 125 Å, 1.7 µm, 4.6 x 30 mm (p/n: 186006504)

Column temp.:

25 °C

Sample temp.:

10 °C

Injection volume:

1.0 μL

Flow rate:

0.20 mL/min

Mobile phase:

10 mM NaH2PO4, 10 mM Na2HPO4, pH 6.6 (HCl), 200 mM KCl, pH 6.6 (HCl), 0.1 µm sterile filtered

Data Management

Chromatography software:

Empower 3

Results and Discussion

This study aimed to develop a chromatographic method that would allow for the rapid determination of the capsid content of an AAV sample with minimal sample preparation, limited sample consumption, and a practical lower limit of quantification. The SEC-UV-FLR method presented here employs a separation on a Protein BEH SEC Guard Column. This short bed-length column (30 mm) is packed with 1.7 µm diameter diol-bonded BEH particles with a 125 Å average pore size. An SEC column is used to buffer exchange the AAV capsid into the mobile phase, and by selecting a short column that excludes AAV from most of the pore volume, the dispersion of the AAV is minimized. However, if the AAV samples also contain significant amounts of interferences (e.g., proteins, DNA) that could co-elute with AAV then a longer column with a larger pore size may be required. Both a UV absorbance detector (UV) and fluorescence detector (FLR) were used in series. The FLR was positioned after the UV to accommodate the lower back pressure limits of the FLR.

The concentration of the AAV8-Null (without ssDNA) control sample (referred to hereafter as AAV-Empty) was assigned as 1.67 x 10¹² capsid/mL (Cp/mL) based on ELISA measurement as reported by the supplier and the measured DNA-containing capsid levels were approximately 0.5% as determined by electron microscopy and 1.5%  as determined by charge-detection mass spectrometry (CDMS). The concentration of the AAV8-CMV-GFP sample (AAV-Full) was estimated as 2.48 x 10¹² Cp/mL based on the relative peak areas of a CDMS spectrum using a 50:50 equal volume mixture of the AAV-Empty and AAV-Full samples. The AAV-Full sample contained 2.2% empty capsids based on CDMS analysis. The AAV-Full sample was serially diluted using the AAV-Empty sample to generate a set of mixtures with the mole fractions of AAV-Full (ΧFull) and capsid concentrations shown in Table 1. The predicted ΧFull values of the mixtures also compared favorably to those observed by CDMS with a correlation of 0.996 and a slope of 1.008 for a linear fit forced through the origin (data not shown). It should be noted, however, that while the use of these relative concentration values is adequate to demonstrate the principles of this methodology a more rigorous assessment of the capsid concentrations of the AAV-Empty and AAV-Full standards should be considered when greater method accuracy is required.

The SEC FLR and SEC-UV at 260 nm and 280 nm (SEC-A260 and SEC-A280) peak areas were determined in duplicate for the set of AAV-Full and AAV-Empty sample serial dilutions. In the overlays of representative chromatograms (Figure 1), we observe that the change in response for the FLR signal is significantly lower than the changes observed in the UV absorbances as ΧFull of AAV8 is varied from 1 to 0. This difference is predominately the result of the strong UV absorbance of DNA within the full capsid at 260 nm. The SEC-FLR and SEC-UV peak areas of the mixtures were then normalized for concentration by dividing the peak areas by their respective relative concentrations (Table 1). The normalized peak areas were then plotted against ΧFull (Figure 2). Based on the fitted linear equations presented in Figure 2 the peak areas predicted for ΧFull values of 1 and 0 (AreaXFull = 1 and AreaXFull = 0) were extrapolated and AAV8-Full to AAV8-Empty response factors (RF/E) of 6.81 for A260 (RF/E,260), 2.98 for A280 (RF/E,280), and 0.875 for FLR (RF/E,FLR) were calculated using Equation 1 below. The values of RF/E,260, RF/E,280, and RF/E,FLR are expected to vary with the composition of the ssDNA and to a lesser extent with AAV serotype.

Equation 1.

Figure 1. A comparison of the SEC fluorescence and UV absorbance responses for a series of AAV8 samples in which the mole fraction of AAV8-Full ranges from approximately 1.0 (black) to 0.0 (red). Experimental procedures provided in text. 
Figure 2. Shown are the changes in the SEC-UV (280 nm and 260 nm) and SEC-FLR peak areas for a series of AAV8 samples (n = 2) where the mole fraction of AAV8-Full (ΧFull) ranges from approximately 1.0 to 0.0. Peak areas are normalized to sample concentration (Cp/mL). Experimental procedures provided in text. 

In routine use, AreaΧFull = 1 and AreaXFull = 0 may be directly calculated using the peak areas of the two AAV-Full and AAV-Empty control samples for which both Cp/mL and ΧFull have been determined. Additionally, since RF/E, FLR has a value closer to 1 versus RF/E, 280 and RF/E, 260, a correction for FLR response may not be necessary for SEC-FLR capsid concentration estimates in which ΧFull of the samples does not vary significantly or less precise capsid concentration determinations are acceptable.  

In order to apply RF/E, we will need to know ΧFull of the sample (ΧFull, Sample). While ΧFull, Sample may be determined through methods such as electron microscopy or anion exchange chromatography,5 it may be possible to use the ratio of the  SEC-A260 and SEC-A280 peak areas (AreaA260/AreaA280) to approximate ΧFull for the sample being evaluated in an SEC-UV-FLR or SEC-UV experiment. The UV absorbance-based estimate of ΧFull, Sample is reliant on the standards used and it is important to ensure measurements are made under well controlled experimental conditions since the absorbance values can deviate significantly with changes to the buffer composition.

In this study, a photodiode array (PDA) UV-VIS detector was used in series with the FLR detector. FLR detector flow cells are typically less tolerant of higher pressures and should generally be positioned after the UV detector. The advantages of determining the A260/A280 UV absorbance ratio in this manner is that additional sample is not required, and any potentially interfering chromophores or fluorophores in the samples may be separated from the AAV capsid on the SEC column if they are different in size. A PDA detector was preferred over a dual-wavelength tunable UV-VIS detector (TUV) for this SEC-UV-FLR method due to its significantly higher sampling rate given the peak widths observed (~12 seconds). If a longer SEC column is used or the flow rate is reduced a TUV detector could be used provided that approximately 40 or more points are collected across the peak.

The relationship between the observed peak area ratio of the sample mixtures and ΧFull for AAV8 shows a non-linear response curve (Figure 3). The predicted peak area ratios for the sample mixtures are depicted by the dashed line in Figure 3 and can be calculated using the relationship:

Equation 2.

Where ΧEmpty, Sample and ΧFull, Sample  are the mole fractions of AAV-Empty and AAV-Full in the sample. AreaA260, XFull = 0, AreaA260, XFull = 1, AreaA260, XFull = 0, and AreaA260, XFull = 1 are extrapolated from the fitted linear equation for SEC-A280 and SEC-A260 presented in Figure 2, as previously described.

Figure 3. Shown are the changes in the SEC 260 nm and 280 nm UV absorbance peak area ratios (n = 2) for a series of AAV8 samples in which the mole fraction of AAV8-Full (ΧFull) ranges from approximately 1.0 to 0.0. The dashed line highlights the predicted A260/A280 ratios. Experimental procedures provided in text. 

To determine ΧFull of a sample using the SEC-UV peak area ratio measured for the test sample (AreaA260, Sample/AreaA280, Sample) the relationship in Equation 2 may be rearranged to Equation 3. For those interested in mathematic detail, Equation 3 in its reduced form is an asymptotic non-linear regression between ΧFull, Sample and (AreaA260, Sample/AreaA280, Sample) of the form y = a/x + bx + c.

Equation 3.

Equation 3 is independent of the concentration of the AAV samples being tested. Moreover, once AreaA260, XFull = 0, AreaA260, XFull = 1, AreaA260, XFull = 0, and AreaA260, XFull = 1 are determined on an LC system they may be considered as constants in further measurements. The resulting values of  ΧFull, Sample, which were calculated from the measured values  of AreaA260, Sample/AreaA280, Sample and Equation 3, correlated strongly with the  predicted values (R2 = 0.9995, slope = 0.991, intercept = 0.000, correlation plot not shown). As an additional assessment of the methodology, the measured values were also found to correlate well with those obtained by CDMS (Figure 4). These results demonstrate that the precision and accuracy of this method for the measurement of ΧFull, Sample are acceptable for the estimation of FLR and UV response factors and may even be adequate for estimates of ΧFull, Sample for process intermediate samples with relatively high abundances of empty capsid. However, due to greater slope of the response curve as ΧFull approaches one (Figure 3) this method will likely deliver less precision and accuracy for the determination of ΧFull, Sample in high purity samples.

Figure 4. The correlation for the determination of the mole fraction of AAV8-Full (ΧFull) as determined by SEC 260 nm and 280 nm UV absorbance peak area ratios (n = 2) and CDMS for a series of AAV8 samples. Experimental procedures provided in text. 

Once ΧFull, Sample is determined it can then be used along with RF/E (Equation 1) to normalize the SEC-FLR or SEC-UV peak area of a sample or standard (AreaSample, Norm) to account for the difference in response between an empty and full capsid. This peak area normalization will also be similarly applied to the concentration calibration standards. In this example, we have arbitrarily elected to normalize peak area to the value predicted if ΧFull, Sample were 1. To derive the normalization equation we can define the test sample (or standard) peak area (AreaSample, Meas) as a combination of the maximum peak area contributions of the full and empty capsids, AreaSample, XFull = 1 and AreaSample, XFull = 0, multiplied by their respective mole fractions.  

Equation 4.

By substituting in Equation 1 and the relationship ΧFull, Sample + ΧEmpty, Sample = 1, Equation 4 can be rearranged to yield Equation 5, which can be used to normalize the response of a sample or standard for its measured value of ΧFull.

Equation 5.

As an initial test of the methodology described above, the data set from the samples described in Table 1 were evaluated. In this case, the A280 UV absorbance and FLR peak area data for the dilution series of samples were evaluated without normalization for the known concentration differences with the intent of determining the capability of this method to predict the Cp/mL values of the serially diluted samples. For this study the two undiluted samples with ΧFull values of 0.0148 and 0.9788 and respective concentrations of 1.67 x 10¹² Cp/mL and 2.48 Cp/mL (Table 1) were used to apply response factor corrections using Equations 3 and 5, and to define the concentration calibration curves based on SEC-A280 and SEC-FLR.

The determined sample concentrations were then compared to the predicted values (Figure 5). The correlation was greater, and the slope of the curve was closer to one for the SEC-FLR data results versus those observed for SEC-A280. Additionally, the variance between the duplicate measurements of concentration was lower for the SEC-FLR results (0.67% average difference) versus the SEC-A280 concentration measurements (1.27% average difference) despite the variance being lower for the  actual SEC-A280 peak areas (0.43% average difference) versus the SEC-FLR peak areas (0.63% average difference). Since the same values of ΧFull are used in the SEC-FLR and SEC-A280 calculations, the more precise analytical results observed using SEC-FLR are predominantly due to the value of RF/E, FLR being closer to one (0.898) than the value of RF/E, A280 (2.98) since a response factor closer to one minimizes the impact of the variance in the determination of ΧFull. The additional impact of the greater variance in the determination of ΧFull for samples with low levels of empty capsid content, as noted previously, can also be observed for these results.

Figure 5. Comparison of the SEC-FLR-UV and SEC-UV based determinations of capsid concentrations. In both cases the determined concentration is corrected by a response factor based on ΧFull calculated from on-line UV A260 and A280 measurements as described in the text. The capsid concentration of capsid ranges from approximately 1.7 x 10¹² Cp/mL to 2.4 x 10¹² Cp/mL and the ΧFull values (shown in parentheses) of the samples ranged from approximately 0 to 1, respectively. Experimental procedures provided in text. 

To evaluate an extended concentration response curve a sample with an ΧFull value of approximately 0.55 and an estimated concentration of 2.07 X 10¹² Cp/mL was serially diluted to yield samples of 1.04 x 10¹², 5.19 x 10¹¹, and 2.59 x 10¹¹ Cp/mL. These samples were analyzed on an LC system with both an FLR and UV detector in line (SEC-UV-FLR). A comparison of the UV absorbance (260 nm and 280 nm) and FLR chromatograms for the lowest concentration sample (2.59 x 10¹¹ Cp/mL) is presented in Figure 6. Here we observe that adequate signal is observed for all three optical channels with the FLR detector having significantly higher signal-to-noise (~10x) versus the UV absorbance channels indicating that the quantitative limits may likely be lower for FLR.

Figure 6. Comparison of the SEC UV absorbance responses for a series of AAV8 samples with an approximate capsid concentration of 2.59 x 10¹¹ Cp/mL. Experimental procedures provided in text. 

Figure 7 shows the FLR response curves for the SEC-FLR and SEC-A280 peak areas that have been normalized by their respective response factors (RE/F, FLR and RE/F, A280). While we expect the diluted samples to have equivalent values of ΧFull, the correction was applied to interrogate the reproducibility of the SEC-UV-FLR and SEC-UV methods. A useful linear fit is observed for the SEC-FLR and SEC-A280 calibration curves with correlation coefficients of 0.9985 and 0.9989, respectively. These results indicate that when the levels of empty capsid in AAV samples are higher and more consistent, the SEC-A280 method, with applied ΧFull response correction, may provide comparable analytical performance in comparison to the SEC-FLR method.

Figure 7. The change in the SEC-FLR-UV and SEC-UV peak area corrected by a response factor based on ΧFull calculated from on-line UV A260 and A280 measurements as described in the text. The concentration of capsid ranges from approximately 2 x 10¹¹ Cp/mL to 1.6 x 10¹² Cp/mL. Experimental procedures provided in text. 

Conclusion

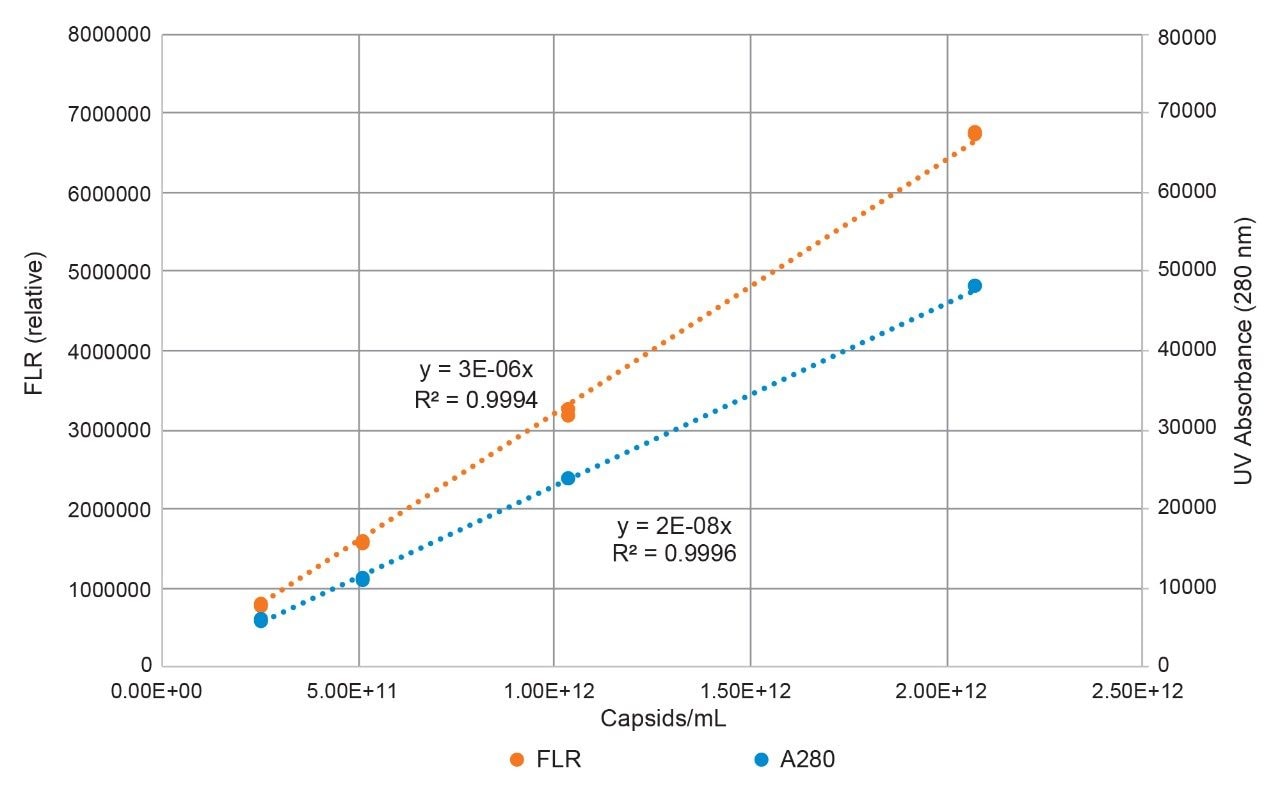
The use of an efficiently packed SEC guard column as an online buffer exchange device prior to intrinsic protein fluorescence detection was demonstrated to be effective for the rapid determination of capsid content (Cp/mL) in AAV8 samples from 2.6 x 10¹¹ Cp/mL to 2.0 x 10¹² Cp/mL. The proposed method uses 1 µL of sample per replicate with minimum sample preparation. However, for samples with higher levels of visible or sub-visible particulates a centrifugation step may be advisable.

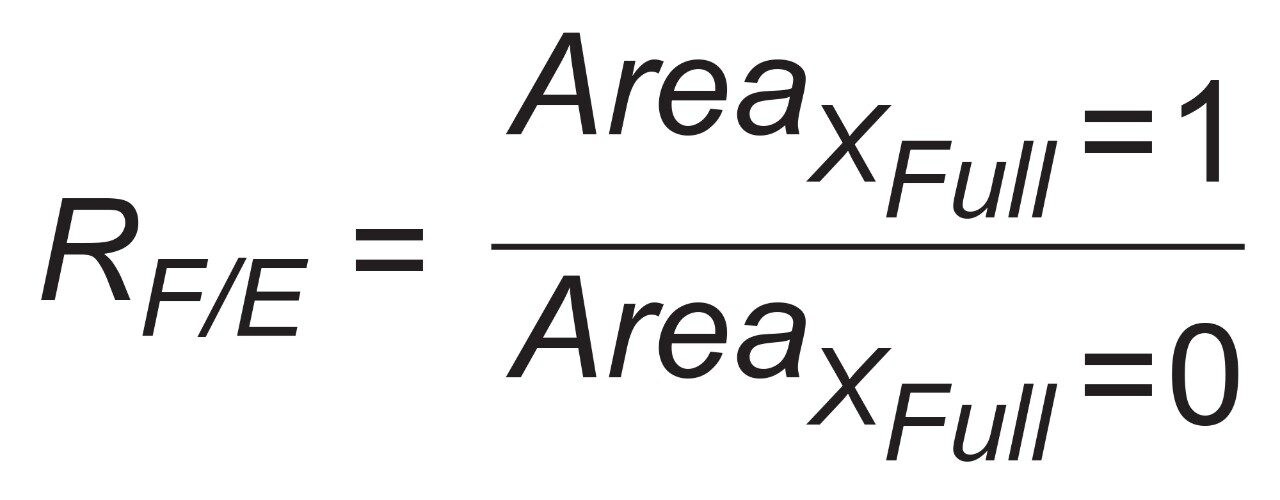
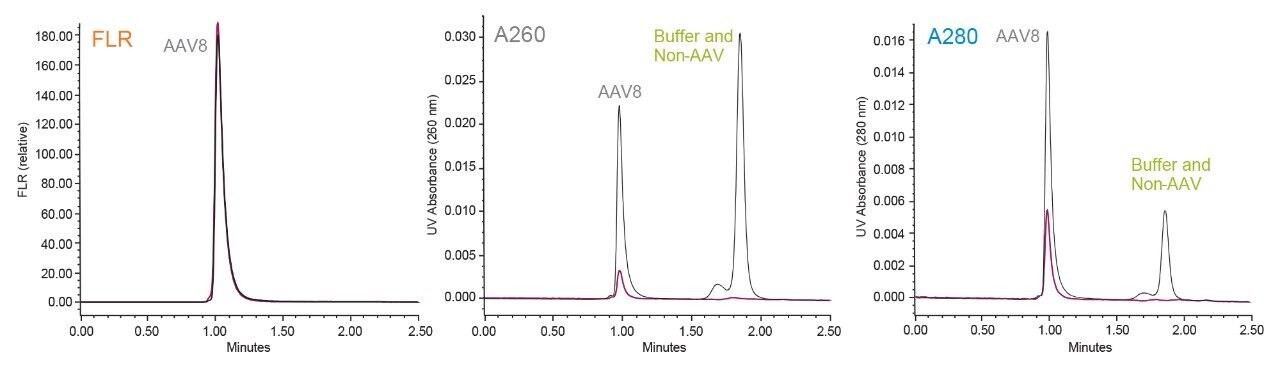
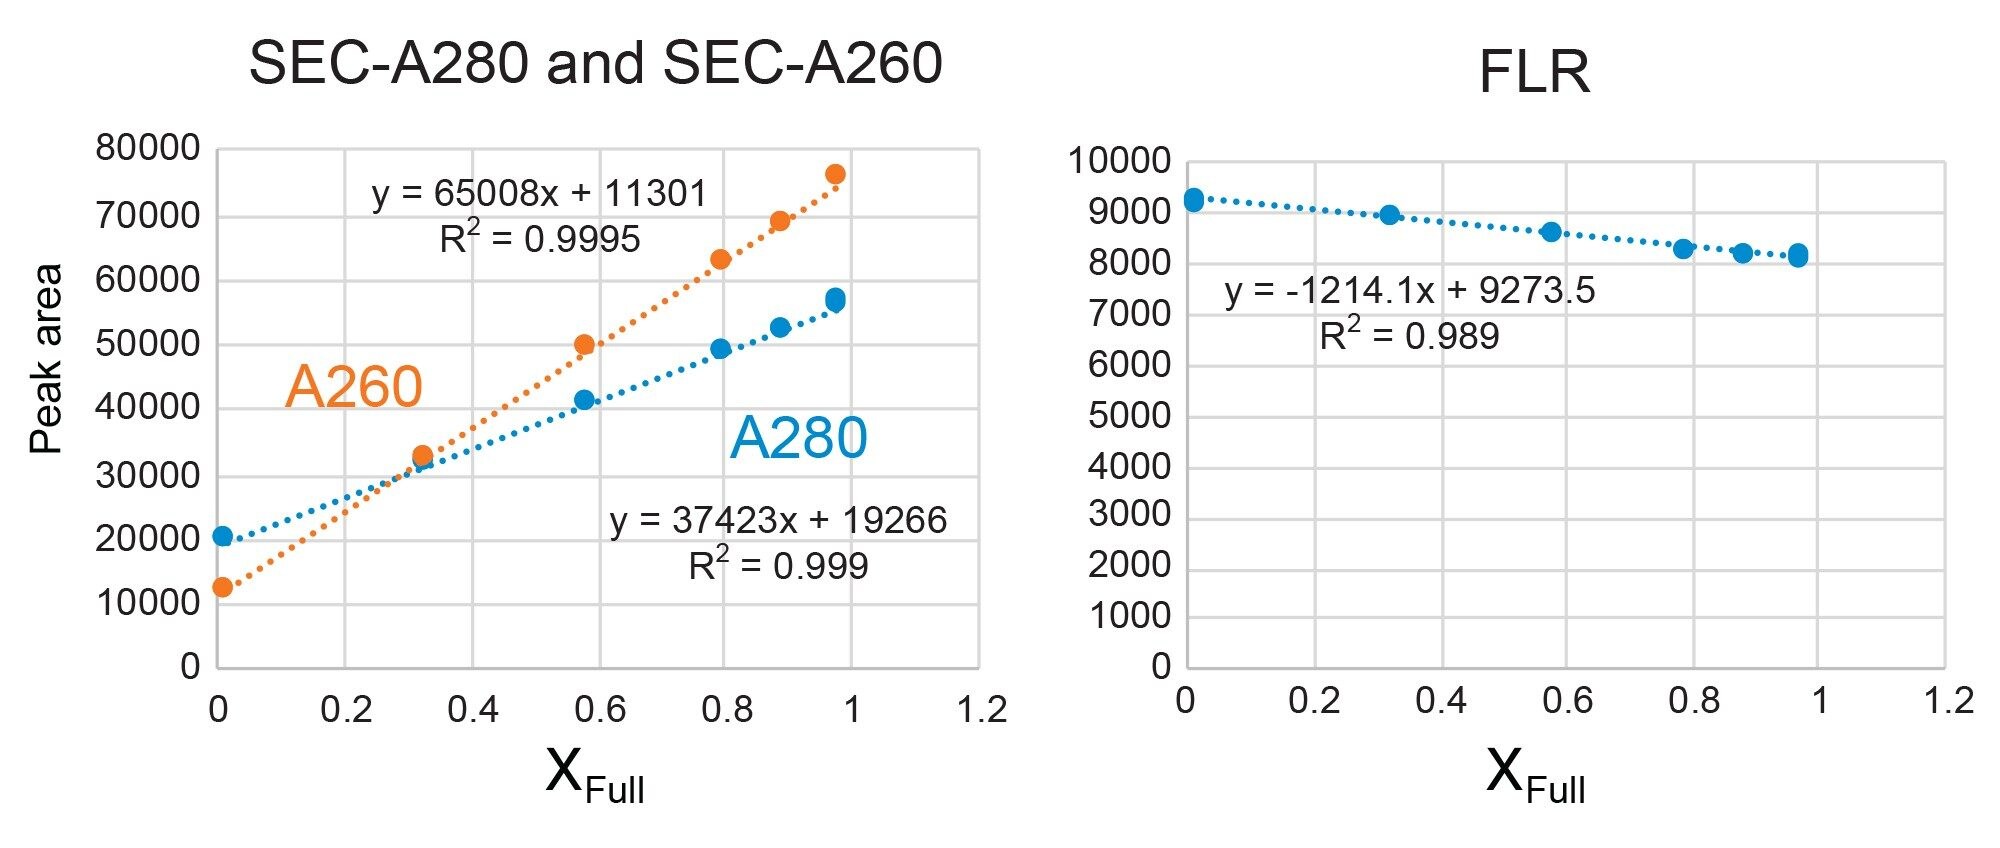
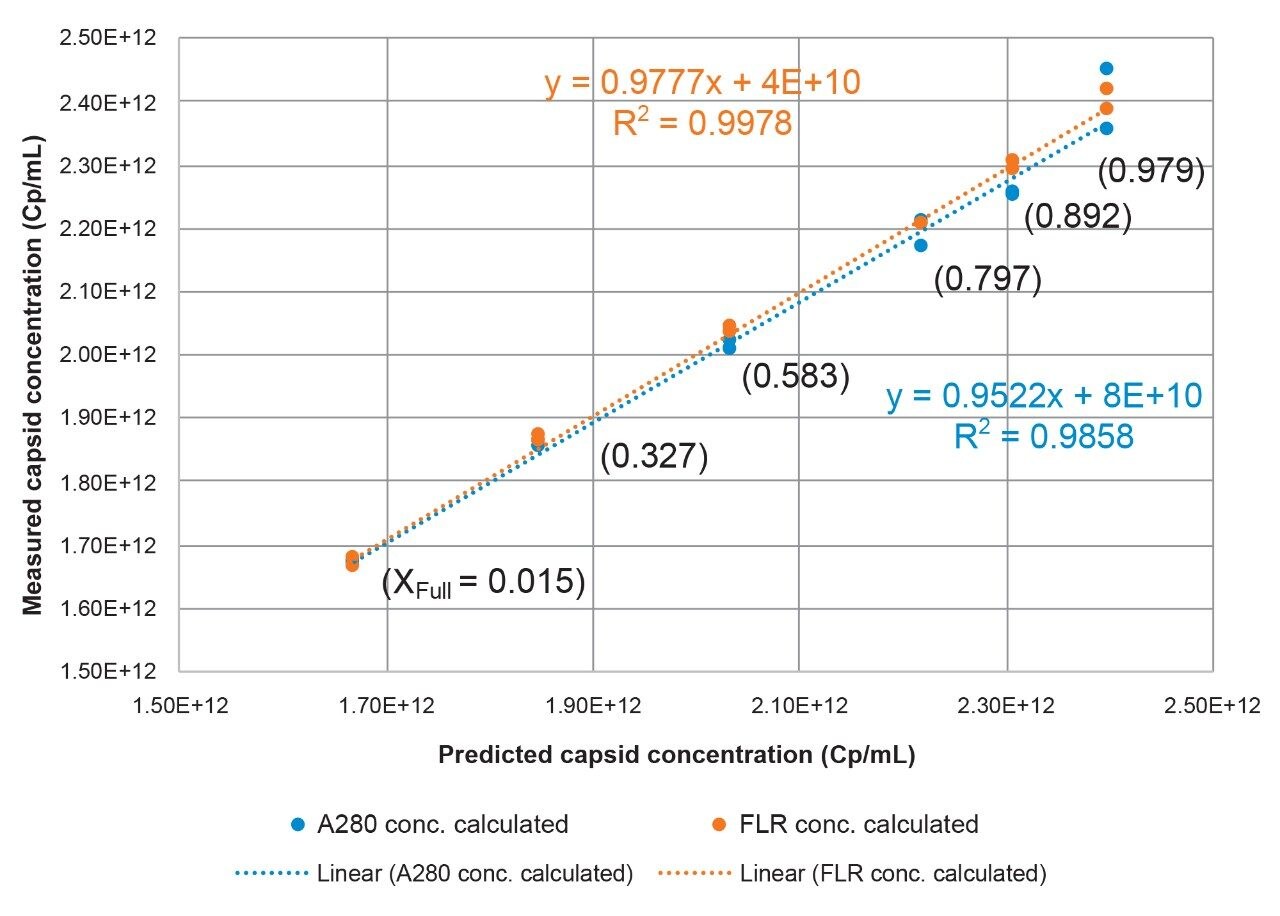
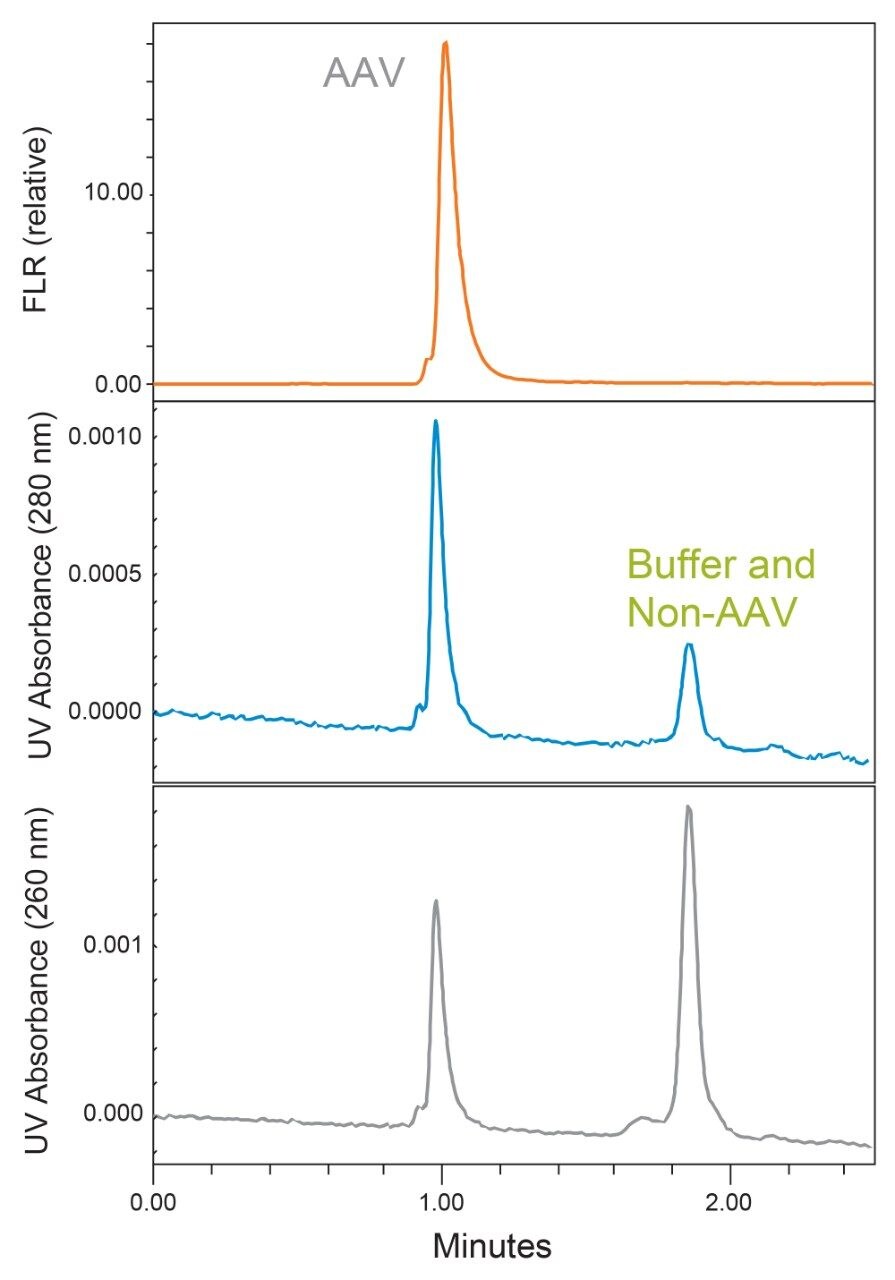
An FLR detector monitoring intrinsic protein fluorescence (tryptophan) offers benefits versus UV absorbance. These benefits include the Empty/Full FLR response factor for AAV8 that is closer to 1 in comparison to the response factors observed for UV absorbance at 280 nm (RF/E, A280 = 2.98) and 260 nm (RF/E, A260 = 6.81). Therefore, FLR detection is less dependent on the precise and accurate determination of the mole fraction of DNA containing capsid (ΧFull). Additionally, intrinsic protein fluorescence has approximately 10-fold higher S/N and is a more selective protein detection method that is not sensitive to free DNA or RNA in the sample.

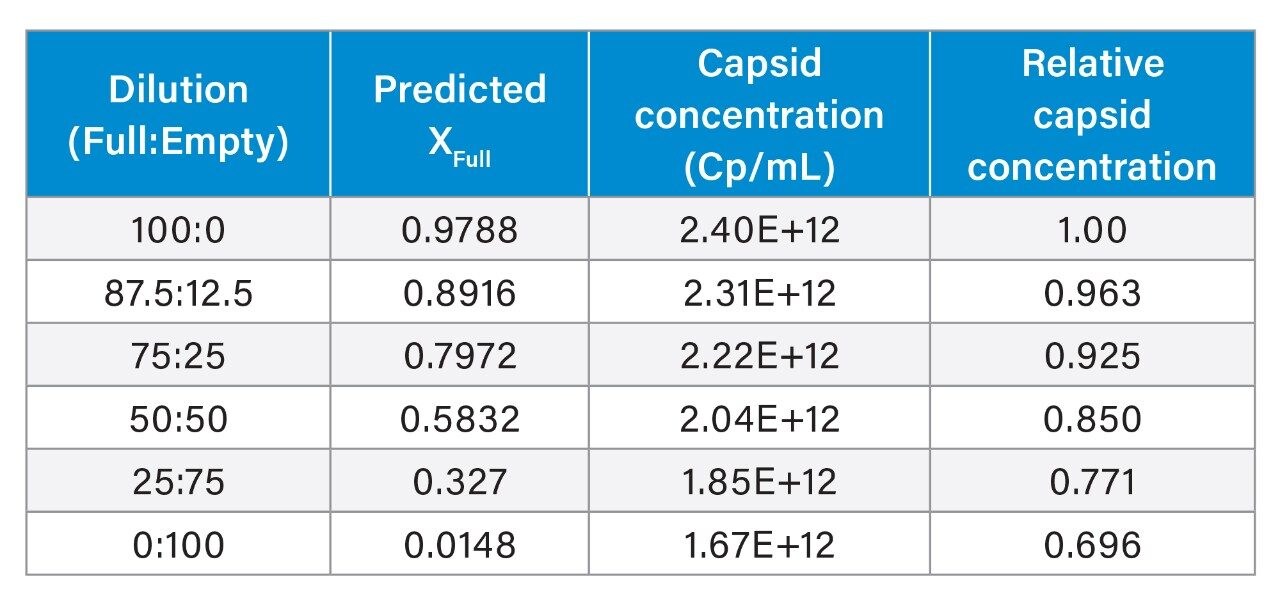
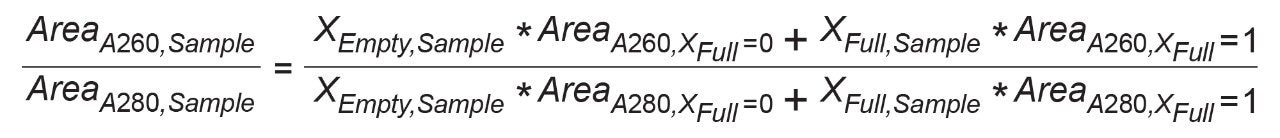
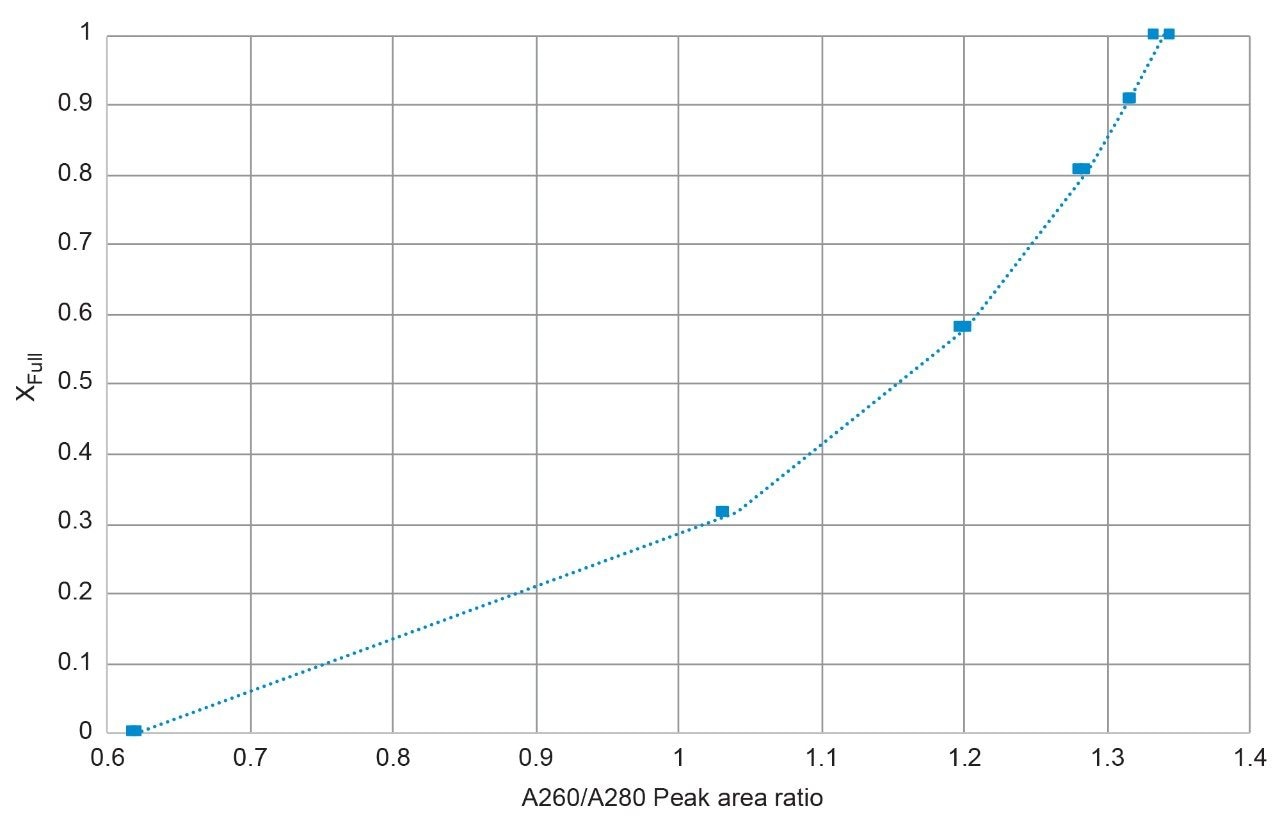
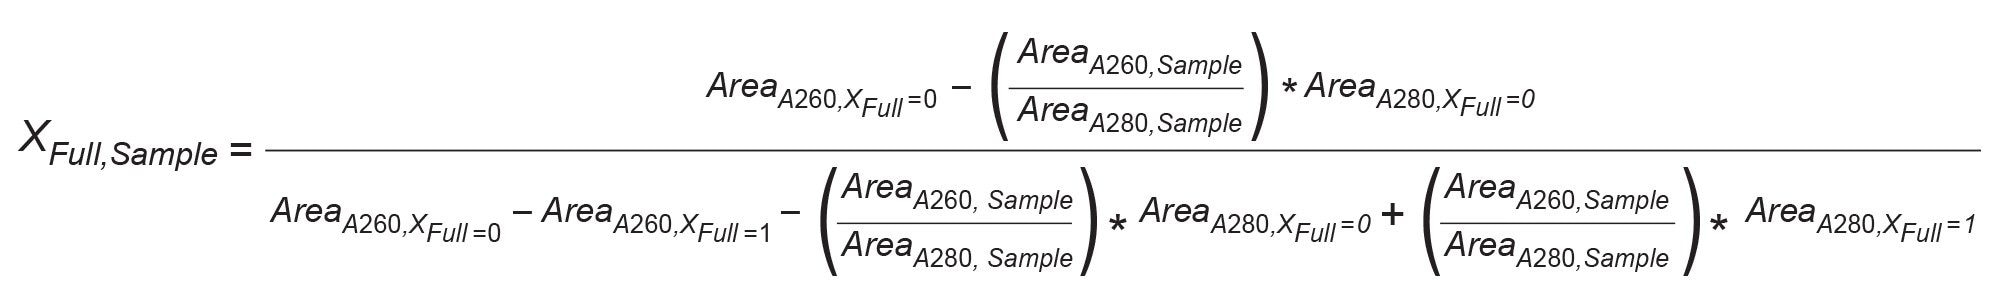
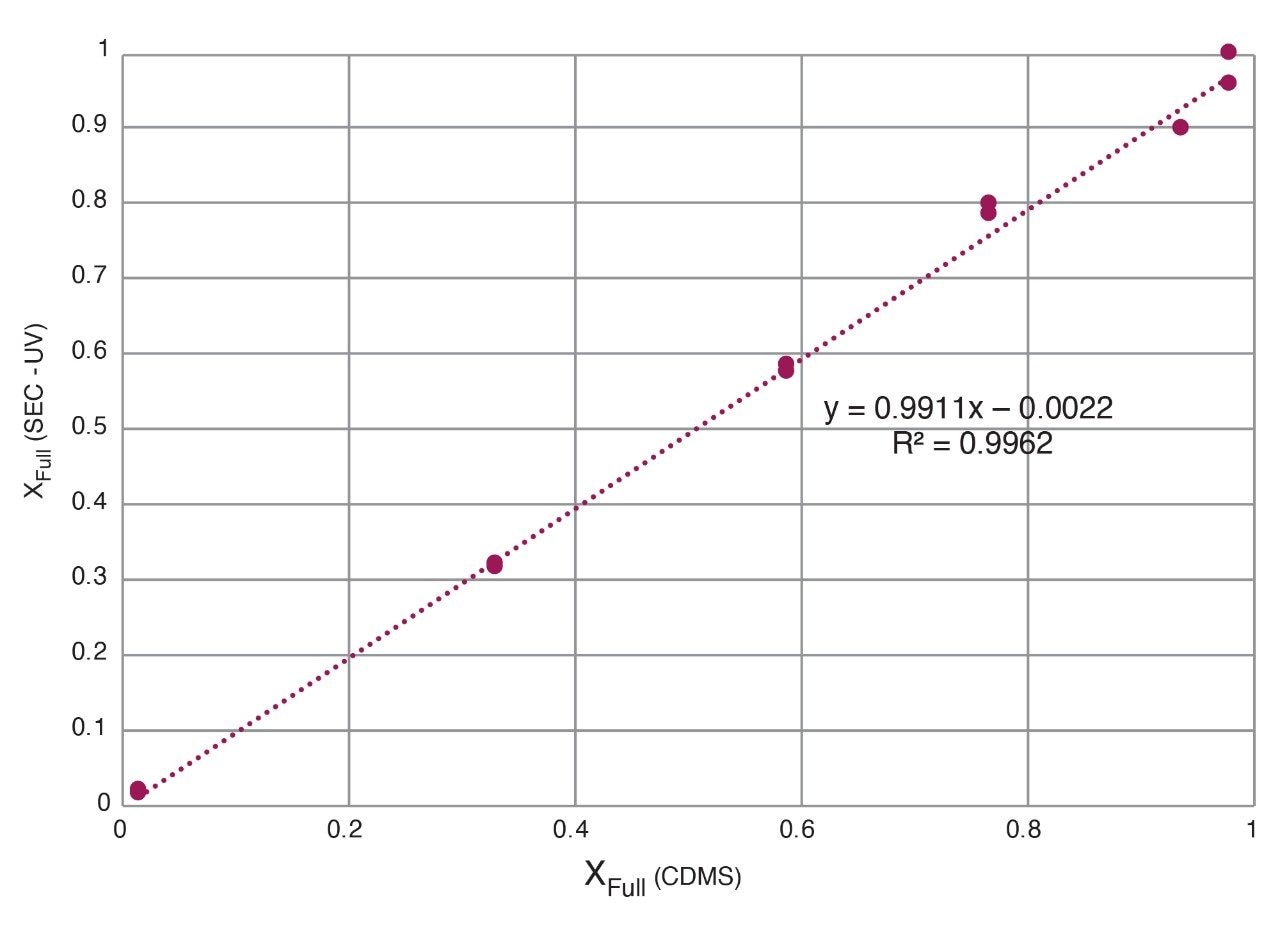
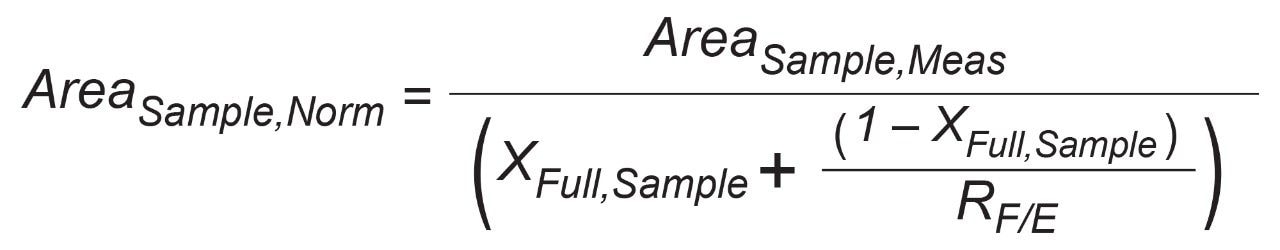
The level of DNA containing capsid, ΧFull, can be determined by an additional analysis (e.g., anion exchange chromatography) or empirically estimated from the ratio of SEC-A280 and SEC-A260 peak areas using a UV/VIS PDA detector positioned prior to the FLR detector (SEC-UV-FLR), as shown. Also, while not demonstrated in this work, a TUV detector may be used instead of the UV/VIS PDA detector if an SEC method producing larger peak widths is used.

Purified samples were used in demonstrating the general principal of this method. However, when analyzing samples that contain macromolecular interfering fluorophores (e.g., proteins) that co-elute with AAV it may be necessary to use a larger pore size SEC particle along with a longer SEC column or slower flow rate to gain better resolution. Also, when employing SEC-A260 and SEC-A280 peak areas for the determination of ΧFull, interfering chromophores (e.g., proteins, RNA, or DNA) may also need to be separated from the AAV if those interferences are at high enough levels to significantly impact the determination of capsid ssDNA content. Also, while not demonstrated here, larger diameter (7.8 mm I.D.) columns packed with larger size particles (2.5 µm or 3.5 µm) can be deployed for HPLC systems. Larger particle size columns will be less readily fouled with sample particulates, although proportionally higher sample amounts (3 µL) will be required to gain similar sensitivity and lower sample throughputs may result.


Acknowledgement

The authors would like to thank Benjamin Draper of Megadalton Solutions for providing the CDMS analyses for this study.

References

  1. Werling, N. J.; Satkunanathan, S.; Thorpe, R.; Zhao, Y. Systematic Comparison and Validation of Quantitative Real-Time PCR Methods for the Quantitation of Adeno-Associated Viral Products. Human Gene Therapy Methods 2015, 26 (3), 82–92.
  2. Andreasson, U.; Perret-Liaudet, A.; van Waalwijk van Doorn, L. J.; Blennow, K.; Chiasserini, D.; Engelborghs, S.; Fladby, T.; Genc, S.; Kruse, N.; Kuiperij, H. B.; Kulic, L.; Lewczuk, P.; Mollenhauer, B.; Mroczko, B.; Parnetti, L.; Vanmechelen, E.; Verbeek, M. M.; Winblad, B.; Zetterberg, H.; Koel-Simmelink, M.; Teunissen, C. E.,A Practical Guide to Immunoassay Method Validation. Frontiers in Neurology 2015, 6, 179.
  3. Sommer, J. M.; Smith, P. H.; Parthasarathy, S.; Isaacs, J.; Vijay, S.; Kieran, J.; Powell, S. K.; McClelland, A.; Wright, J. F. Quantification of Adeno-Associated Virus Particles and Empty Capsids by Optical Density Measurement. Molecular Therapy:The Journal of the American Society of Gene Therapy 2003, 7 (1), 122–8.
  4. Runnels, H. Gene Therapy and AAV: Advancing Analytical Characterization to Improve Product Understanding, Control and Comparability Exercises. CMC Strategy Forum 2017.
  5. Wang, C.; Mulagapati, S. H. R.; Chen, Z.; Du, J.; Zhao, X.; Xi, G.; Chen, L.; Linke, T.; Gao, C.; Schmelzer, A. E.; Liu, D. Developing an Anion Exchange Chromatography Assay for Determining Empty and Full Capsid Contents in AAV6.2. Molecular Therapy. Methods & Clinical Development 2019, 15, 257–263.
  6. Noble, J. E. Quantification of Protein Concentration Using UV Absorbance and Coomassie Dyes. Methods in Enzymology 2014, 536, 17–26.

720006867, January 2021

맨 위로 돌아가기 맨 위로 돌아가기