Determination of Free Amino Acids Content in Alcoholic and Non-Alcoholic Beverages Using the AccQ•Tag™ Ultra Derivatization Kit
Abstract
Beverage manufacturers often wish to monitor essential and non-essential amino acids as they influence flavor and taste. Amino acid analysis commonly uses traditional, long High-Performance Liquid Chromatography (HPLC) methods or requires specialized amino acid analyzers that cannot be used for other applications. Here, we present a fast Ultra Performance Liquid Chromatography (UPLC™) analysis with a ten-minute gradient that allows easy quantification of amino acids as well as flexibility of system use for other applications.
Retail samples for fermented beverages such as white wine, cider and kombucha, alongside soft drinks and sports nutrition beverage powder have been derivatized with the AccQ•Tag Ultra Derivatization Kit. The separation was performed using a previously established set of methods on an ACQUITY™ UPLC H-Class PLUS System with a Photo Diode Array (PDA) detector at a wavelength of 260 nm. An example quantitation was performed against the Amino Acids Food and Feed Standard Kit with norvaline as internal standard. Dilution factors for different beverages were optimized to provide users with further guidance for amino acid analysis in common beverages.
Benefits
Introduction
Beverages, especially those produced by fermentation, can vary widely in their free amino acid profiles, which can contribute to taste and therefore impact on consumer acceptance. Research into wine and beer production includes the analysis of chemical analytes for characterization such as the presence of amino acids. In beer brewing, amino acids have been measured to support taste profiling.1,2 Different strains of winery yeast3 and grape varieties4 have a strong impact on free amino acid profiles in wines. Nitrogen availability and utilization by wine yeast (Saccharomyces cerevisiae) significantly influence fermentation kinetics and the production of volatile compounds important for wine aroma.5 Reliable monitoring of those profiles during the complex process of wine maturation can provide a valuable tool in product development and characterization in wine research.
Different strains of micro-organisms lead to differences in flavor profiles, rooted in changes in amino acid profiles during of the fermentation process. Furthermore, strains of microorganisms have specific preferences on nitrogen sources which impact metabolite production like volatiles e.g. ethylacetate, propanol, acetaldehyde for example in tequila fermentation.6 Plant pathogenic fungi have been shown to produce altered levels of mycotoxins depending on available nitrogen sources and amino acids.7 Fungal products like gibberellic acid, penicillin, cephalosporin C, toxins like patulin and aflatoxins that are regulated by nitrogen availability,8 can have impacts on food safety in beverage manufacturing.
Other beverage manufacturing sectors such as sports nutrition and protein supplements also have a need to characterize production batches to source ingredient suppliers and ensure consistent product quality. The analysis of free amino acids can be lengthy with traditional HPLC methods or amino acid analyzers. The AccQ•Tag derivatization coupled to UPLC Analysis with optical detection provides a fast and reliable quality control application as well as a tool for food research to correlate metabolite production with free amino acid presence.
Experimental
Sample Preparation
Norvaline, which was used as an internal standard (p/n: 186009301) was reconstituted in 6 mL of 0.1 M HCl, giving a concentration of 0.25 μmol/mL. From this solution 10 µL was added to 60 µL of the supplied borate buffer in the AccQ•Tag Ultra Derivatization Kit prior to use. The buffer was then used to derivatize beverage samples according to the AccQ•Tag Ultra Derivatization Kit Care and Use Manual (715001331EN) with the modification of the borate buffer containing internal standard (Figure 1). A calibration line was prepared from the Amino acid food and feed standard kit (p/n: 186009299) which contains 21 amino acids. The standard is designed for both, identification and quantitative amino acid analysis. Instructions can be found in the Amino Acid Standard Kits Care and Use Manual (720006663EN). The derivatization was conducted in Waters Total Recovery Vials (p/n: 186000384C) allowing the reaction vessel to be directly transferred into the UPLC autosampler for seamless analysis and minimal reagent use. A minor modification to the derivatization workflow was included after the reaction mix was removed from the heater, it was allowed to cool down, followed by a short 10 second centrifugation at 500 rcf, which was performed by placing the vials in 15 mL plastic tubes to settle condensation. The ACQUITY UPLC H-Class PLUS System was set up with established Empower™ CDS software methods without any modifications required for this analysis. The default value for norvaline was adjusted to 25 µM in the processing method to reflect the above stated dilution and the default injection volume of 1 µL for this application.
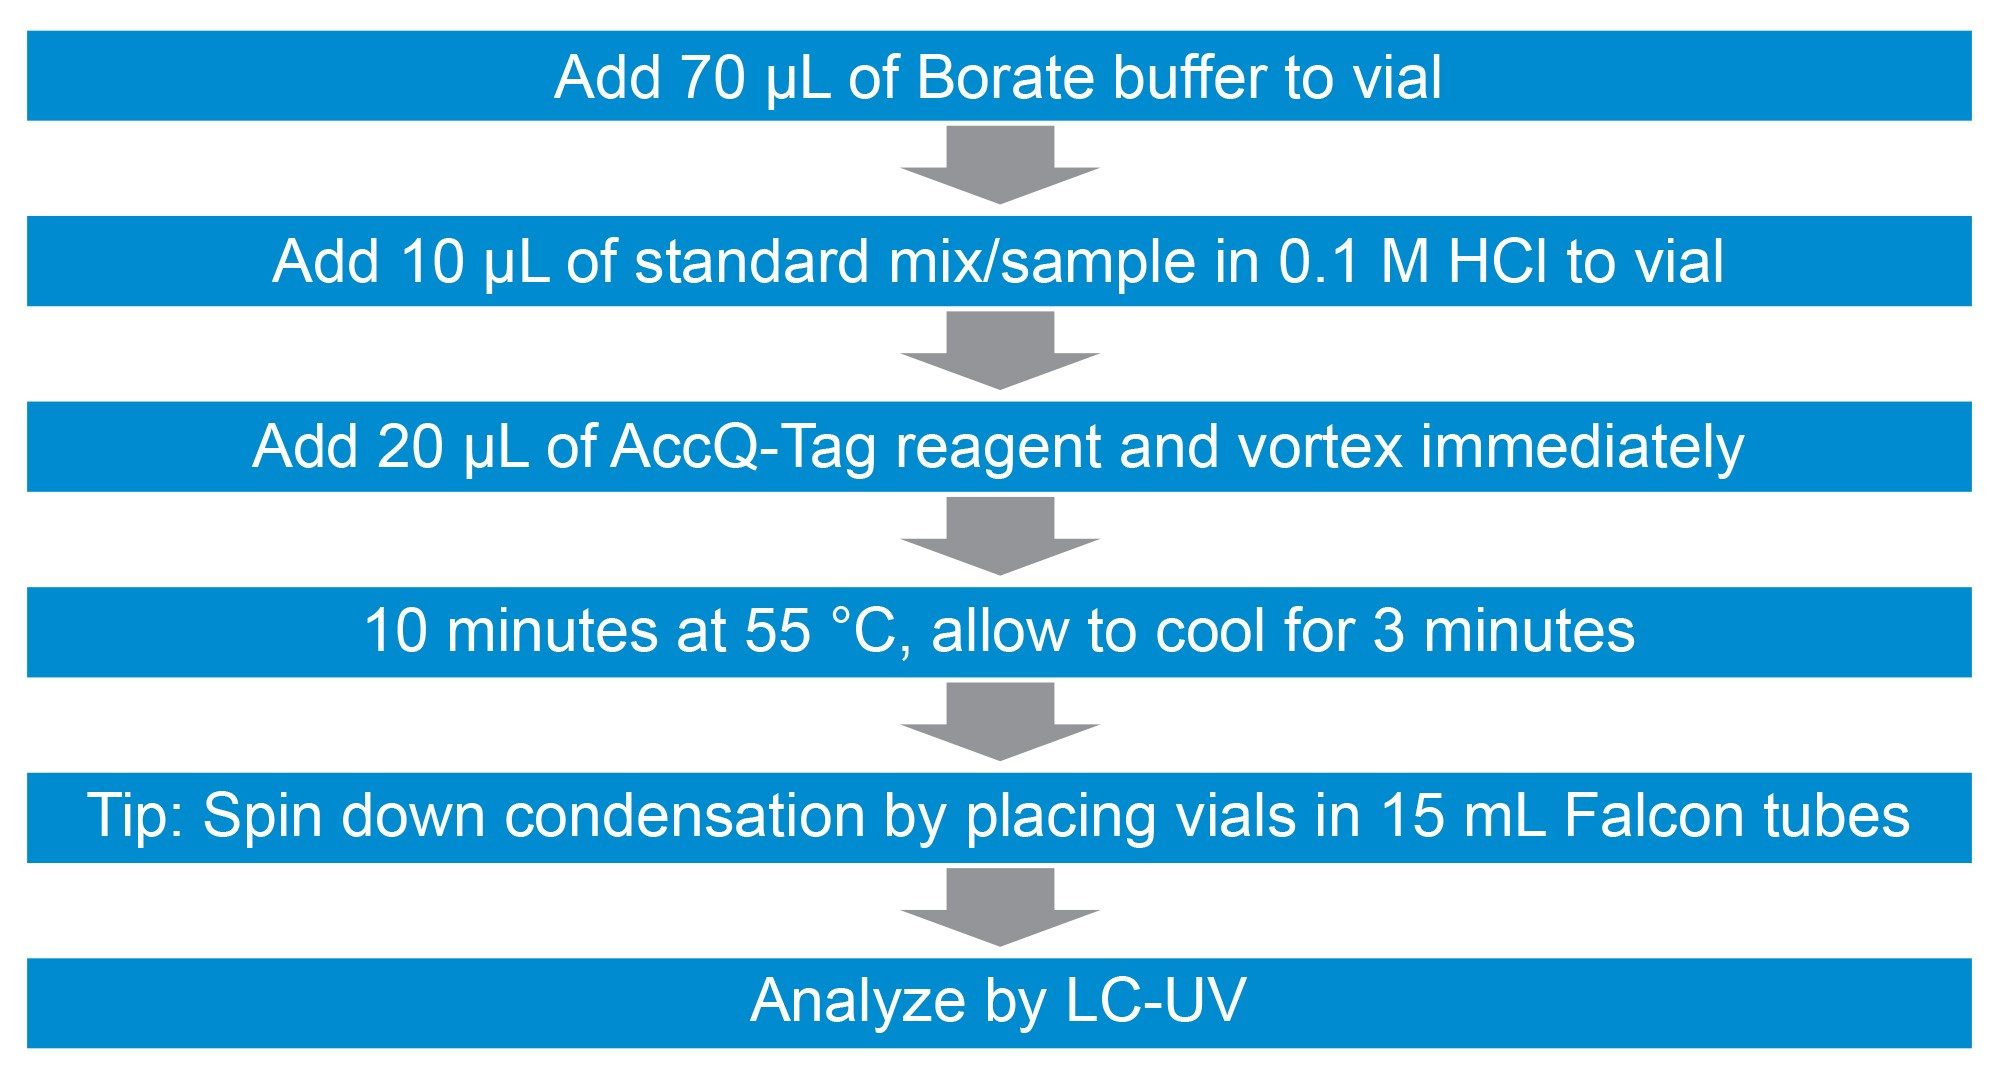 Figure 1. Derivatization workflow for liquid samples. Internal standard has been added to Borate buffer beforehand. Spinning down is not always required but can improve reproducibility if variable results are seen. If vials are not fully immersed in heating block, condensation might be seen.
Samples were run using bracketed calibration curves for quantitation. To account for varying amounts of the different amino acids and allow for adequate quantitation within the range of the calibration line we recommend derivatizing each liquid sample undiluted and as a 1:10, 1:20 and 1:100 dilution. Higher dilutions have not been necessary with the investigated liquid samples. The sports drink amino acid powder was diluted based on the manufacturers label for amounts of amino acids ranging 1–2 g per 5 g which resulted in 6.55 g powder diluted in 100 mL deionized water. The recommendation for dilution is 1:400 in deionized water for analysis. The dilutions that enable quantification of most amino acids in the given beverage samples are given in Table 1.
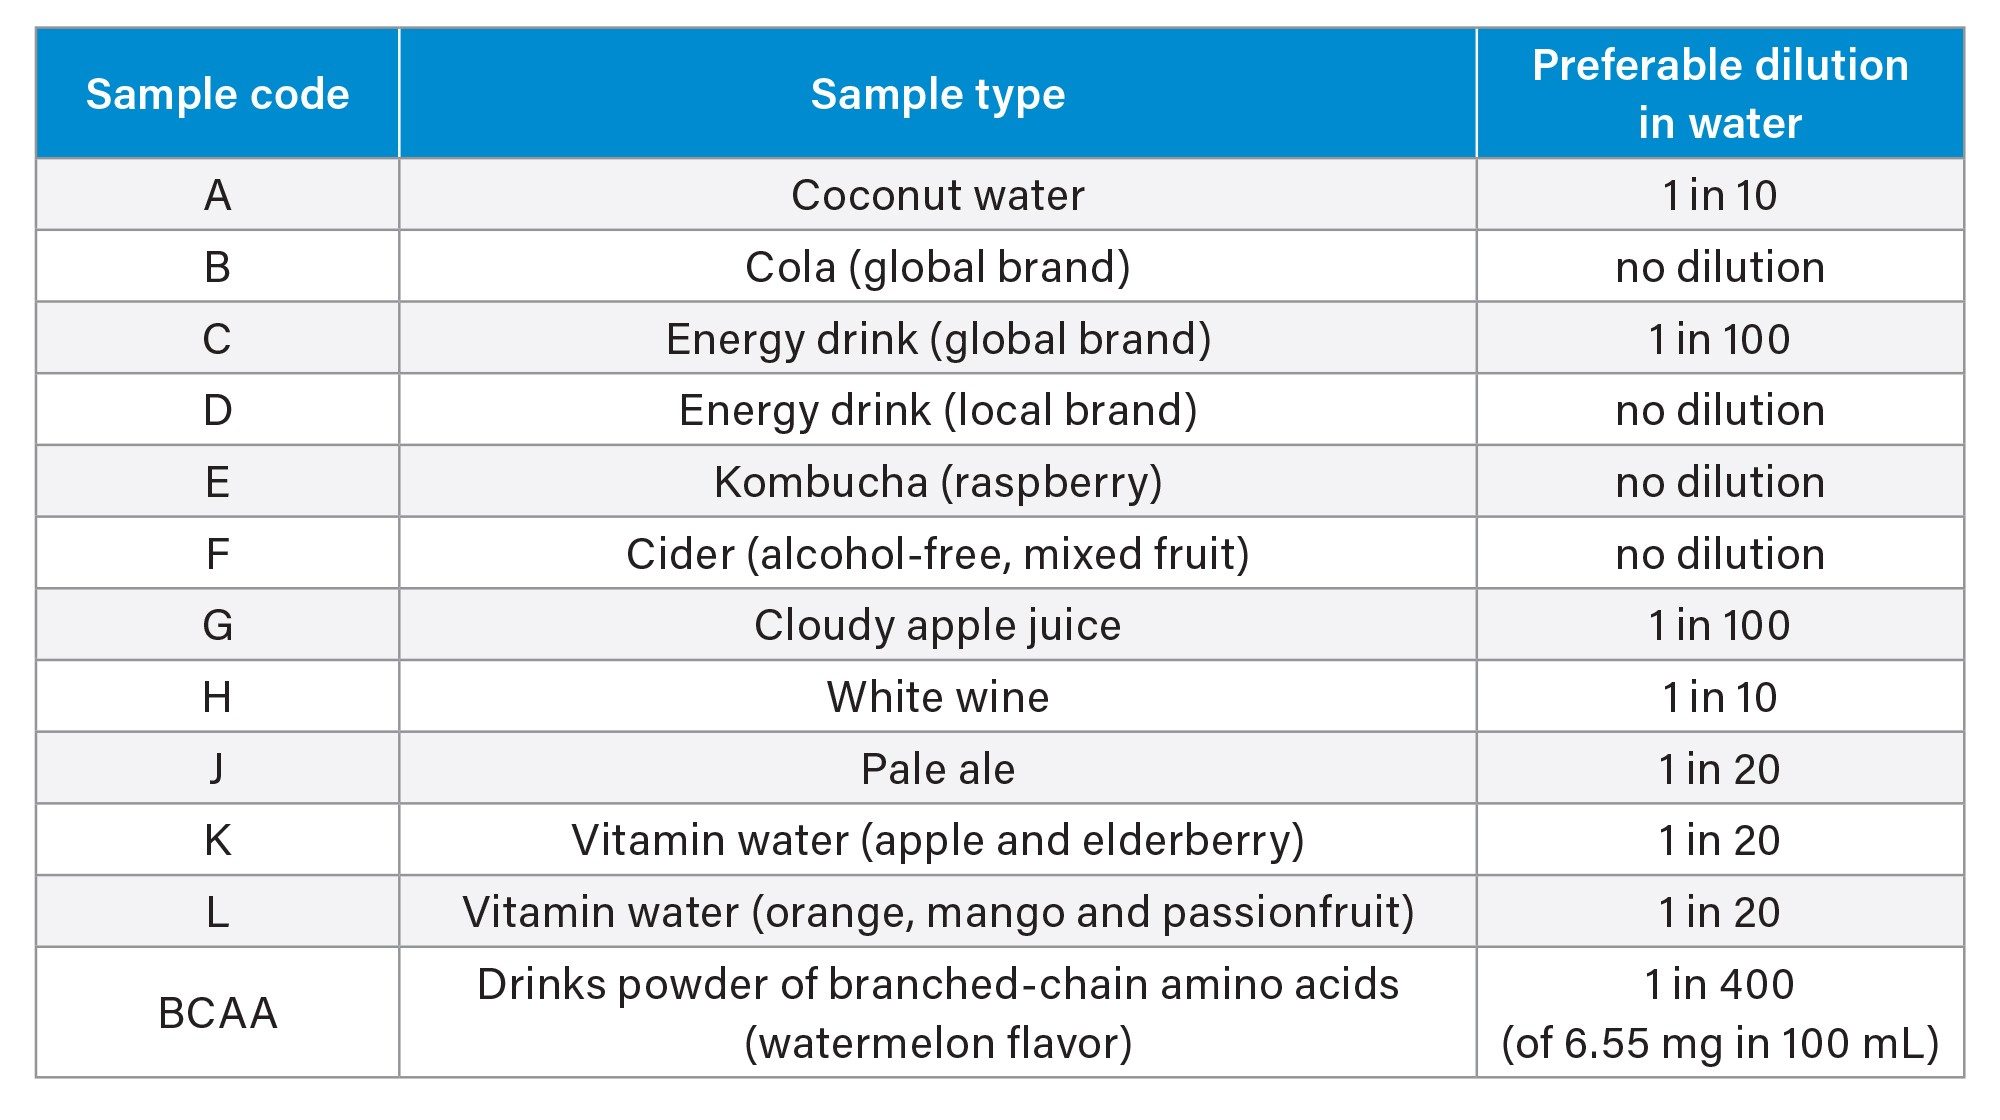 Table 1. Recommended dilutions that result in all or most of the amino acids of a sample type being within range of the calibration line.
The internal standard can be added to the Borate buffer before the start of the sample preparation. A stock mixture of 60 µL Borate buffer was prepared with 10 µL Norvaline solution as mentioned above (250 µM if reconstituted with 6 ml 0.1 M HCl as per manufacturer’s instructions) per sample which results in a concentration of 2500 pmol norvaline in 100 µL reaction volume per vial. With an injection volume of 1 µL for this method, this approach results in 25 µM, which needs to be adjusted in the Empower processing method from the default value of 1 µM.
Unknown Peak Investigation
Three standard incubations of asparagine were carried out: 1) in water 2) in 0.1 M HCl in water 3) in apple juice at 500 pmol of asparagine per derivatization. The amount of 500 pmol was drawn as a middle range value from Table 2 which states optimal sample amounts AccQ•Tag derivatization for different recommended by Waters.
 Table 2. Recommended sample amounts in 10 µl sample volume for AccQ•Tag derivatization. The amounts given in this table are only relevant if hydrolysis experiments are to be conducted, for example, for further investigation of protein bound amino acids in the same sample.
Gradient
The gradient food and feed from the Waters Empower method set which is supplied with the AccQ•Tag Solution has been used.
Results and Discussion
Seven-point, bracketed calibration curves were run with all sample sets. R2 ranged from 0.984 (MetSO2)) to 0.9999 (Val, Ile, Leu, Ser, Thr, Pro). An example calibration line is given in Figure 2 after processing with the supplied method in Empower Software. Typical results for calibration line correlation coefficients are provided using Figure 3 as a screenshot of Empower software processing.
 Figure 2. Calibration line of Threonine.
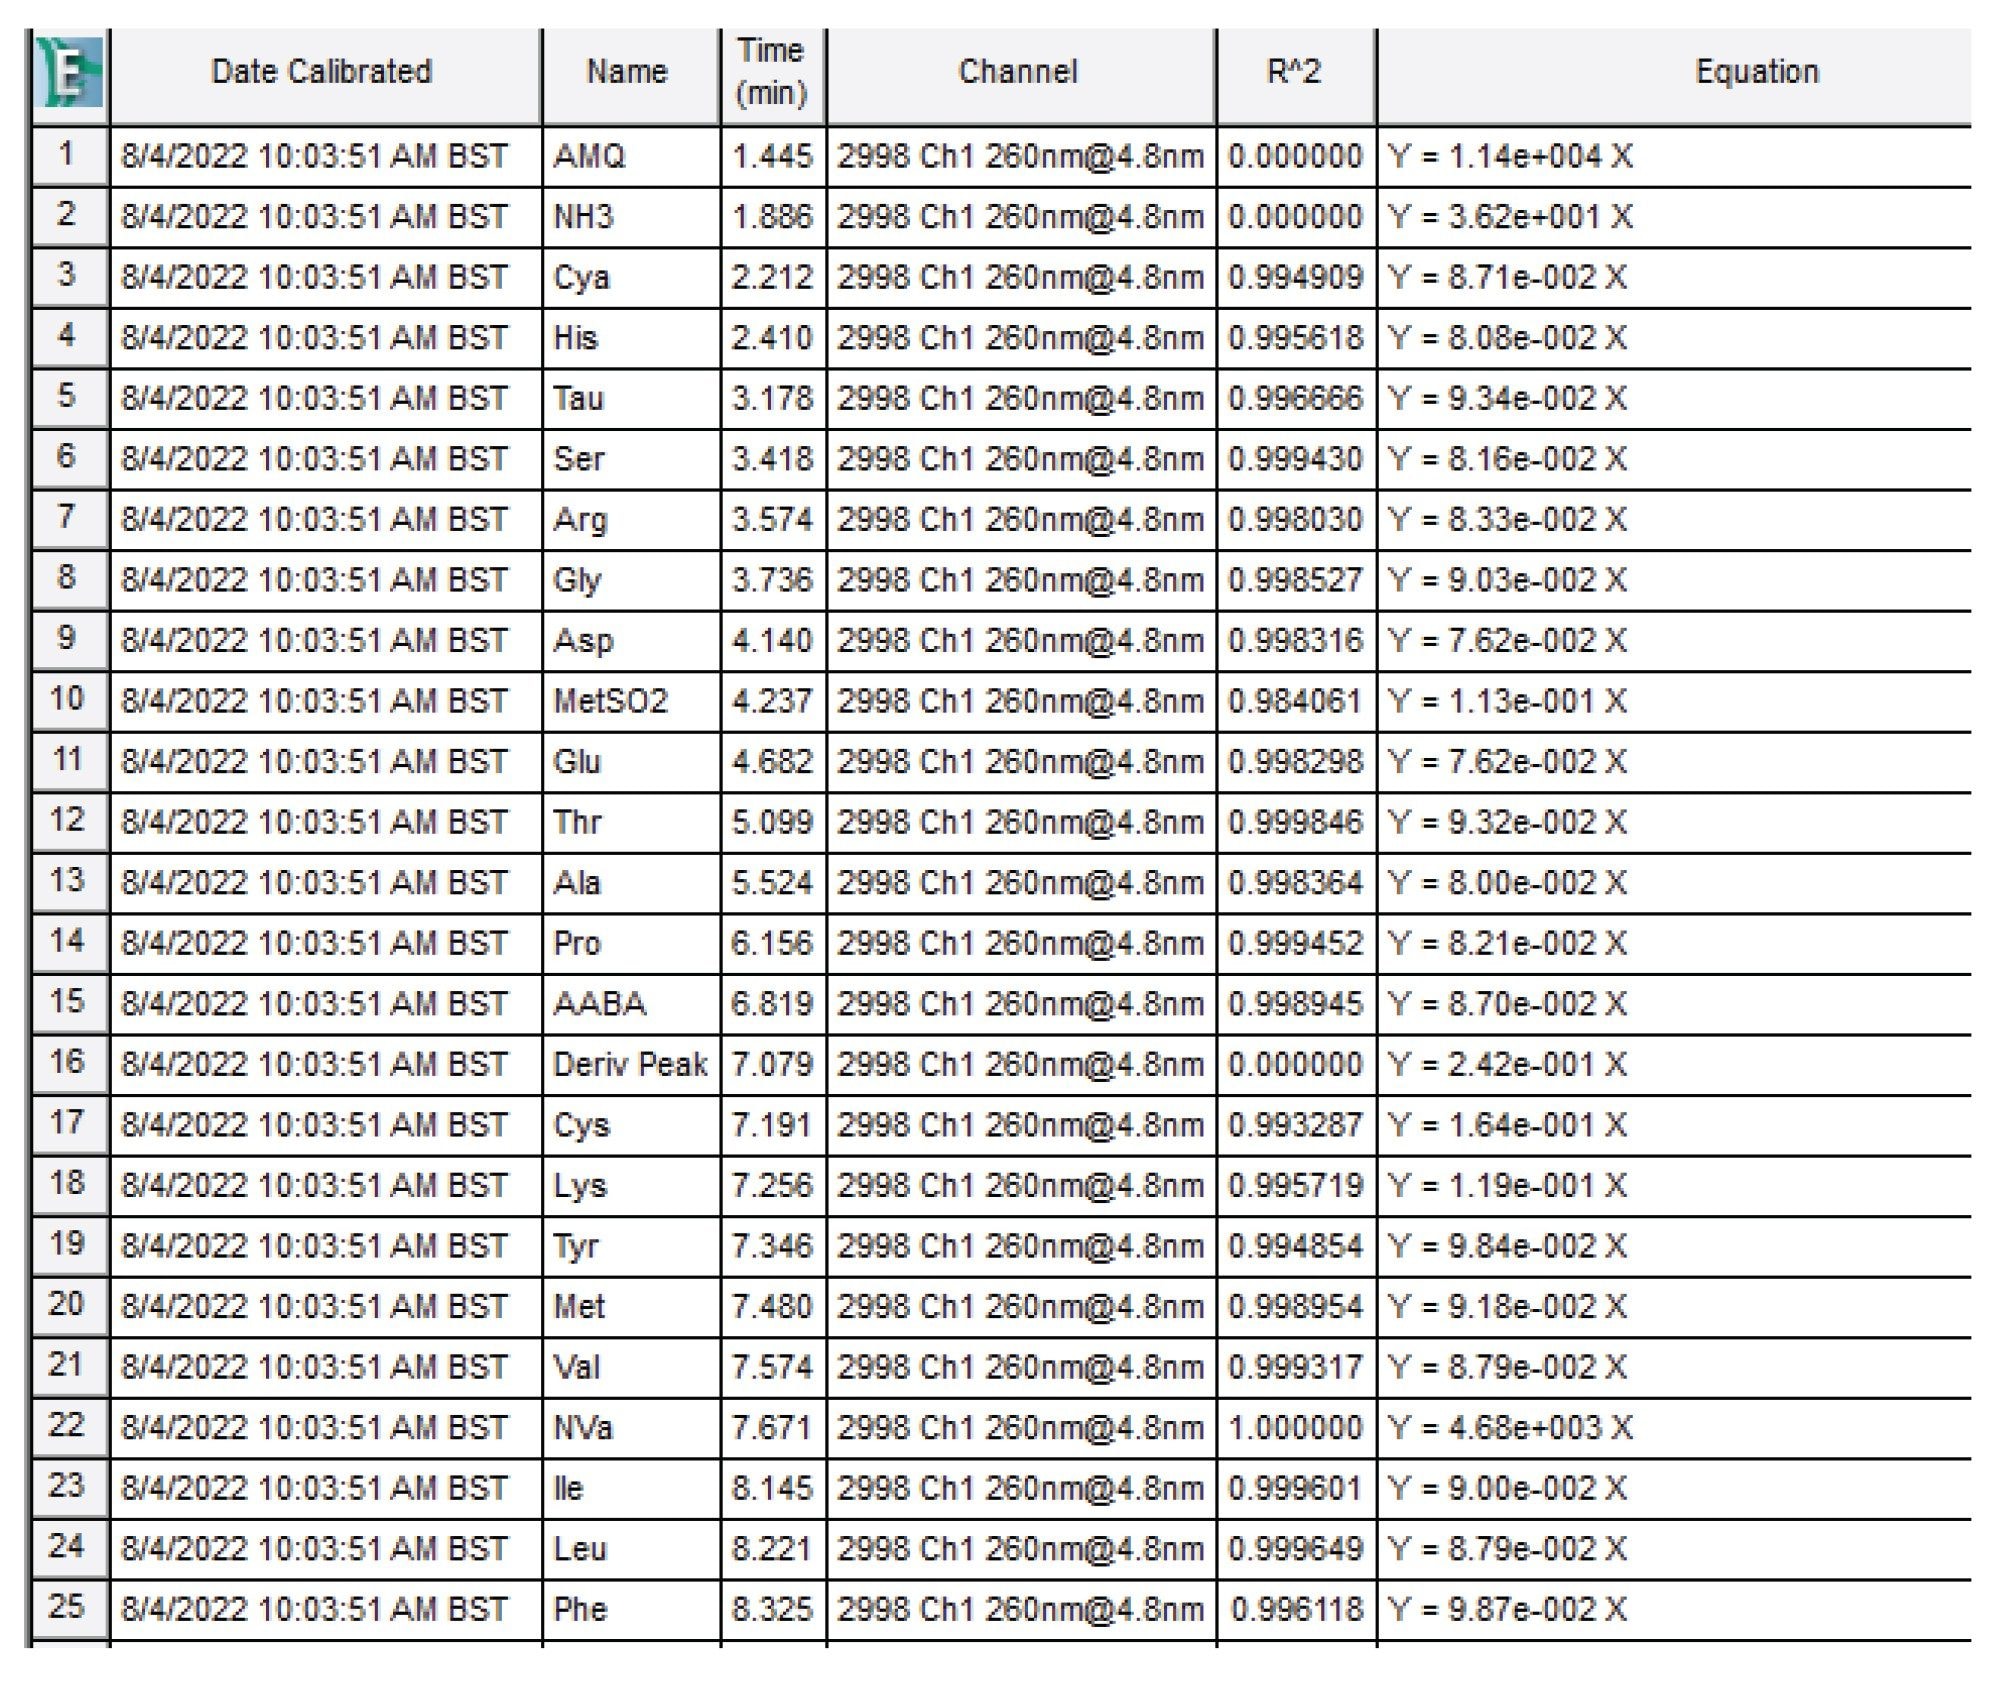 Figure 3. Results of the calibration of individual analytes. 21 standards are contained in the Amino acid food and feed standard kit. AMQ, abbreviation for 6-Aminoquinolone, (AccQ•Tag reagent that has reacted with water), NH3 and the derivatization peak (bis-aminoquinoline urea) are included in the provided method. Norvaline (NVa) was added to the method as the chosen internal standard showing an R2 = 1. The concentration range for all analytes was 0.5–500 µM for all amino acids except cystine (0.25–250 µM).
A triplicate derivatization of the standard showed low standard deviation for technical replicates with an average of 4% when calculated for area count for the analyzed compounds. The derivatization is fast and can be carried out in a conventional heating block using Waters Total Recovery Vials which are then transferred into the UPLC autosampler either on the same day or after storage at room temperature for up to one week. This gives the analyst some flexibility in scheduling sample analysis without the need to re-prepare samples.
Figure 4 shows typical chromatograms of undiluted beverages to provide an overview of compounds present in the investigated products. Samples were quantified with the provided Empower CDS methods sets but due to the lack of reference materials to enable results comparison, only the results for taurine are shown and compared to the label. The calculated taurine content in sample C (energy drink) was 0.44 g/100 mL which closely matches the stated amount on the product label of 0.4 g/100 mL.
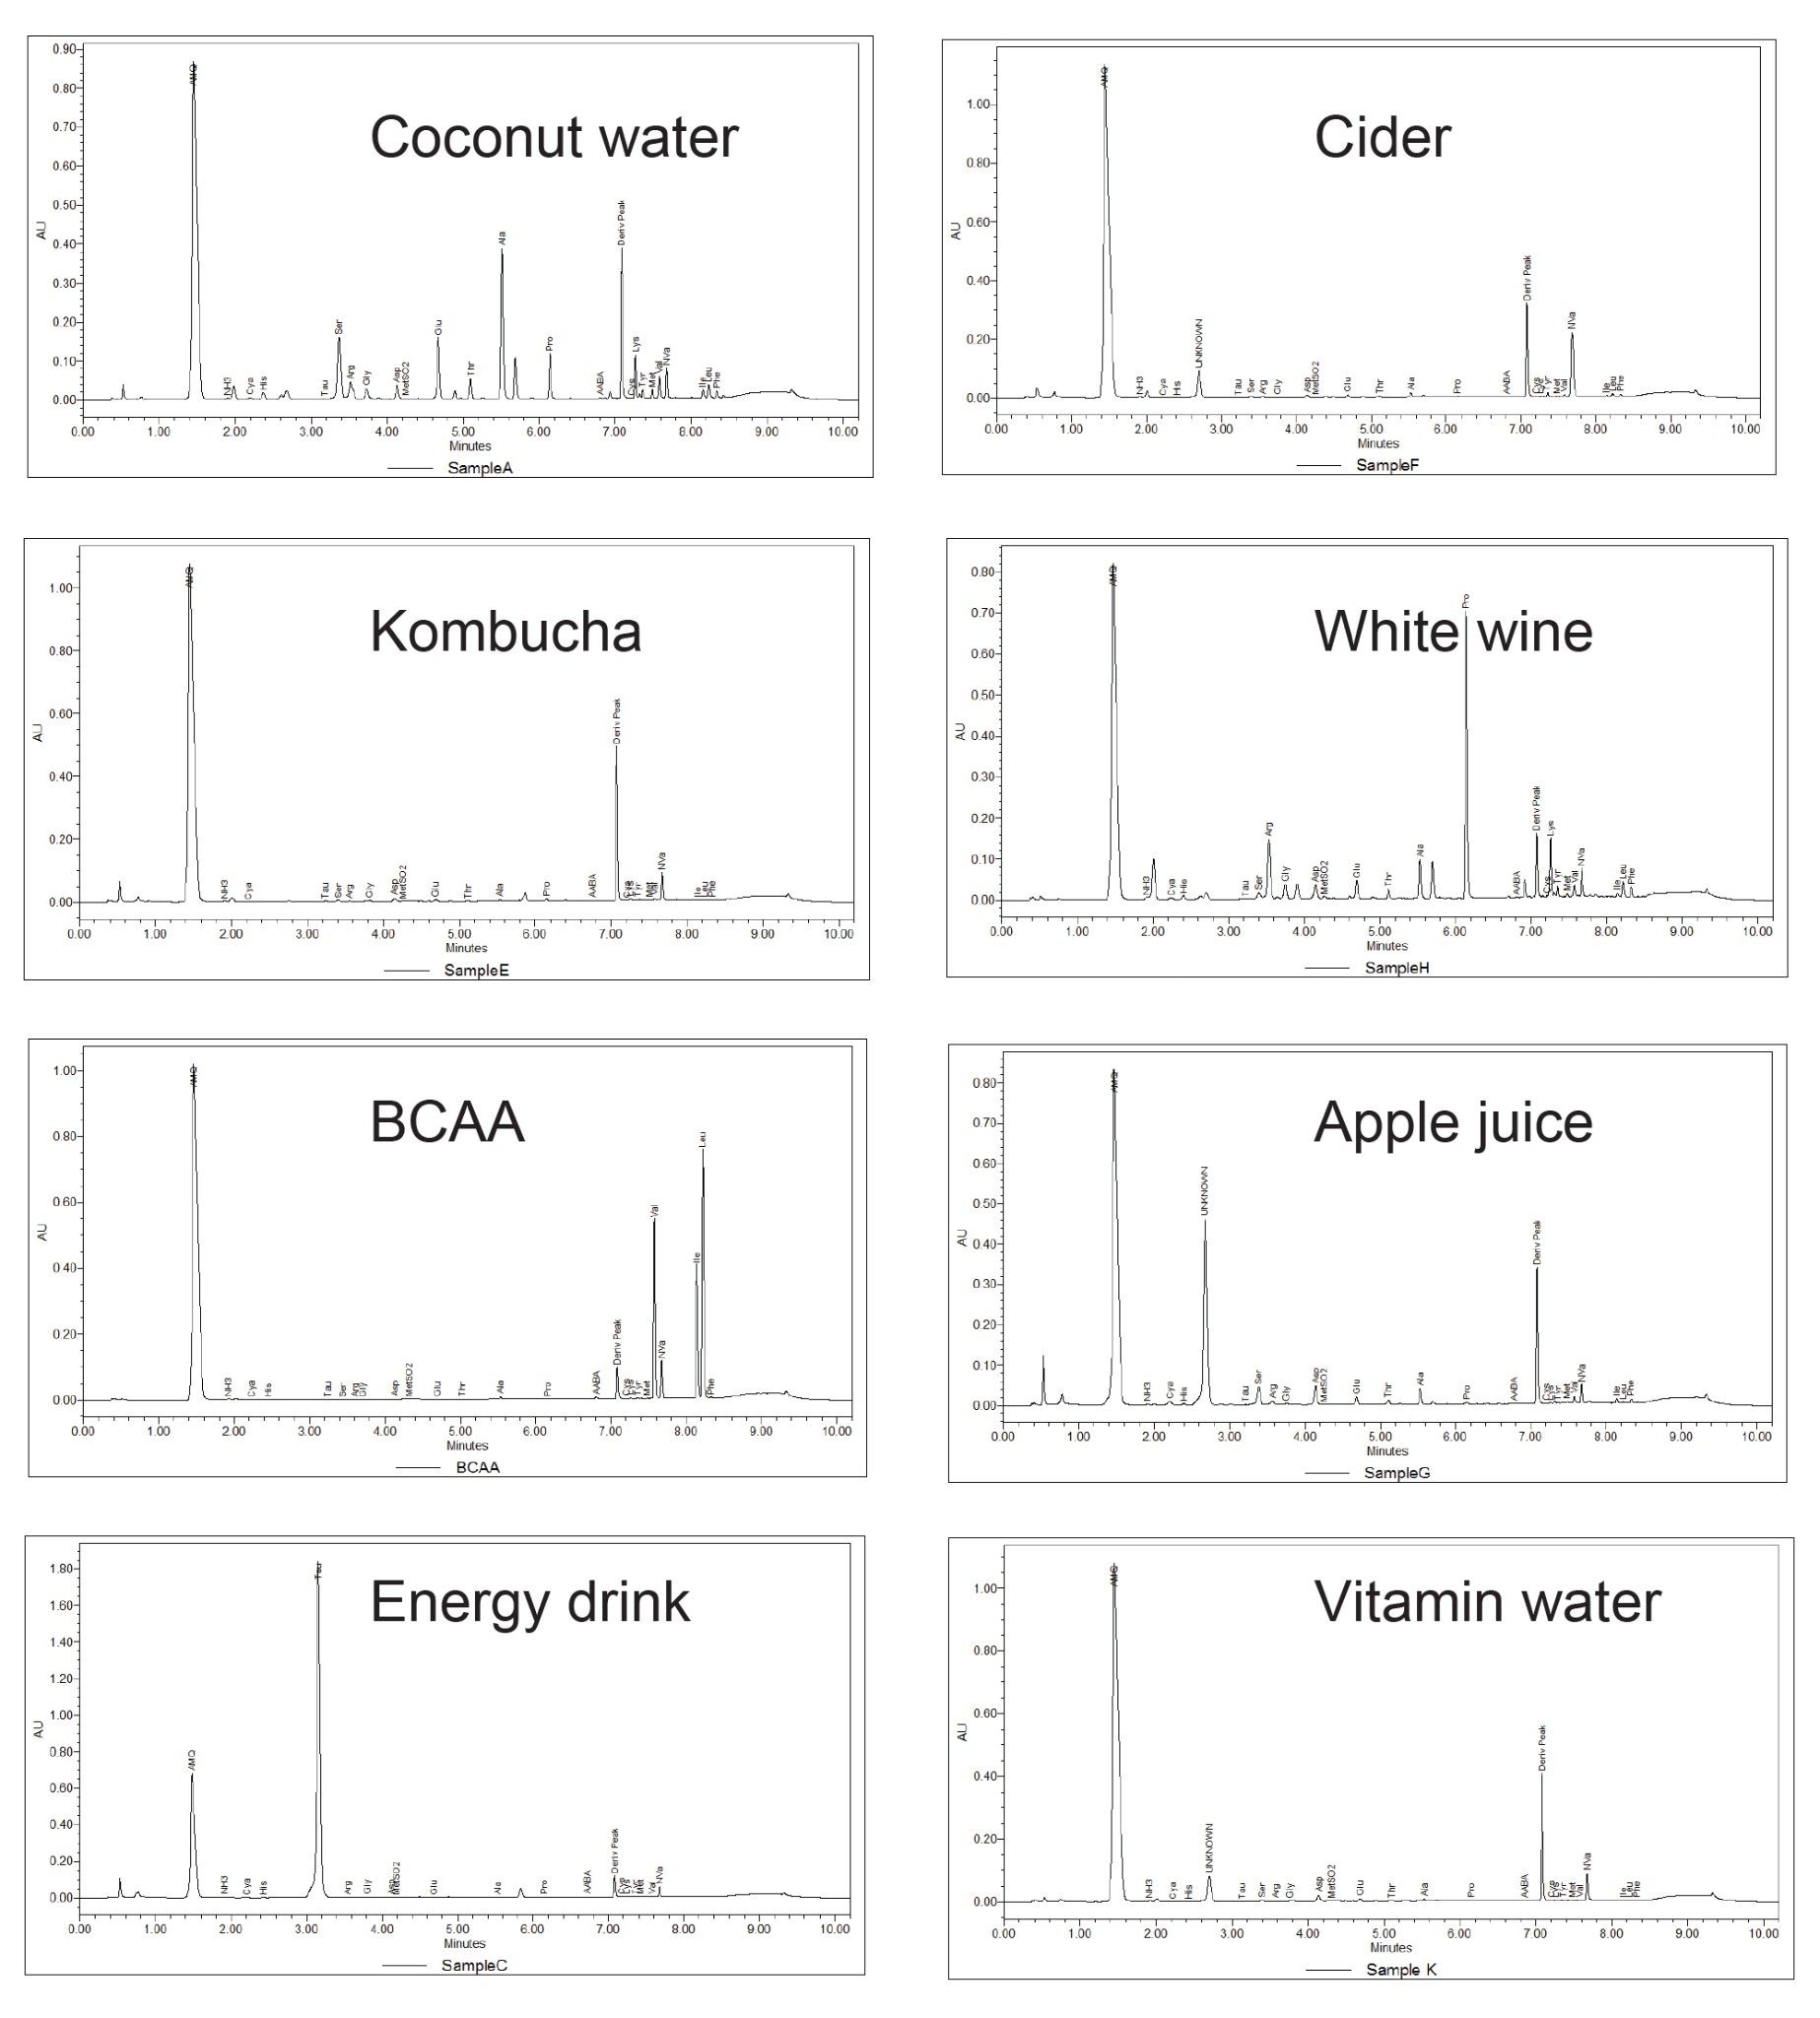 Figure 4. Typical chromatograms of derivatized undiluted beverage samples.
Three analyzed products containing apple (apple juice, cider, apple & elderberry vitamin water) showed a high intensity, common unidentified peak eluting between Histidine and Taurine (Figure 5). L-Asparagine, L-aspartic acid and L-glutamine were previously identified with AccQ•Tag Ultra Derivatization Kit as the principal amino acids observed in most apple juices.(9) Based on the elution time the unknown peak was suspected to be asparagine. This could be confirmed by an injection of a single standard derivatization of asparagine with AccQ•Tag Ultra Derivatization Kit (data not shown) carried out in three different sample solvents. A common issue with AccQ•Tag derivatization is the presence of several amine groups in a reference standard and that can lead to double-peaks (for example asparagine). To investigate peak identities, it is recommended to perform the incubation in concentration ranges within the calibration curve to achieve an excess ratio of derivatization agent compared to the sample as well as to bring the reference standard incubation close to the sample pH. If hydrolysates of proteins or peptides were to be investigated we recommend the amounts stated in Table 2 (derived from Waters internal documentation).
 Figure 5. Overlay of unknown peak found in products containing apple. Sample G had high amounts of the unknown peak and was diluted for this comparison, Sample F-Cider, Sample G-Cloudy apple juice, Sample K-Vitamin water Apple & Elderberry.
Conclusion
The AccQ•Tag Amino Acid Solution provides an ‘out of the box’ application for faster method development with a comprehensive software processing package that still offers flexibility of instrument use compared to dedicated amino acid analysers. With a minor modification (centrifugation step) to the sample preparation a wide range of beverage samples were tested, and linearity of the detection was investigated in a seven-point calibration curve. For the identification of unknowns, we provide recommendations for the investigation of reference standards which help with faster confirmation of investigated peaks. Free amino acid analysis in beverages is a straight-forward approach with minimal sample preparation that requires only dilution of liquid samples to bring all investigated analytes into the concentration range of the calibration standards before derivatization. The AccQ•Tag Ultra Derivatization and UPLC separation ensure a reproducible and reliable analytical solution for routine analysis of amino acids as an easy method adoption with minimal method development for busy laboratories in quality control and fermented beverage research.
References
- Bauwens J, Van Opstaele F, Eggermont L, Weiland F, Jaskula-Goiris B, De Rouck G, et al. Comprehensive analytical and sensory profiling of non-alcoholic beers and their pale lager beer counterparts. J Inst Brew. 2021 Jan 1;127(4):385–405. Available from: https://onlinelibrary.wiley.com/doi/full/10.1002/jib.664.
- Benvenuti ME, Hong P. Determination of Amino Acids in Beers Using the UPLC Amino Acid Analysis Solution. Waters Application Note, 720002158, 2007.
- Fiechter G, Mayer HK. UPLC analysis of free amino acids in wines: profiling of on-lees aged wines. J Chromatogr B Analyt Technol Biomed Life Sci. 2011 May 15; 879(17–18):1361–6. Available from: https://pubmed.ncbi.nlm.nih.gov/21371950/.
- Hernández-Orte P, Peña-Gallego A, Ibarz MJ, Cacho J, Ferreira V. Determination of the biogenic amines in musts and wines before and after malolactic fermentation using 6-aminoquinolyl-N-hydroxysuccinimidyl carbamate as the derivatizing agent. J Chromatogr A. 2006 Oct 6; 1129(2):160–4. Available from: https://pubmed.ncbi.nlm.nih.gov/16876810/.
- Fairbairn S, McKinnon A, Musarurwa HT, Ferreira AC, Bauer FF. The impact of single amino acids on growth and volatile aroma production by Saccharomyces cerevisiae strains. Front Microbiol. 2017 Dec 19; 8(DEC):2554. Available from: /pmc/articles/PMC5742263/.
- Arrizon J, Gschaedler A. Effects of the addition of different nitrogen sources in the tequila fermentation process at high sugar concentration. J Appl Microbiol. 2007 Apr;102(4):1123–31.
- Bouras N, Holtz MD, Aboukhaddour R, Strelkov SE. Influence of nitrogen sources on growth and mycotoxin production by isolates of Pyrenophora tritici-repentis from wheat. Crop J. 2016 Apr 1;4(2):119–28.
- Barrios-Gonzalez J. Secondary Metabolites Production. Curr Dev Biotechnol Bioeng. 2018; 257–83.
- Ma S, Neilson AP, Lahne J, Peck GM, O’Keefe SF, Stewart AC. Free amino acid composition of apple juices with potential for cider making as determined by UPLC-PDA. J Inst Brew. 2018 Oct 1; 124(4):467–76. Available from: https://onlinelibrary.wiley.com/doi/full/10.1002/jib.519.
720007707, August 2022