Determination of Pesticide Residues in Wheat Flour and Cucumber After Extraction With QuEChERS and Clean-up With Oasis™ PRiME HLB SPE
Abstract
In this application note we describe the transfer of an established UPLC™ method onto a CORTECS™ T3 Column, assessing overall method performance by validating this approach using high-water and high-starch content food commodities, namely cucumber and wheat flour. The use of the CORTECS™ T3 Column generates significantly lower back pressure, allowing for a LC system with decreased performance specifications to be used. Using the Xevo™ TQ-S cronos for detection, we demonstrate that similar method performance can be achieved for a selection of representative pesticides at 0.01 mg/kg, the typical EU default pesticide MRL in these food commodities. A pass-through SPE with Oasis™ PRiME HLB was utilized for this approach, which offered a quick and effective alternative to dispersive SPE. The method was successfully validated using the SANTE guidelines. Results from analysis of spikes at both 0.01 and 0.1 mg/kg showed that for cucumber and wheat flour, 94% and 99% of analytes passed the validation criteria, with overall %RSDs for cucumber of 3.6%, and 4.6% for wheat flour respectively.
Benefits
Oasis PRiME HLB technology provides a quick and simple alternative to a dispersive SPE workflow, whilst maintaining excellent recoveries for the pesticides of interest.
The ACQUITY Arc™, in combination with the CORTECS T3 Column, offers a UHPLC method that gives comparable run times, and method performance to UPLC multi-residue methods.
The Xevo TQ-S cronos provides a sensitive and robust analysis for over 150 pesticides in one analytical method, at the typical EU default MRL of 0.01 mg/kg.
Introduction
Pesticides are an essential safeguard to the modern food ecosystem, helping to stabilize food supply by suppressing pests, weeds, and disease. However, excessive or unlawful use of pesticides on agricultural crops and in produce destined for human consumption can result in inadmissibly high levels of these compounds, which can pose adverse risk to human health.1 As a result, Maximum Residue Levels (MRLs) have been established within the EU to oversee pesticides in raw agricultural commodities, where approved pesticides are applied in accordance with Good Agricultural Practice.2 For many pesticides a default MRL of 0.01 mg/kg is used within the EU when the product is not authorized for use on a food commodity, and this is generally the target method limit of quantification used when establishing an analytical pesticide method.
Here we describe the performance of a robust, quantitative method for the routine determination of a range of LC-amenable pesticides in food commodities belonging to commodity groups 1 and 5 defined under SANTE/11312/2021.3 Following QuEChERS sample preparation and clean-up with an Oasis PRiME HLB SPE Cartridge (p/n: 186008887), analysis was performed with an ACQUITY Arc System coupled to the Xevo TQ-S cronos Tandem Quadrupole Mass Spectrometer.4 Pass-through clean-up with the Oasis PRiME HLB SPE Cartridge can be a quick and effective alternative to traditional dispersive SPE, following extraction using the QuEChERS CEN approach. The sensitivity and robustness of the Xevo TQ-S cronos is shown, presenting suitability for the simultaneous quantitative determination of many pesticides in compliance with the default EU MRL of 0.01 mg/kg. The unique reverse cone design of the TQ-S cronos helps to reduce matrix aggregation, increasing the up-time of the instrument.
The objective of this work was to demonstrate ease of method transfer of a UPLC to UHPLC chromatographic method, while maintaining expected performance and sensitivity required for pesticide analysis. The CORTECS T3 Column generates significantly lower back pressure, allowing for a LC system with decreased performance specifications to be used. The column’s superficially porous silica particle morphology offers high efficiency and provides excellent peak shape, giving longer column lifetime ideal for supporting high throughput multi-residue methods.
Experimental
Samples of wheat flour and cucumber were purchased at a local retail outlet and screened to ensure an absence of target pesticide residues. These matrices were selected as representative samples of high-starch and high-water content commodity groups respectively. Samples were homogenized, with the cucumber sample stored at -20 °C and the wheat flour stored at room temperature.
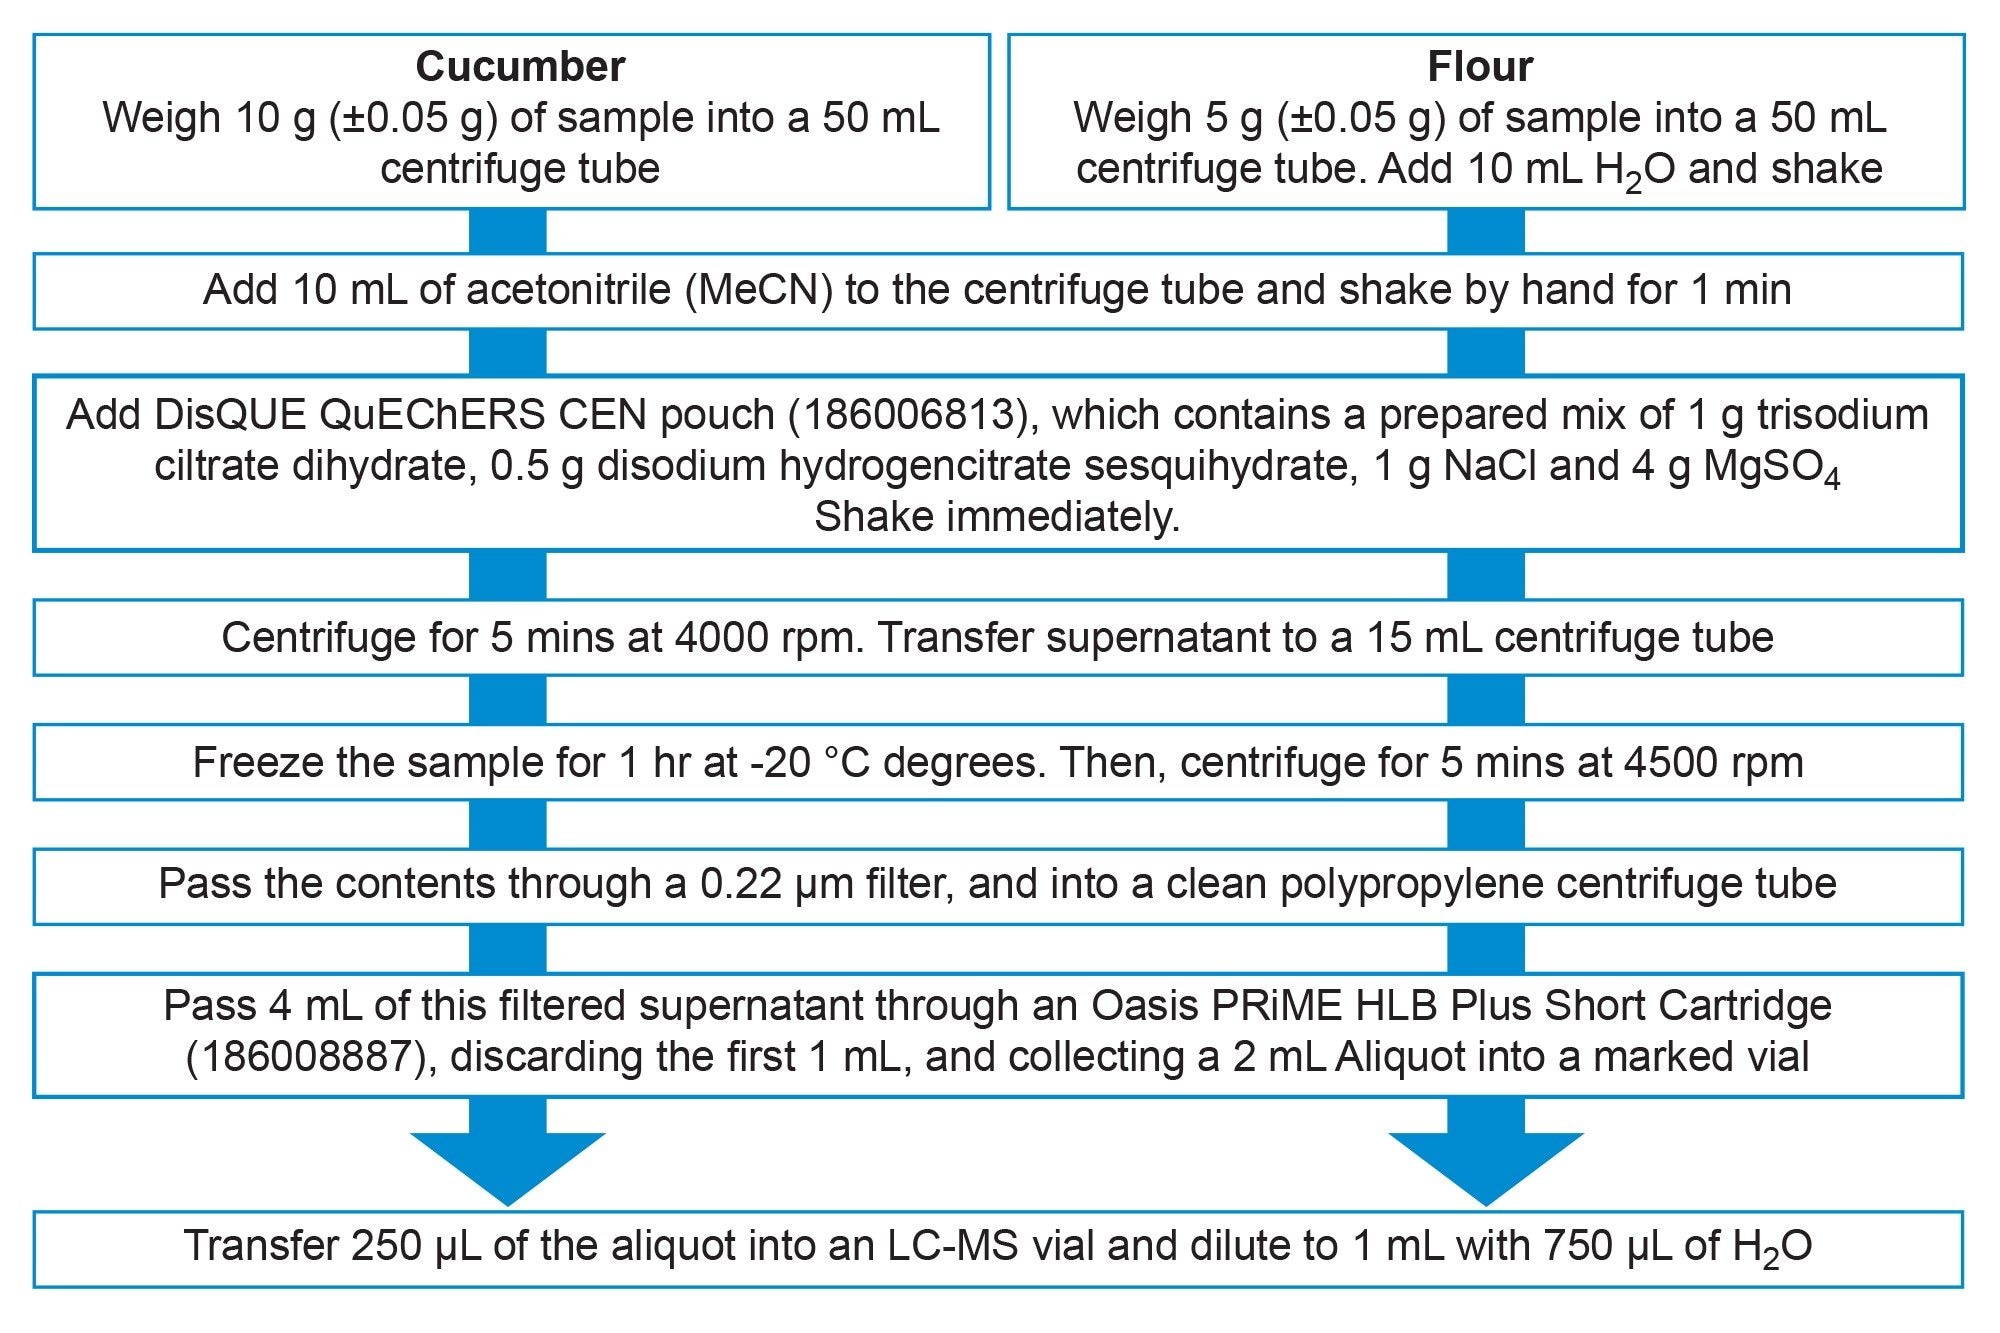
Samples were extracted using a modification of the QuEChERS CEN Method 15662 where the dSPE step was replaced by pass-through SPE, using the Oasis PRiME HLB Short Plus Cartridge (see Figure 1).5 Following routine QuEChERS extraction, approximately 4 mL of supernatant was passed through an Oasis PRiME HLB Plus Short Cartridge. Discarding the first 1 mL, the following 2 mL aliquot was collected in a marked vial. 250 µL of this sample was then diluted to 1 mL with 750 µL of H2O in an LC-MS vial ready for injection.
Samples were spiked at 0.01 mg/kg and 0.1 mg/kg, with 5 replicates at each level for both sample types of cucumber and wheat flour for the method validation study. Linearity was assessed using solvent and matrix matched standards (MMS), with calibration curves created – ranging from 0.005 mg/kg to 0.5 mg/kg (equating to in-vial concentrations of 0.00125–0.125 µg/mL for cucumber, and 0.000625–0.0625 µg/mL in wheat flour).
This UHPLC method was generated from an existing UPLC method, using the Columns Calculator 2.0 Software shown in Figure 2 (667005222).6 Specifications for the CORTECS T3 Column, 120 Å, 2.7 µm, 2.1 mm x 100 mm, were used to translate the existing LC method. The software allowed for verification that an exact translation of this method was within the maximum pressure limit of the system configuration, thus allowing for flow rate and run times to mirror UPLC conditions.
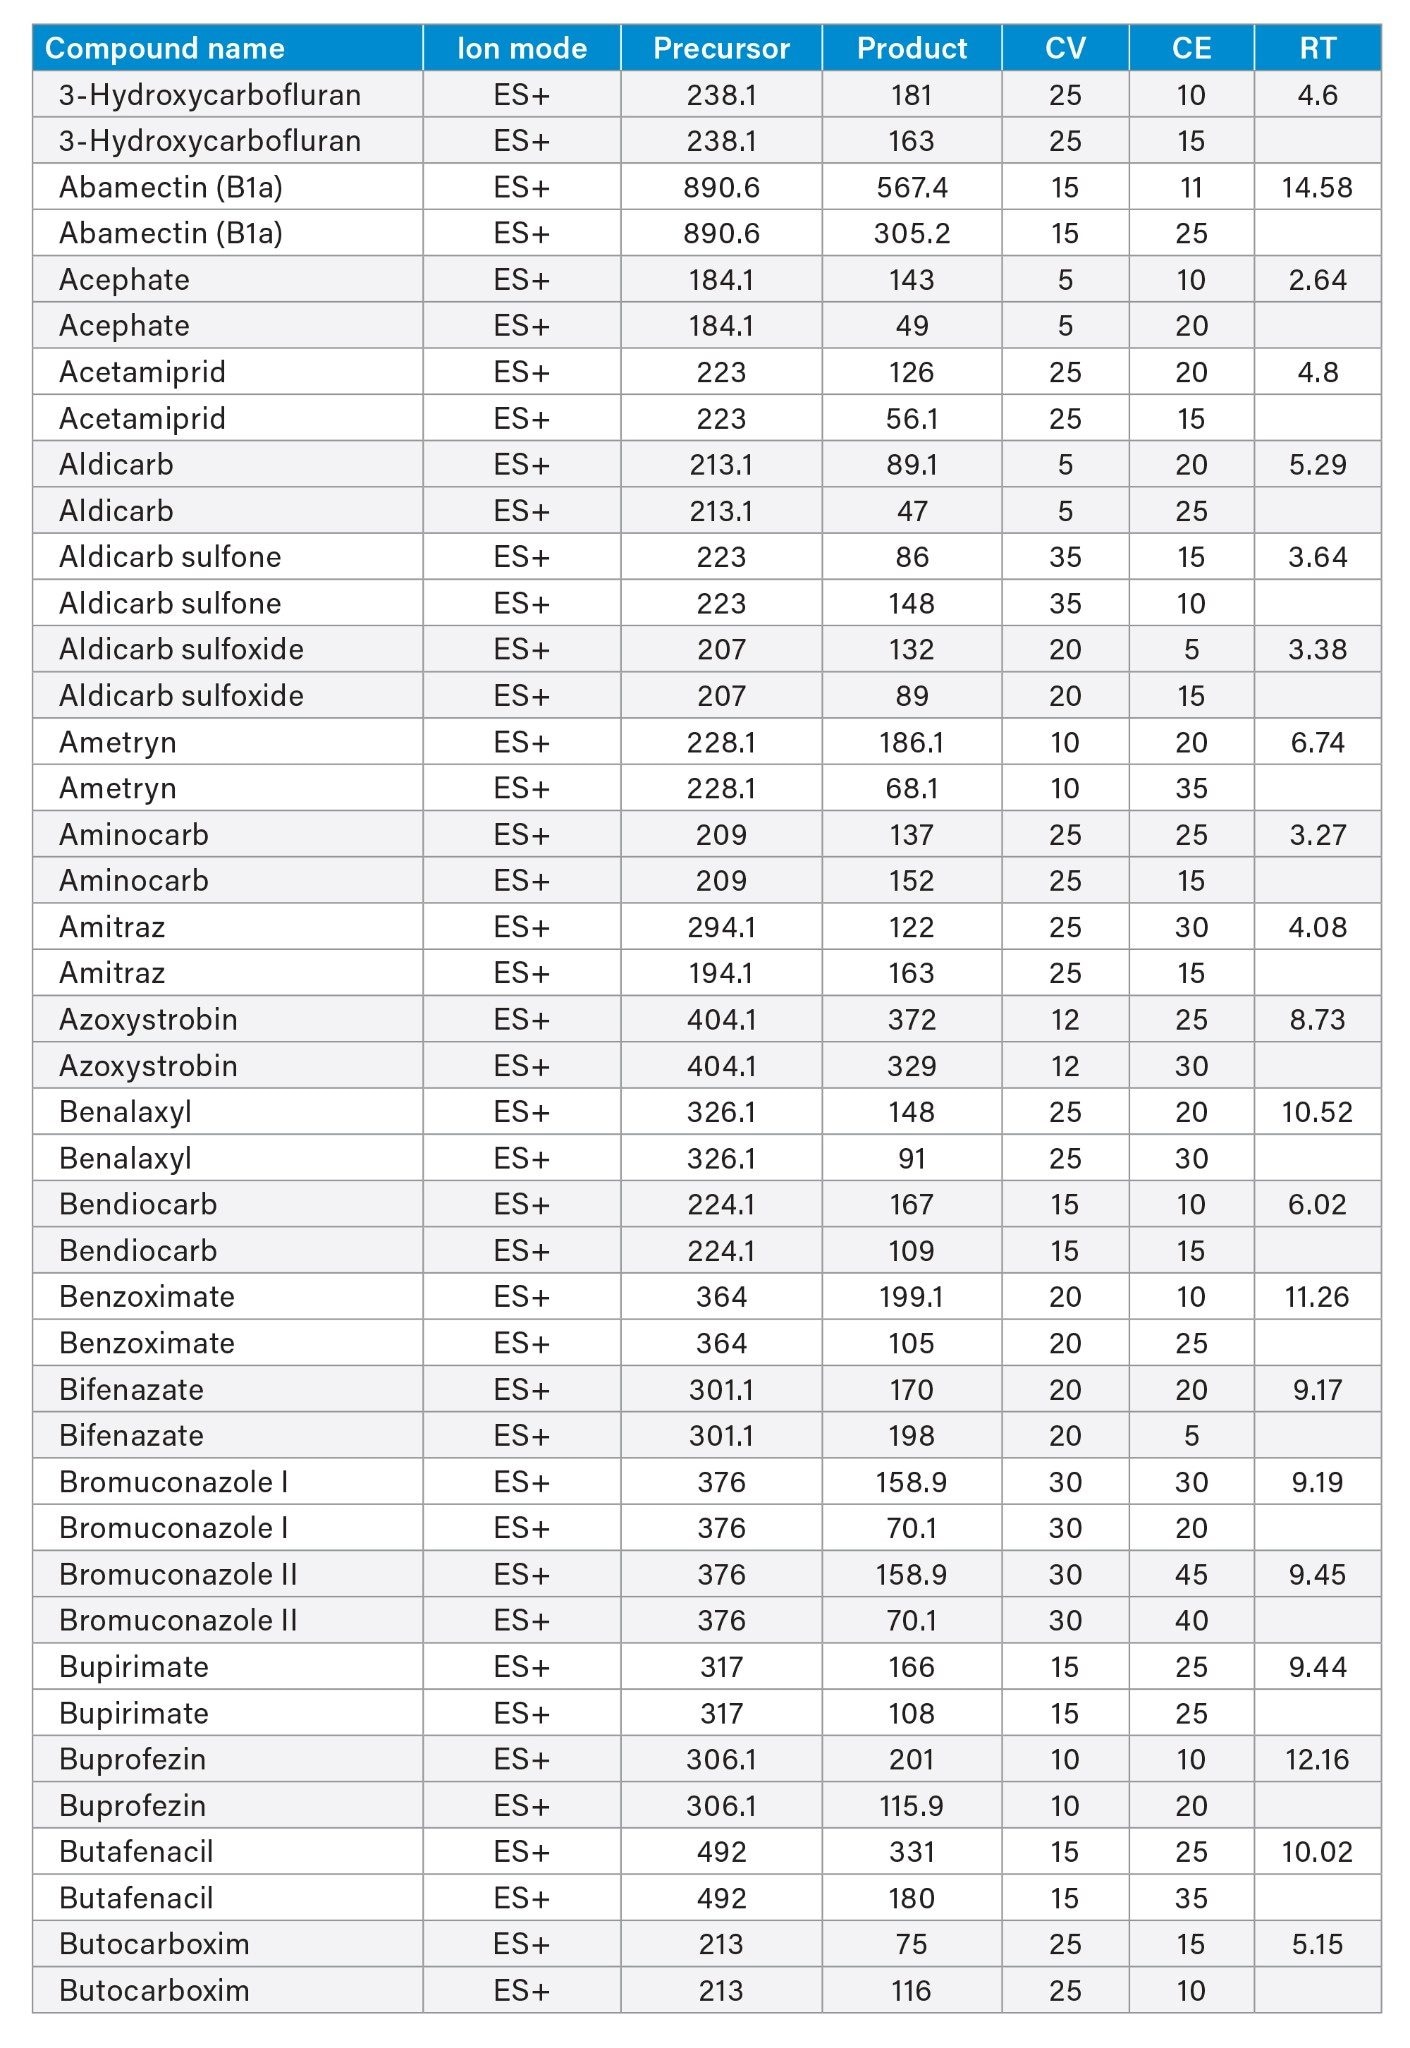
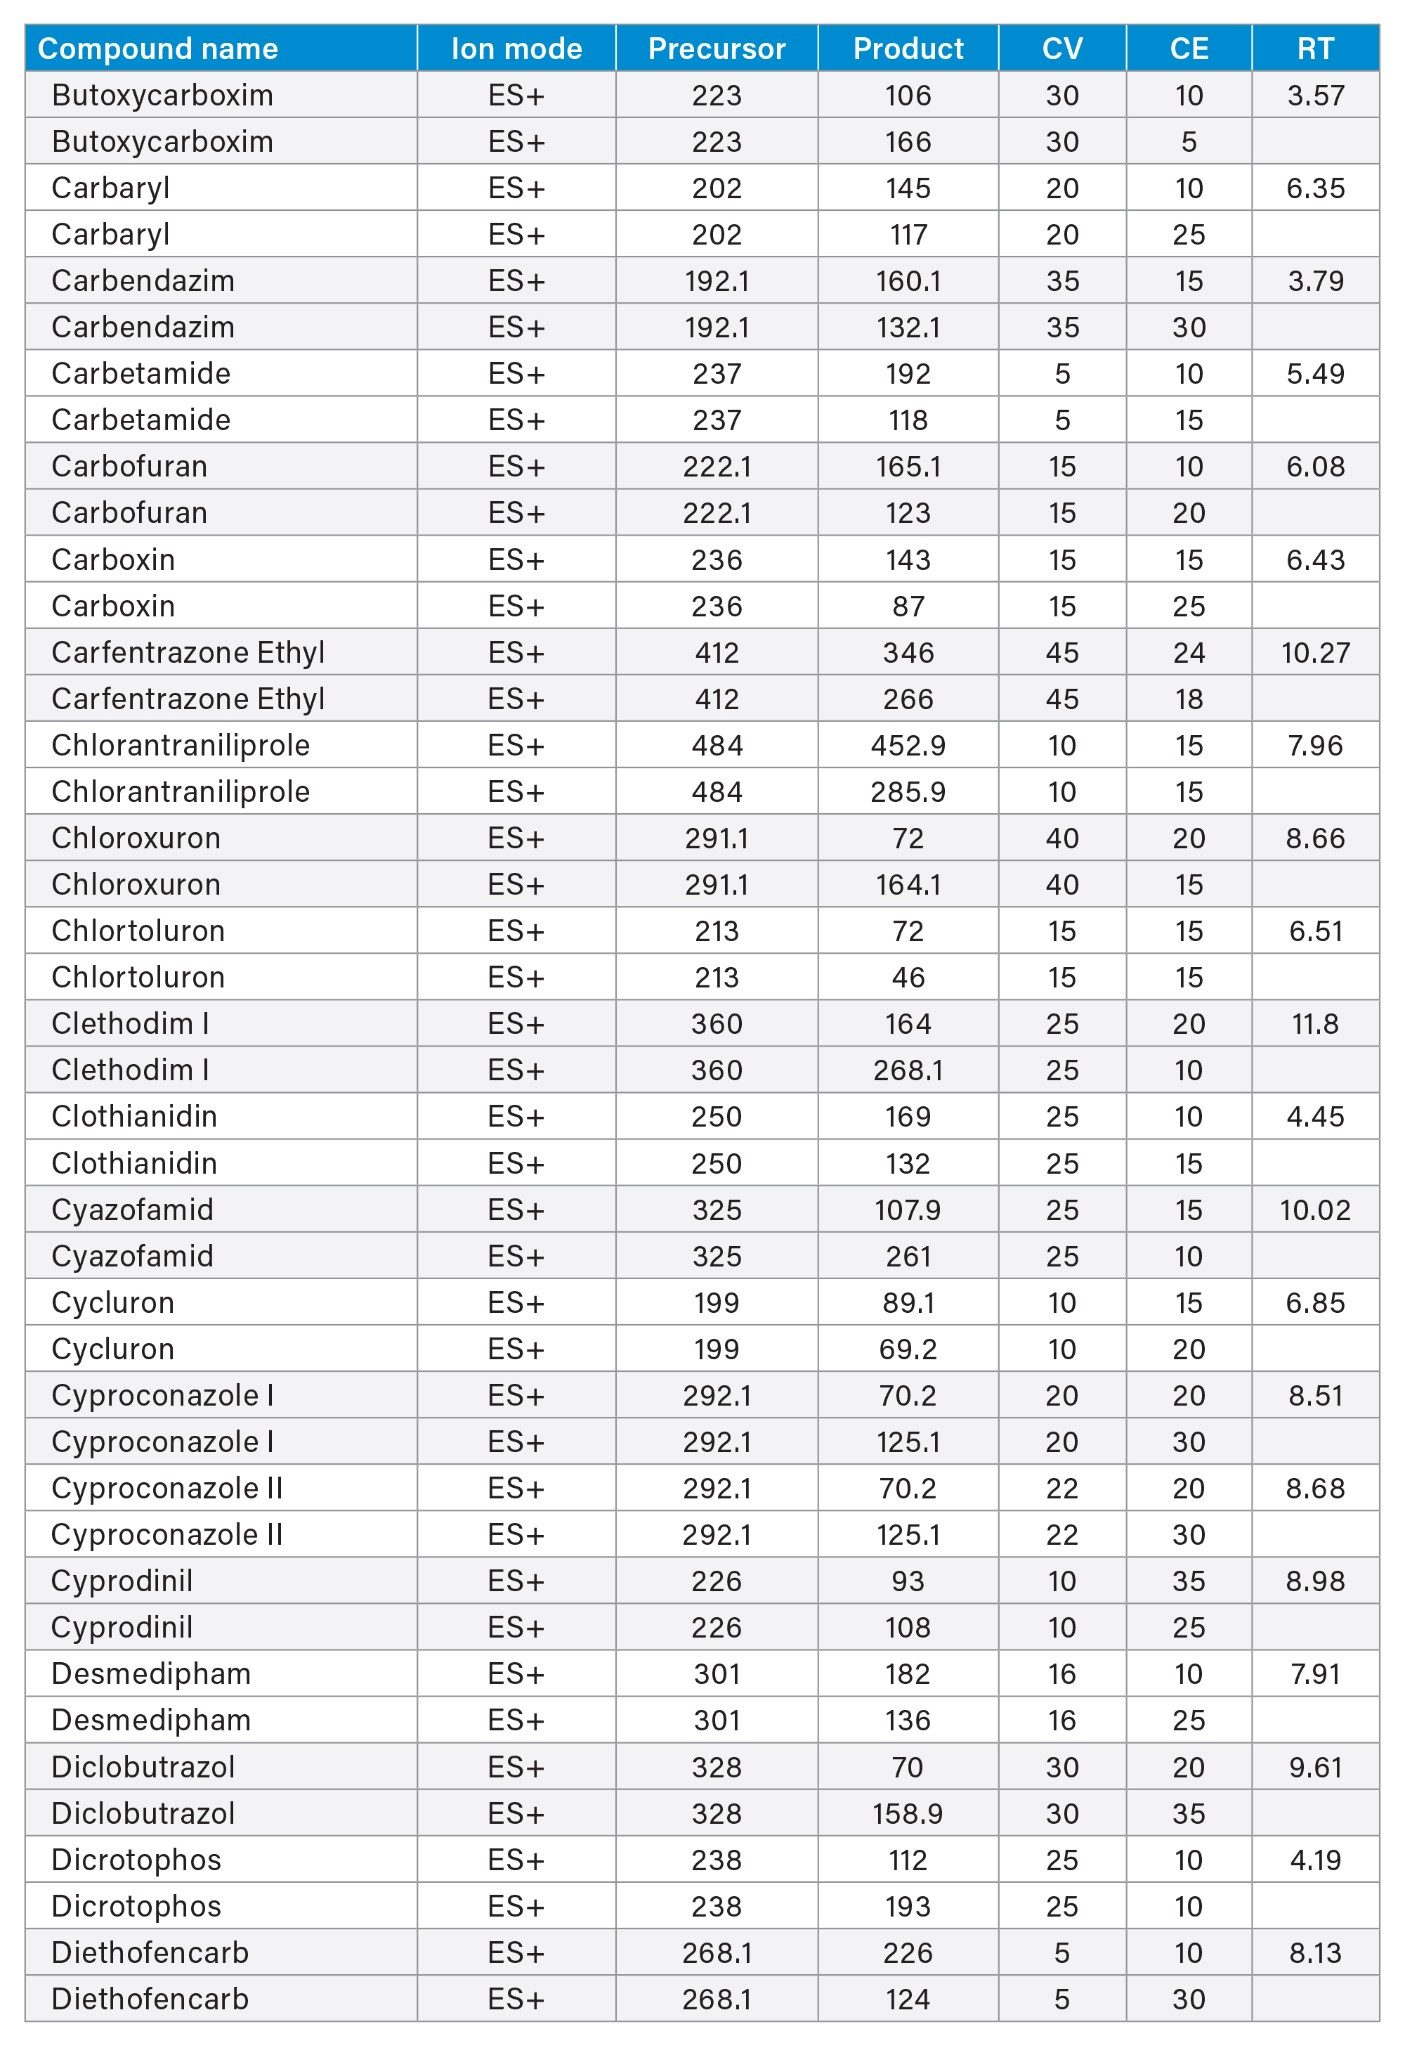
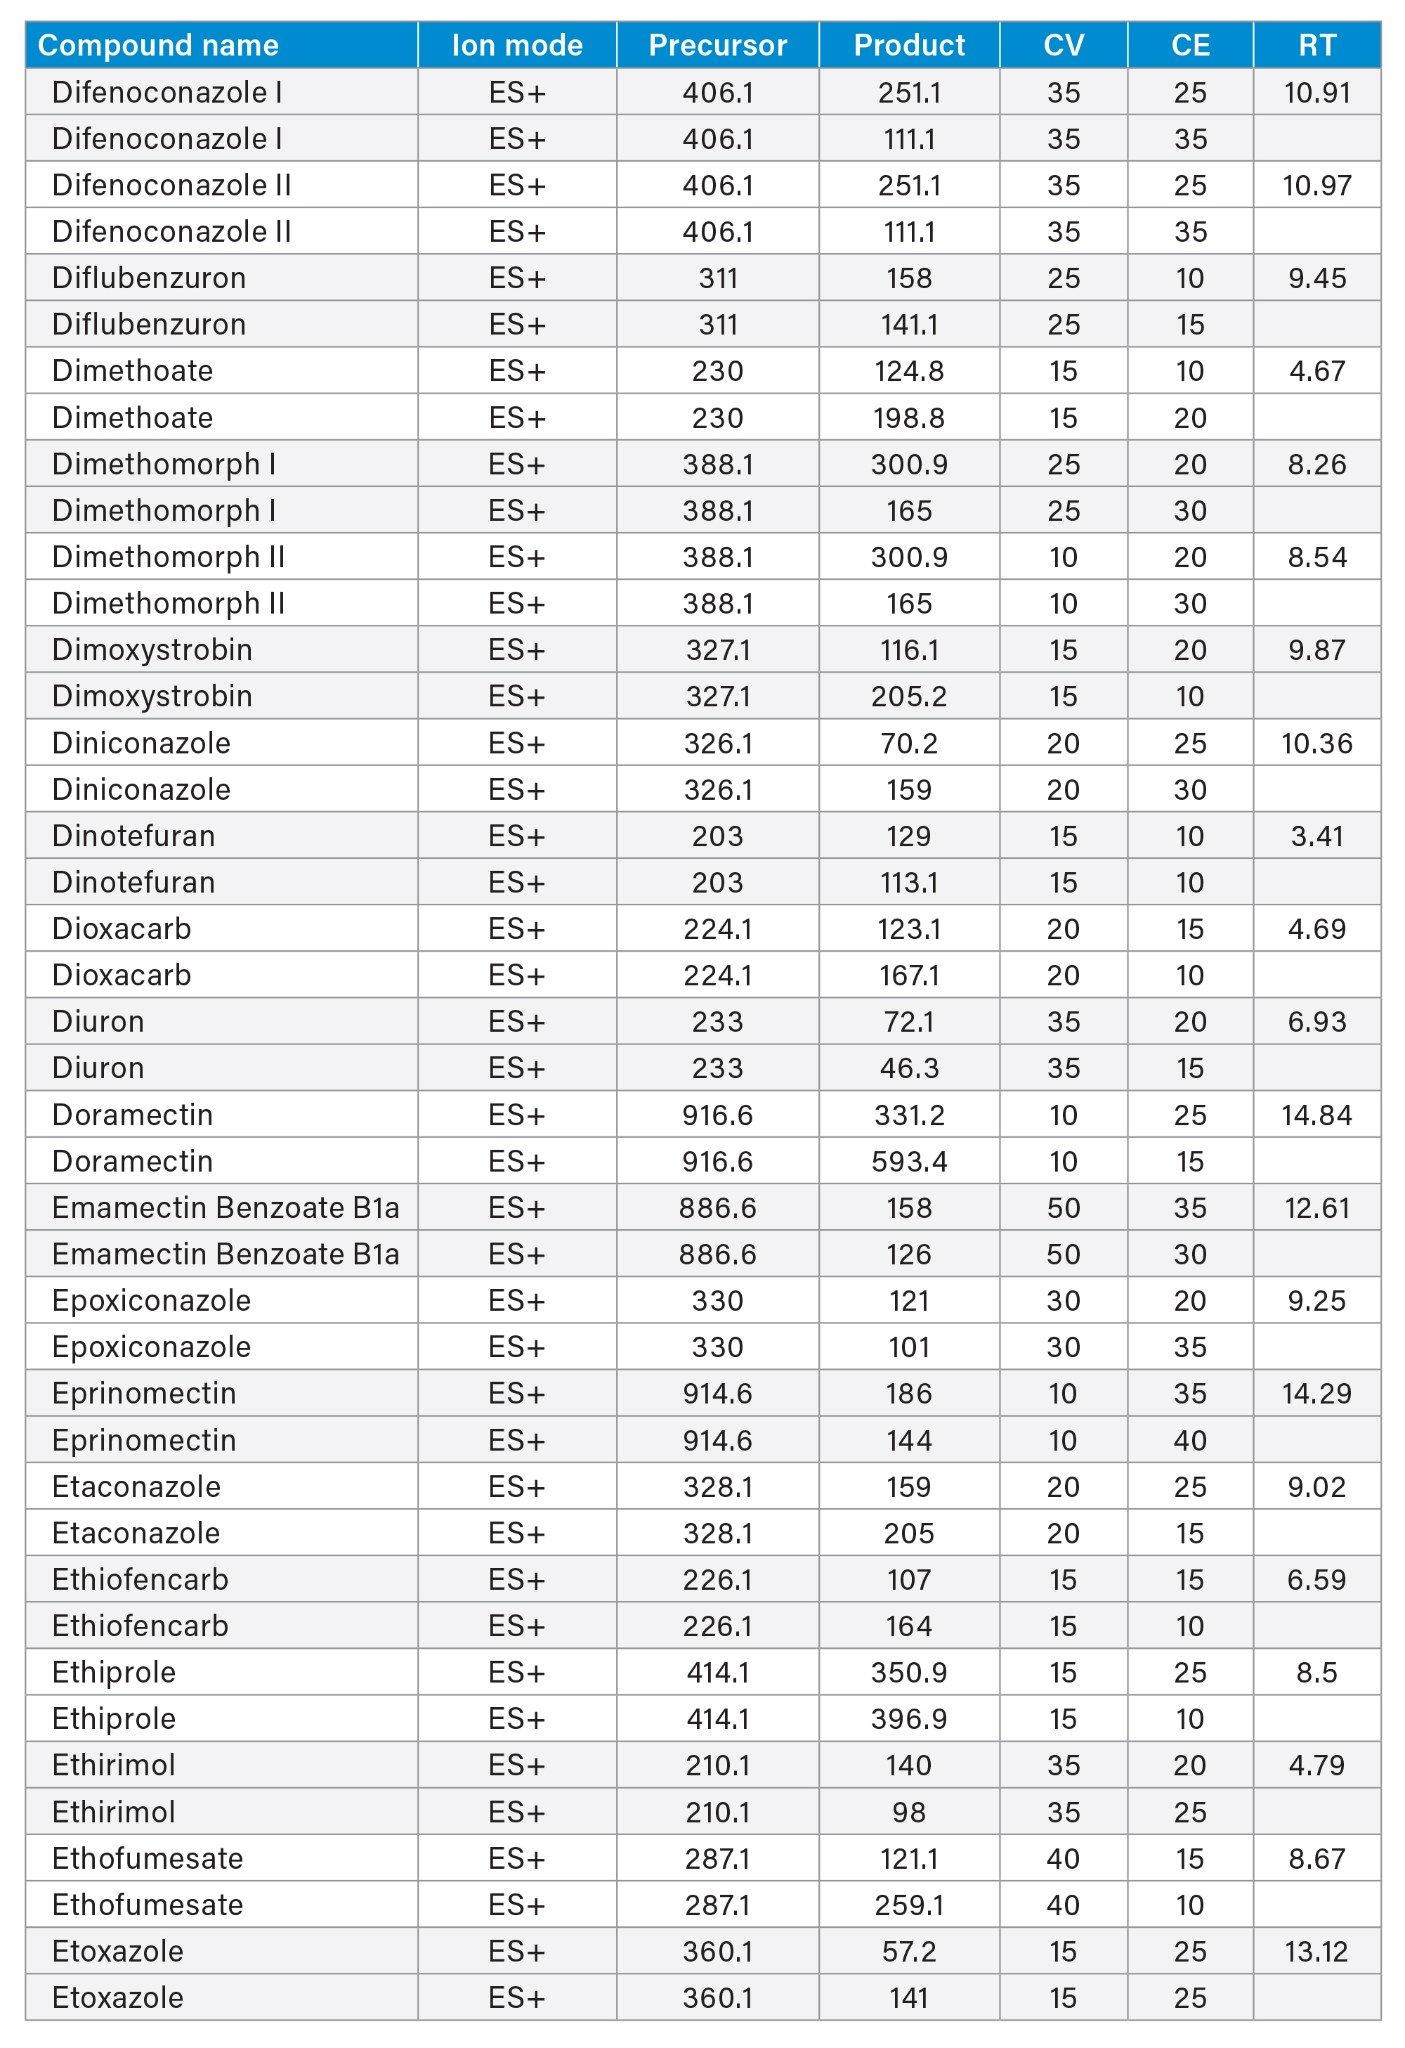
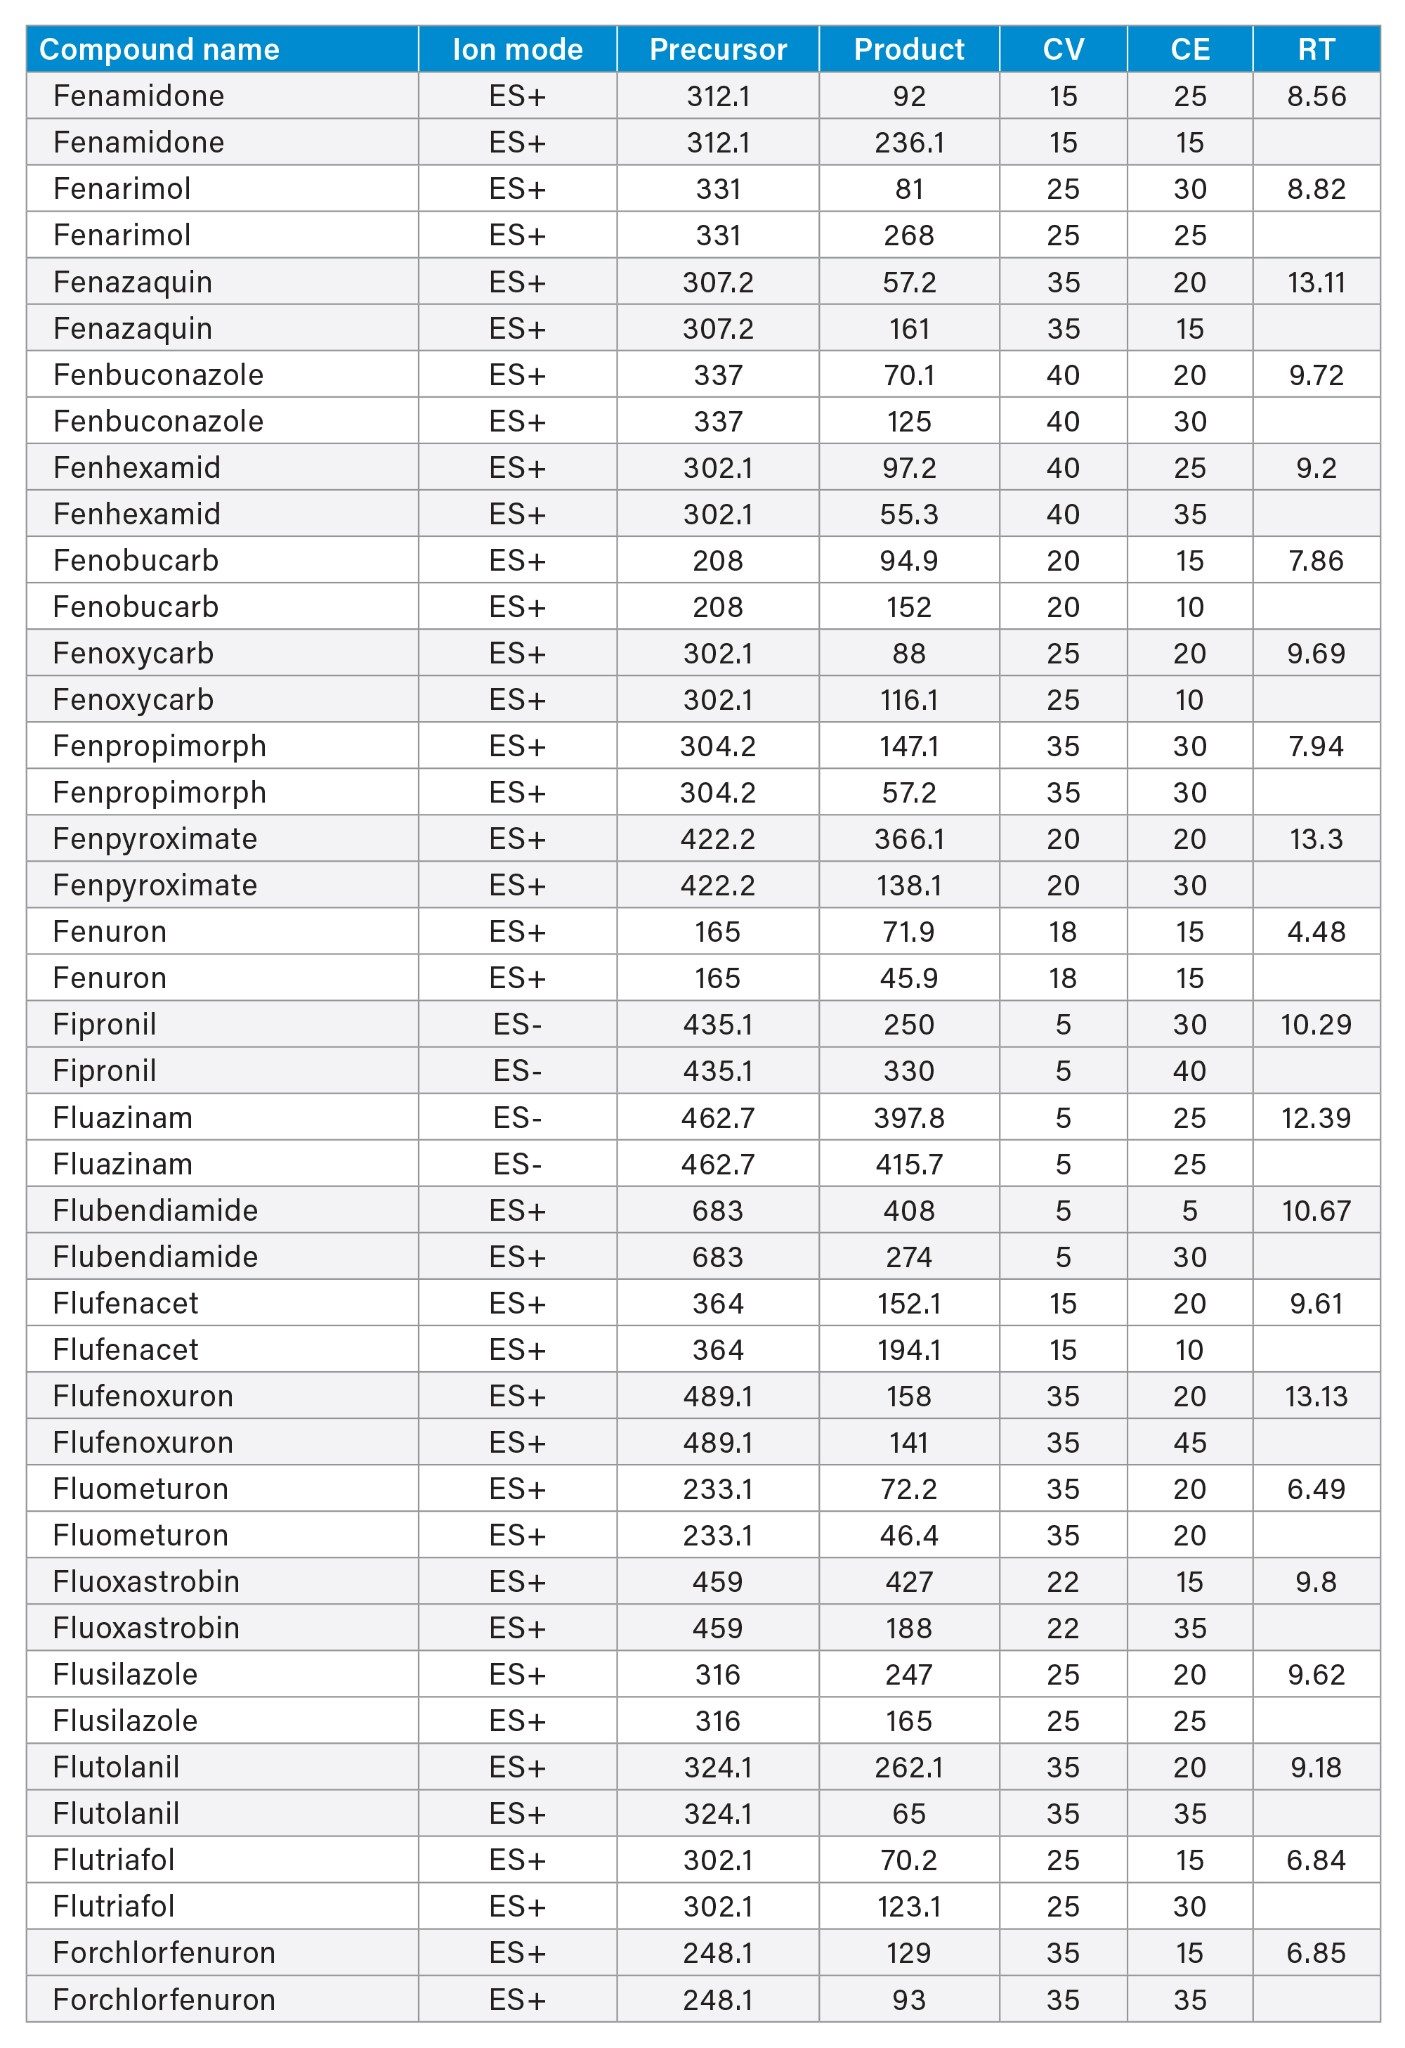
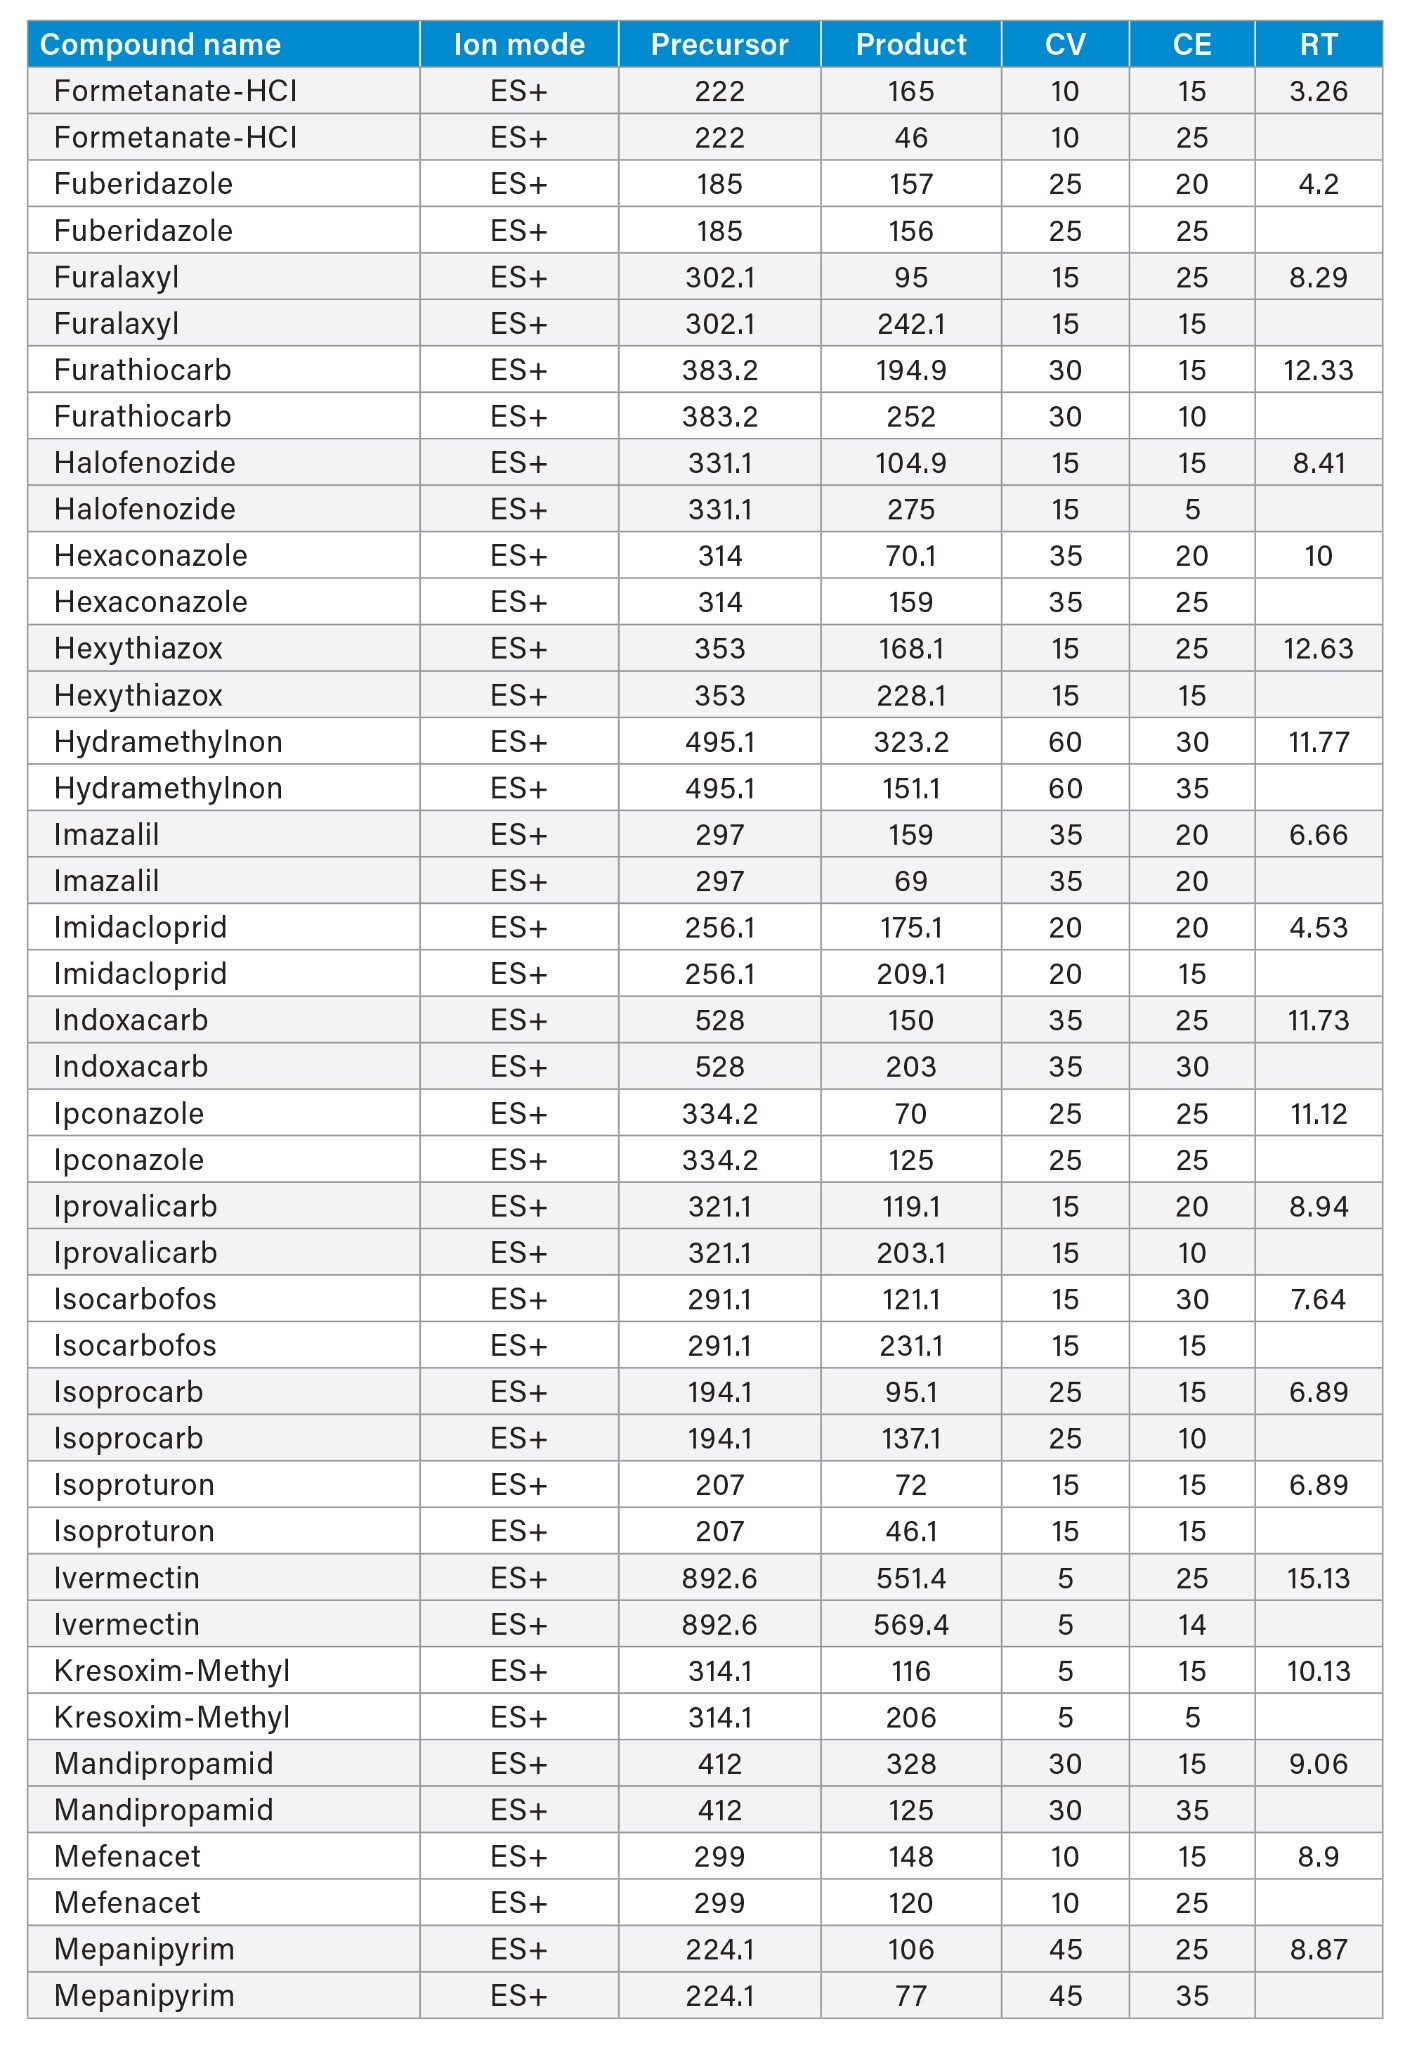
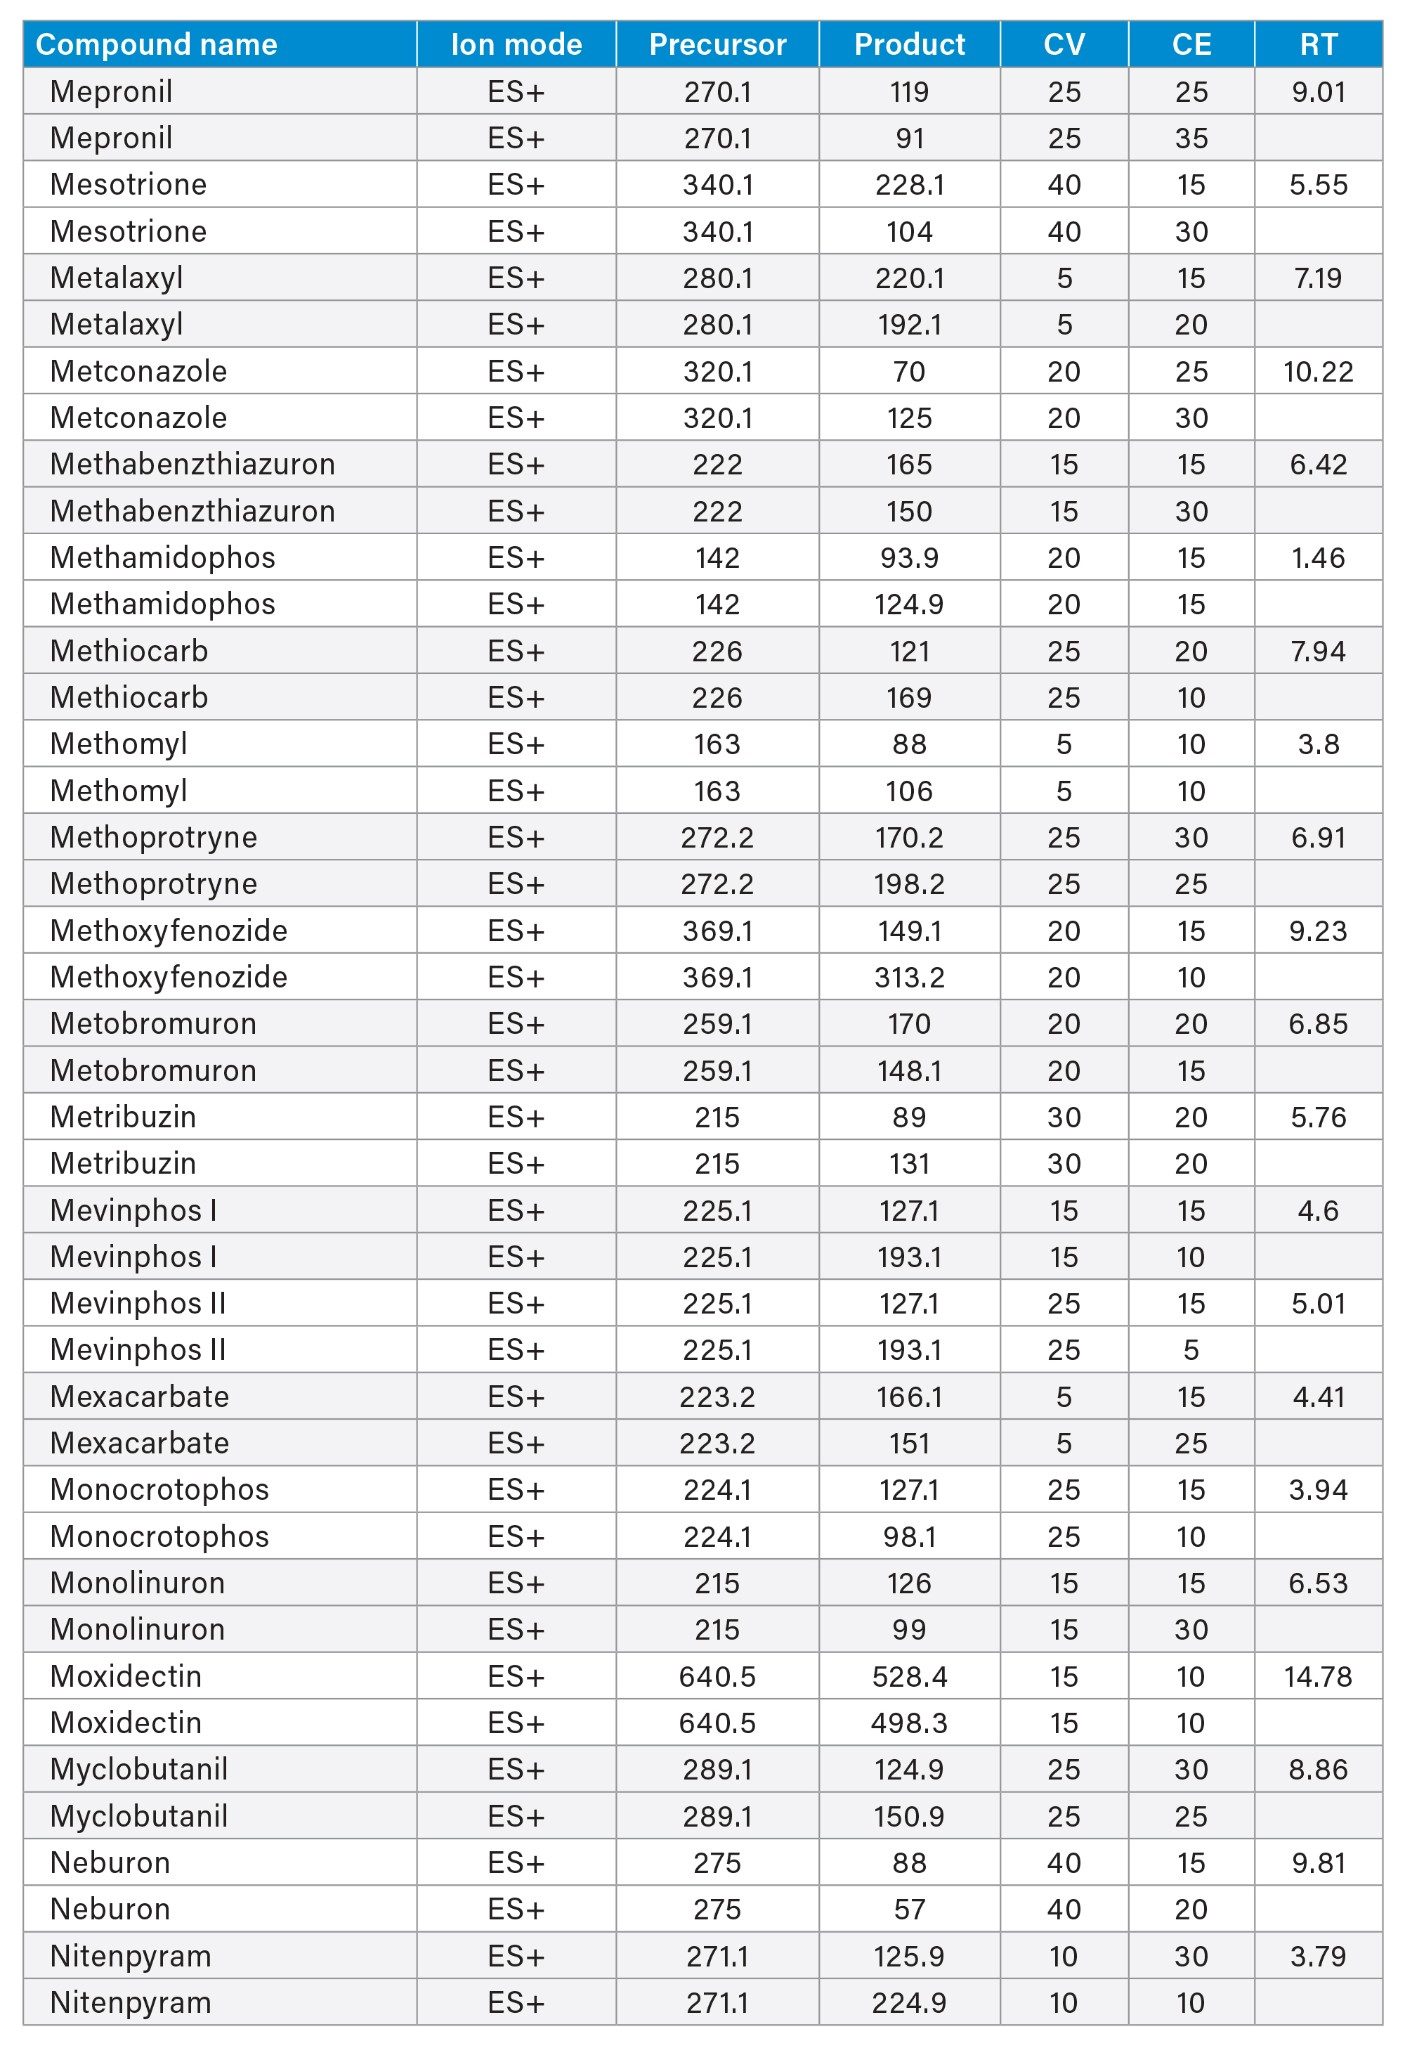
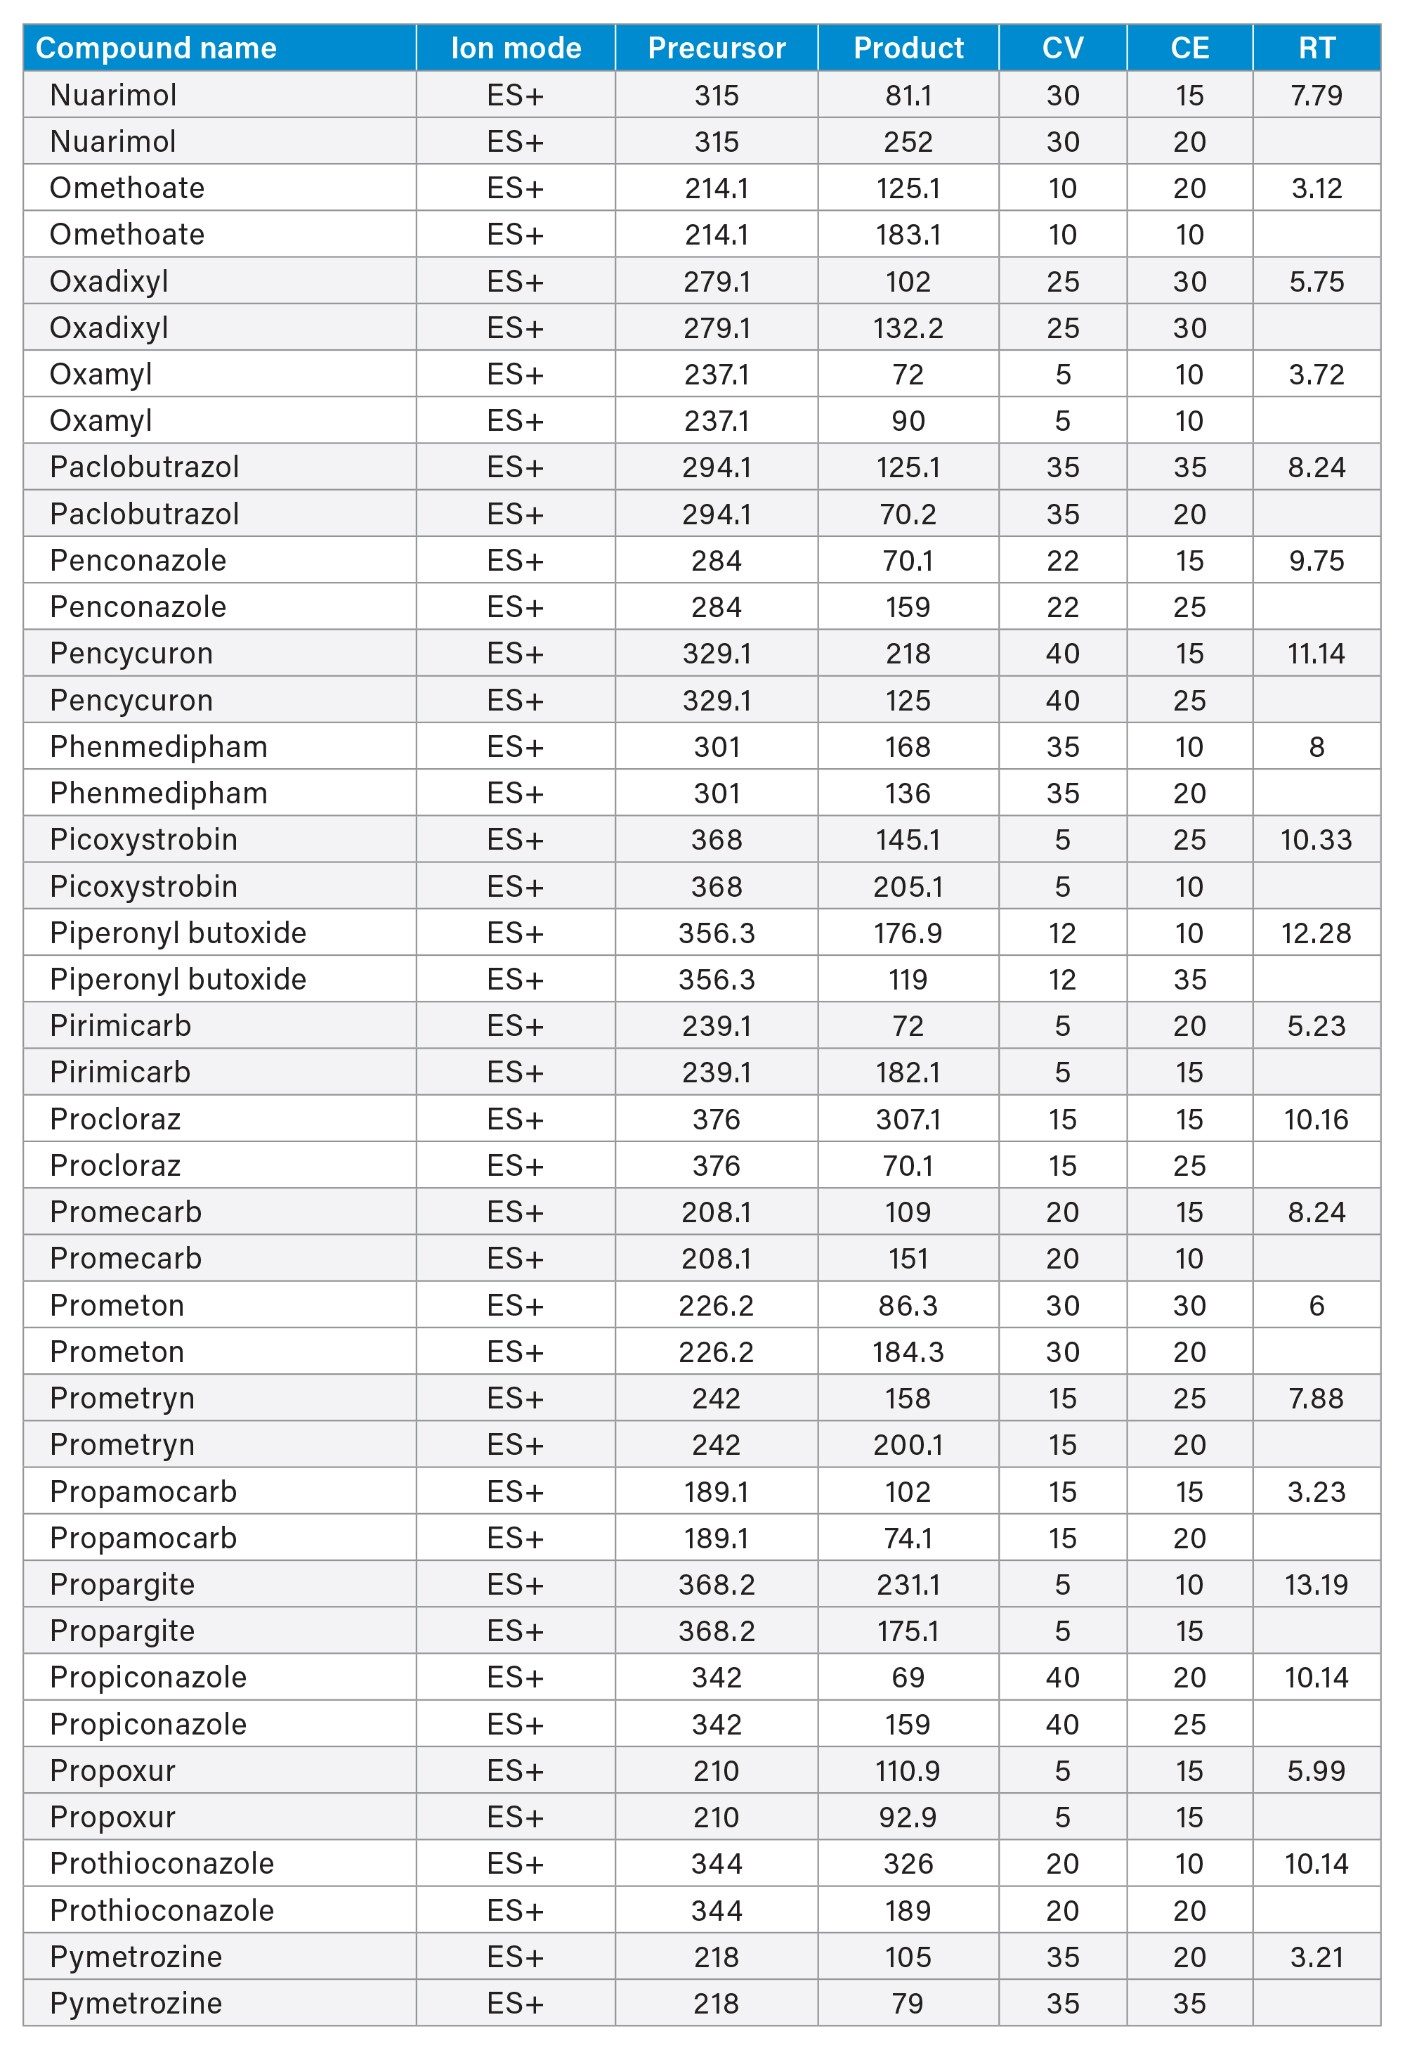
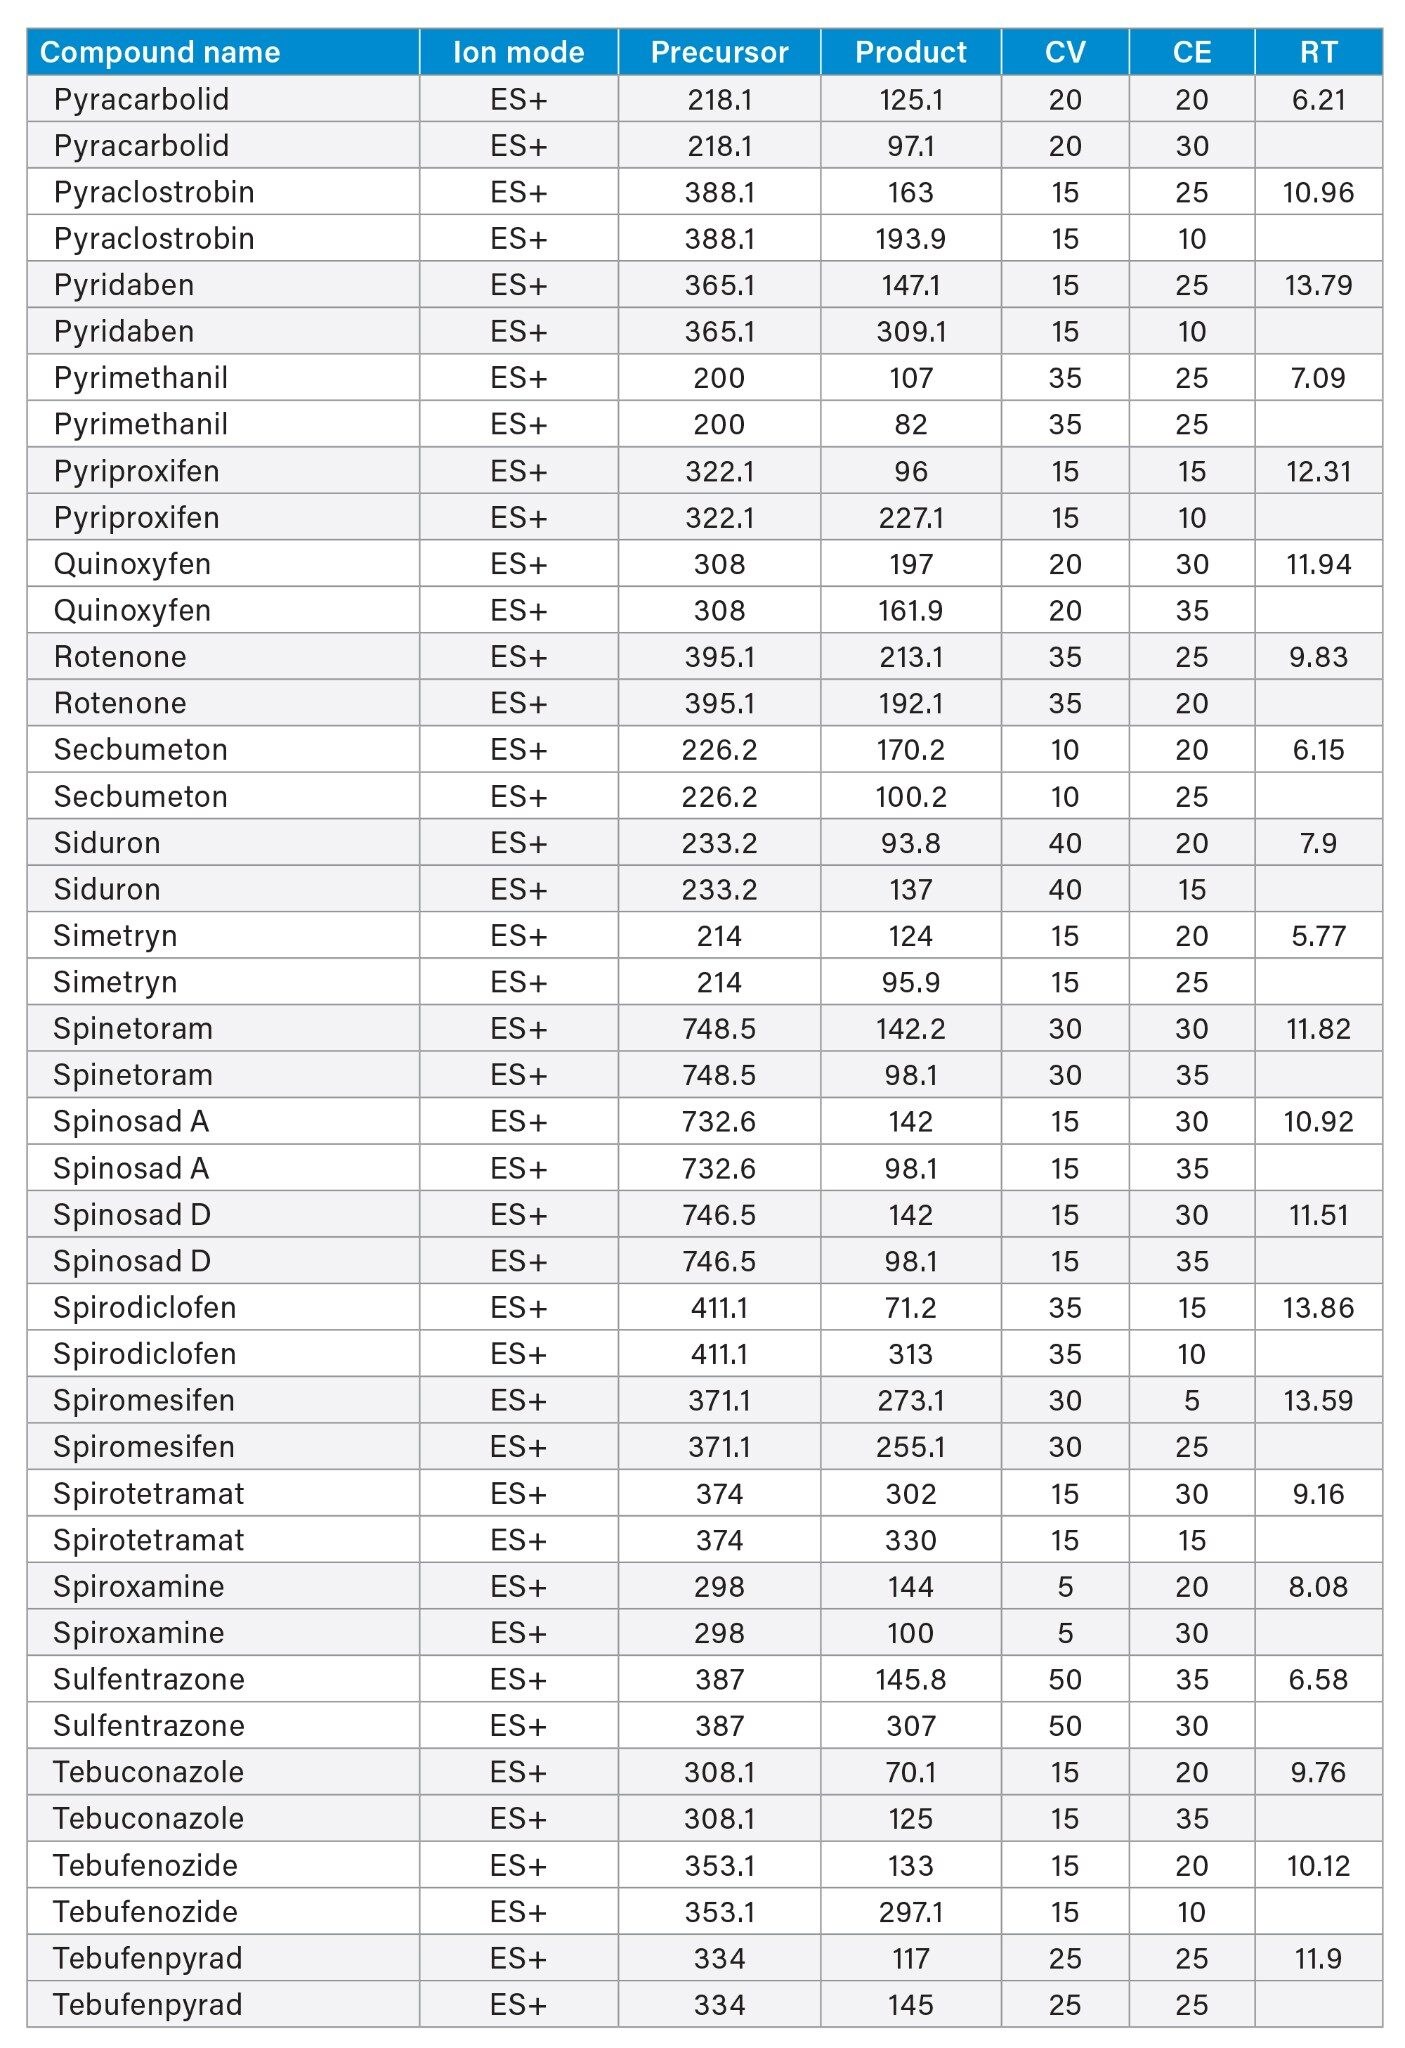
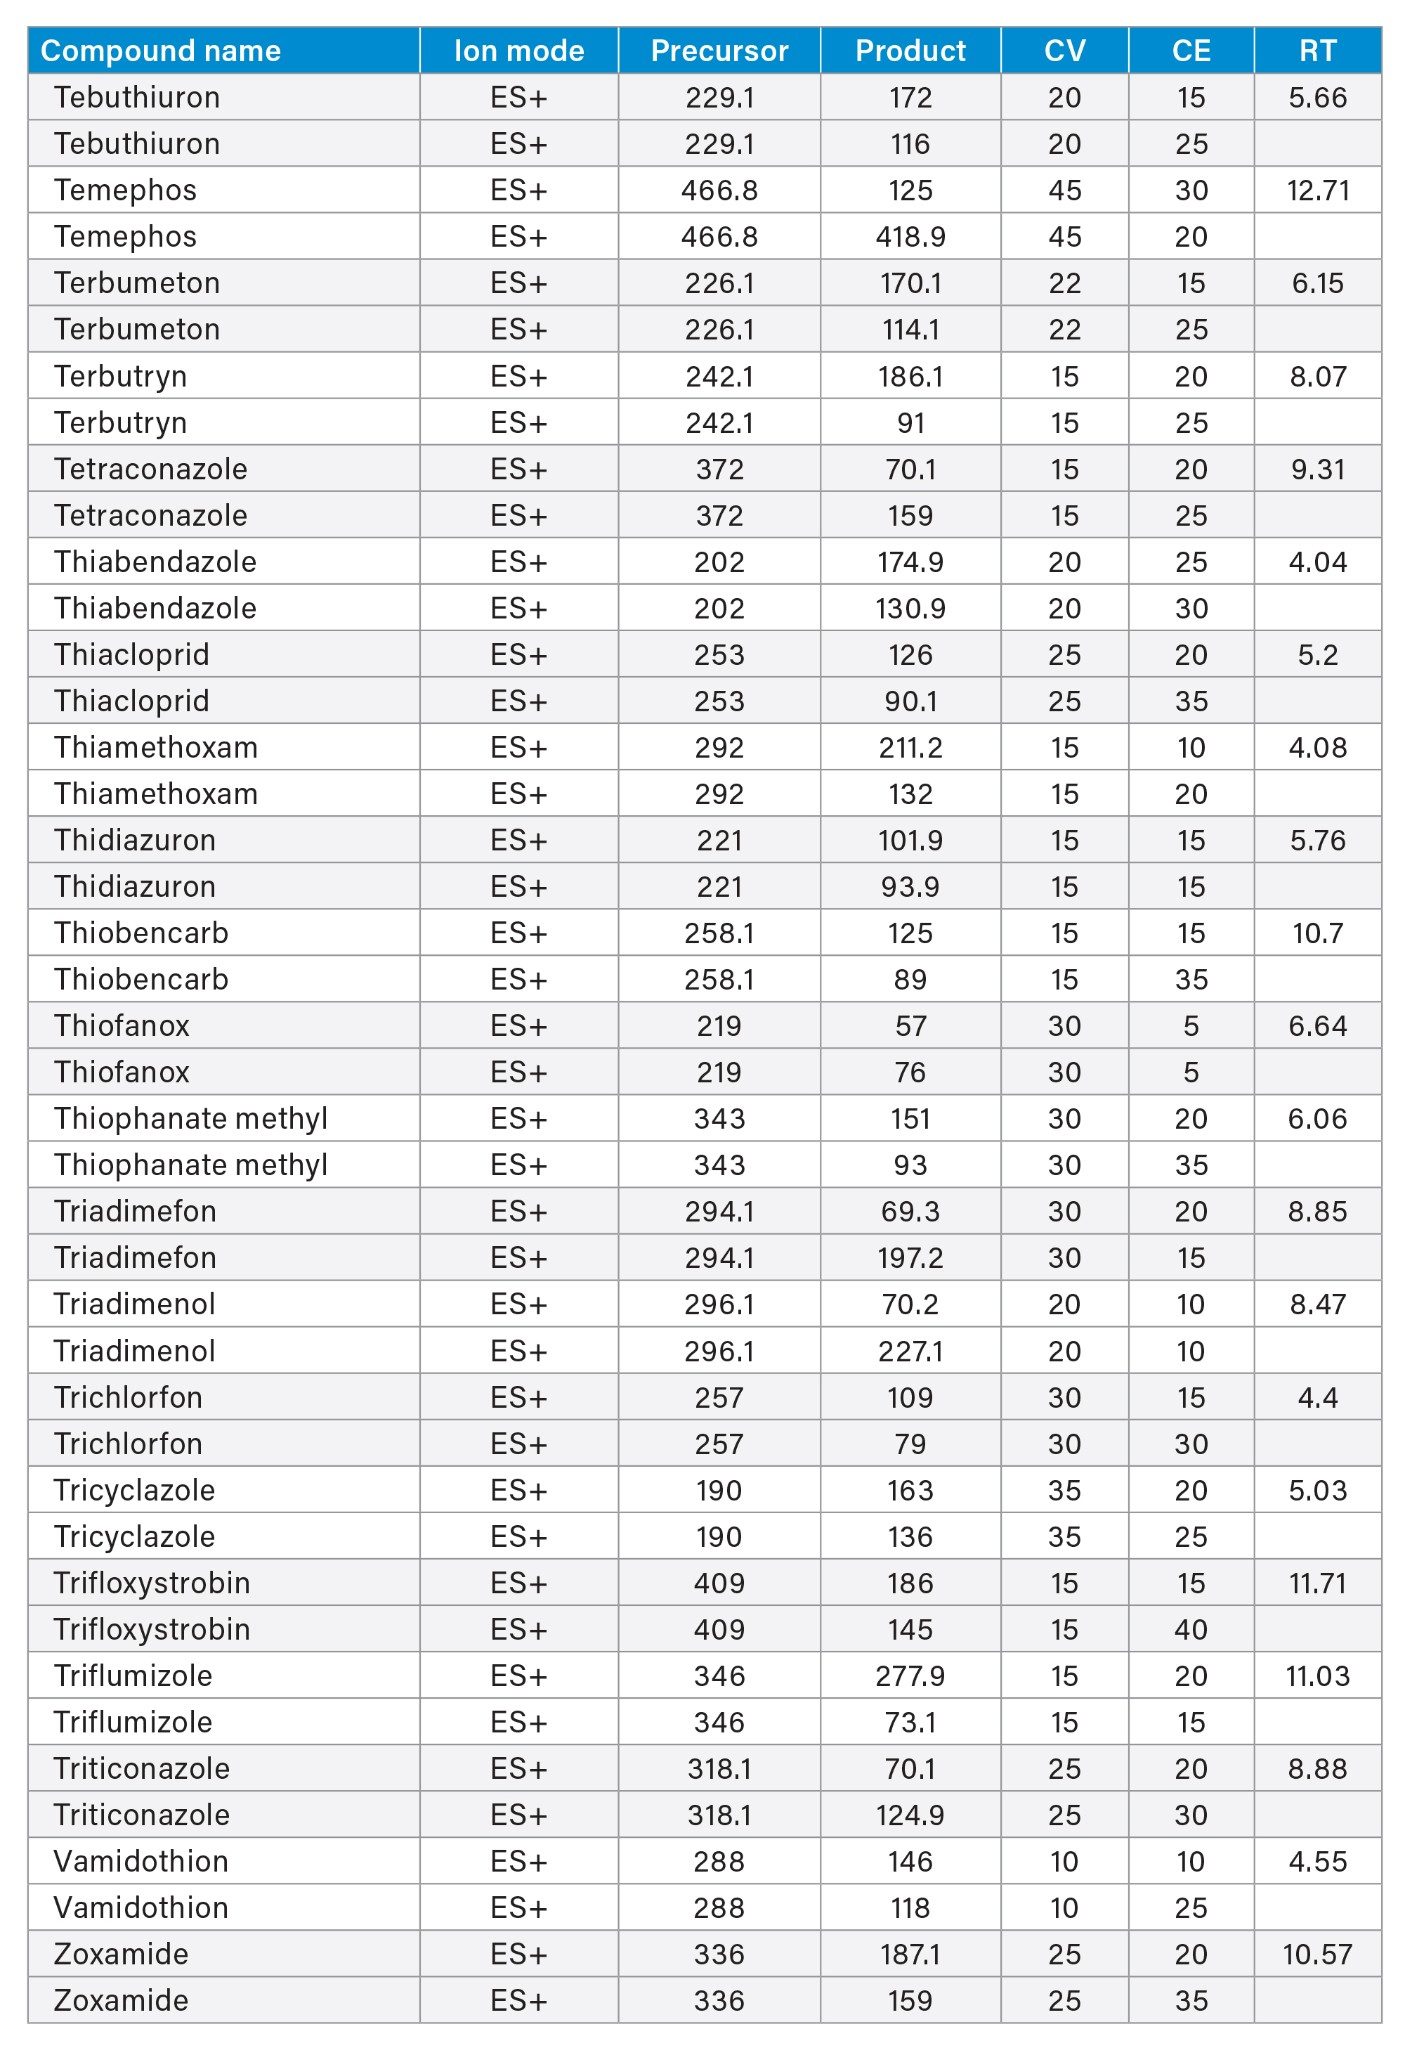
MRM transitions and compound specific MS parameters such as cone voltage and collision energy were downloaded from the relevant Quanpedia™ database (see Appendix 1). The database houses a compendium of compound data, and automatically creates LC and MS acquisition methods, in addition to processing methods. The MS method used in this work was created by Quanpedia and contains at least 2 MRM transitions per pesticide. Source conditions were optimized in favor of poorer performing compounds in both ESI+ and ESI-. Auto-dwell functionality allowed for sufficient points across the peak throughout the method (more than 12 data points per peak).
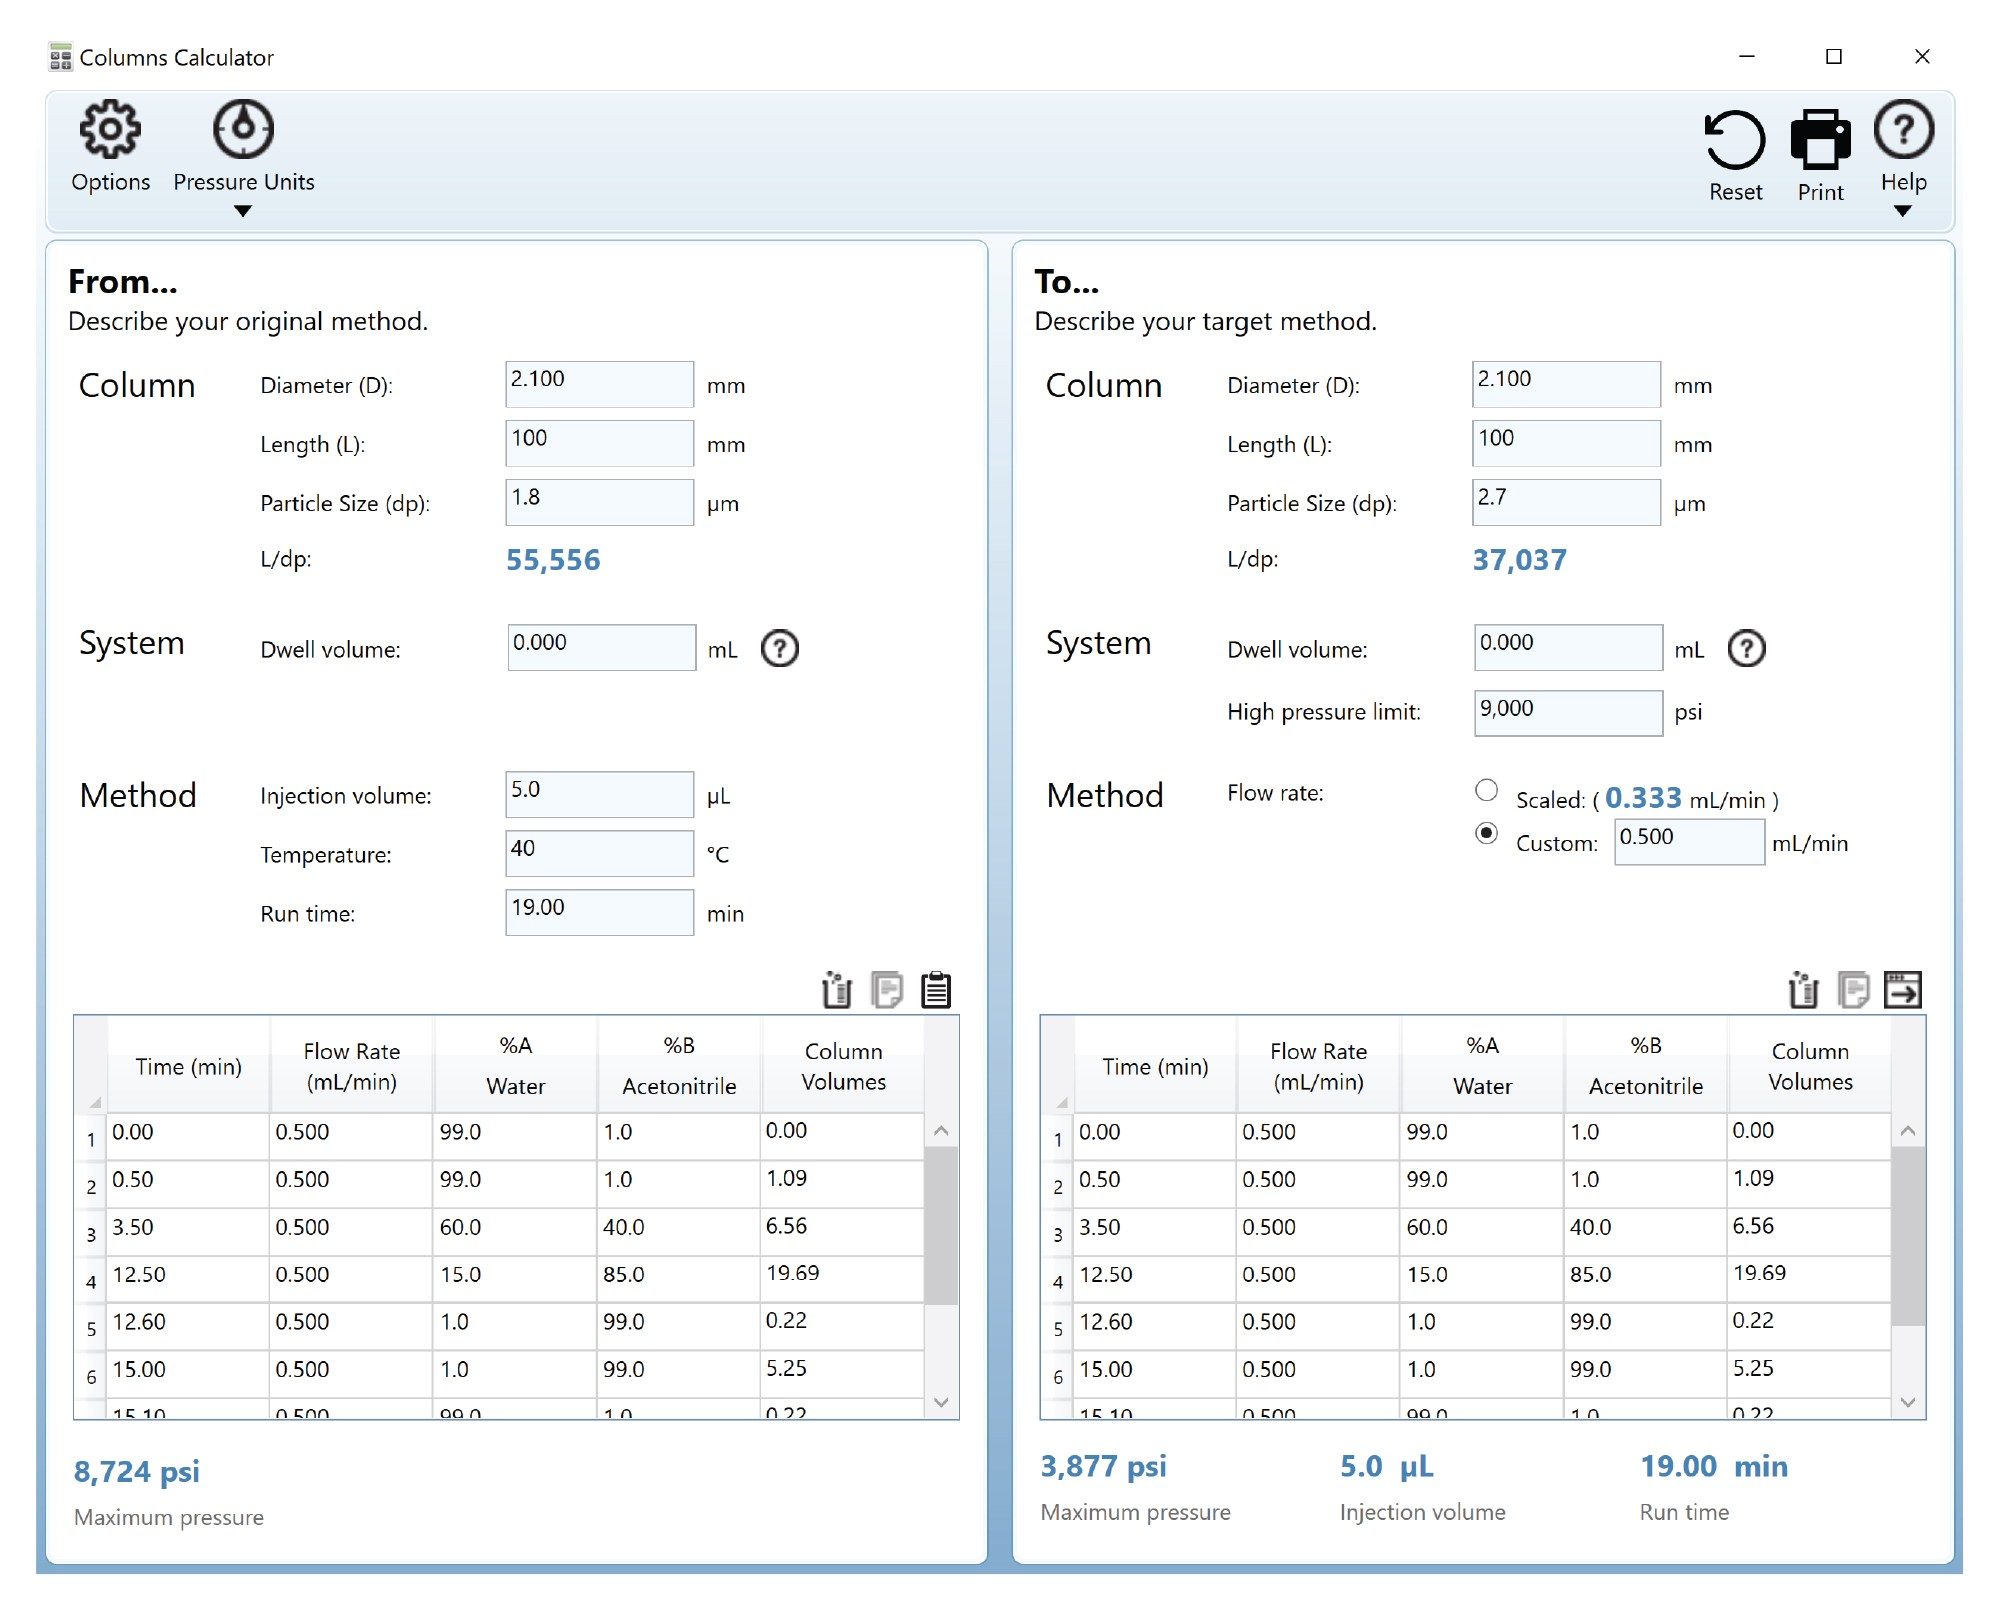
Columns Calculator 2.0 Software (667005222).
UHPLC-MS/MS Conditions
|
LC system: |
ACQUITY Arc with FTN-R Sample Manager |
|
Detection: |
Xevo TQ-S cronos |
|
Post injector mixing kit: |
50 µL Extension Loop (p/n: 430002012) |
|
Column(s): |
CORTECS T3 Column, 120 Å, 2.7 µm, 2.1 mm x 100 mm (p/n: 186008484) |
|
Column temperature: |
40 °C |
|
Sample temperature: |
10 °C |
|
Injection volume: |
5 µL |
|
Flow rate: |
0.5 mL/min |
|
Run time: |
19 mins |
|
Mobile phase A: |
5 mM Ammonium Formate in H2O +0.1% Formic Acid |
|
Mobile phase B: |
5 mM Ammonium Formate in 50:50 MeCN:MeOH +0.1% Formic Acid |
|
Vials: |
Clear Glass 12 x 32 mm Screw Neck Vial, 100/pk (p/n: 186000273) |
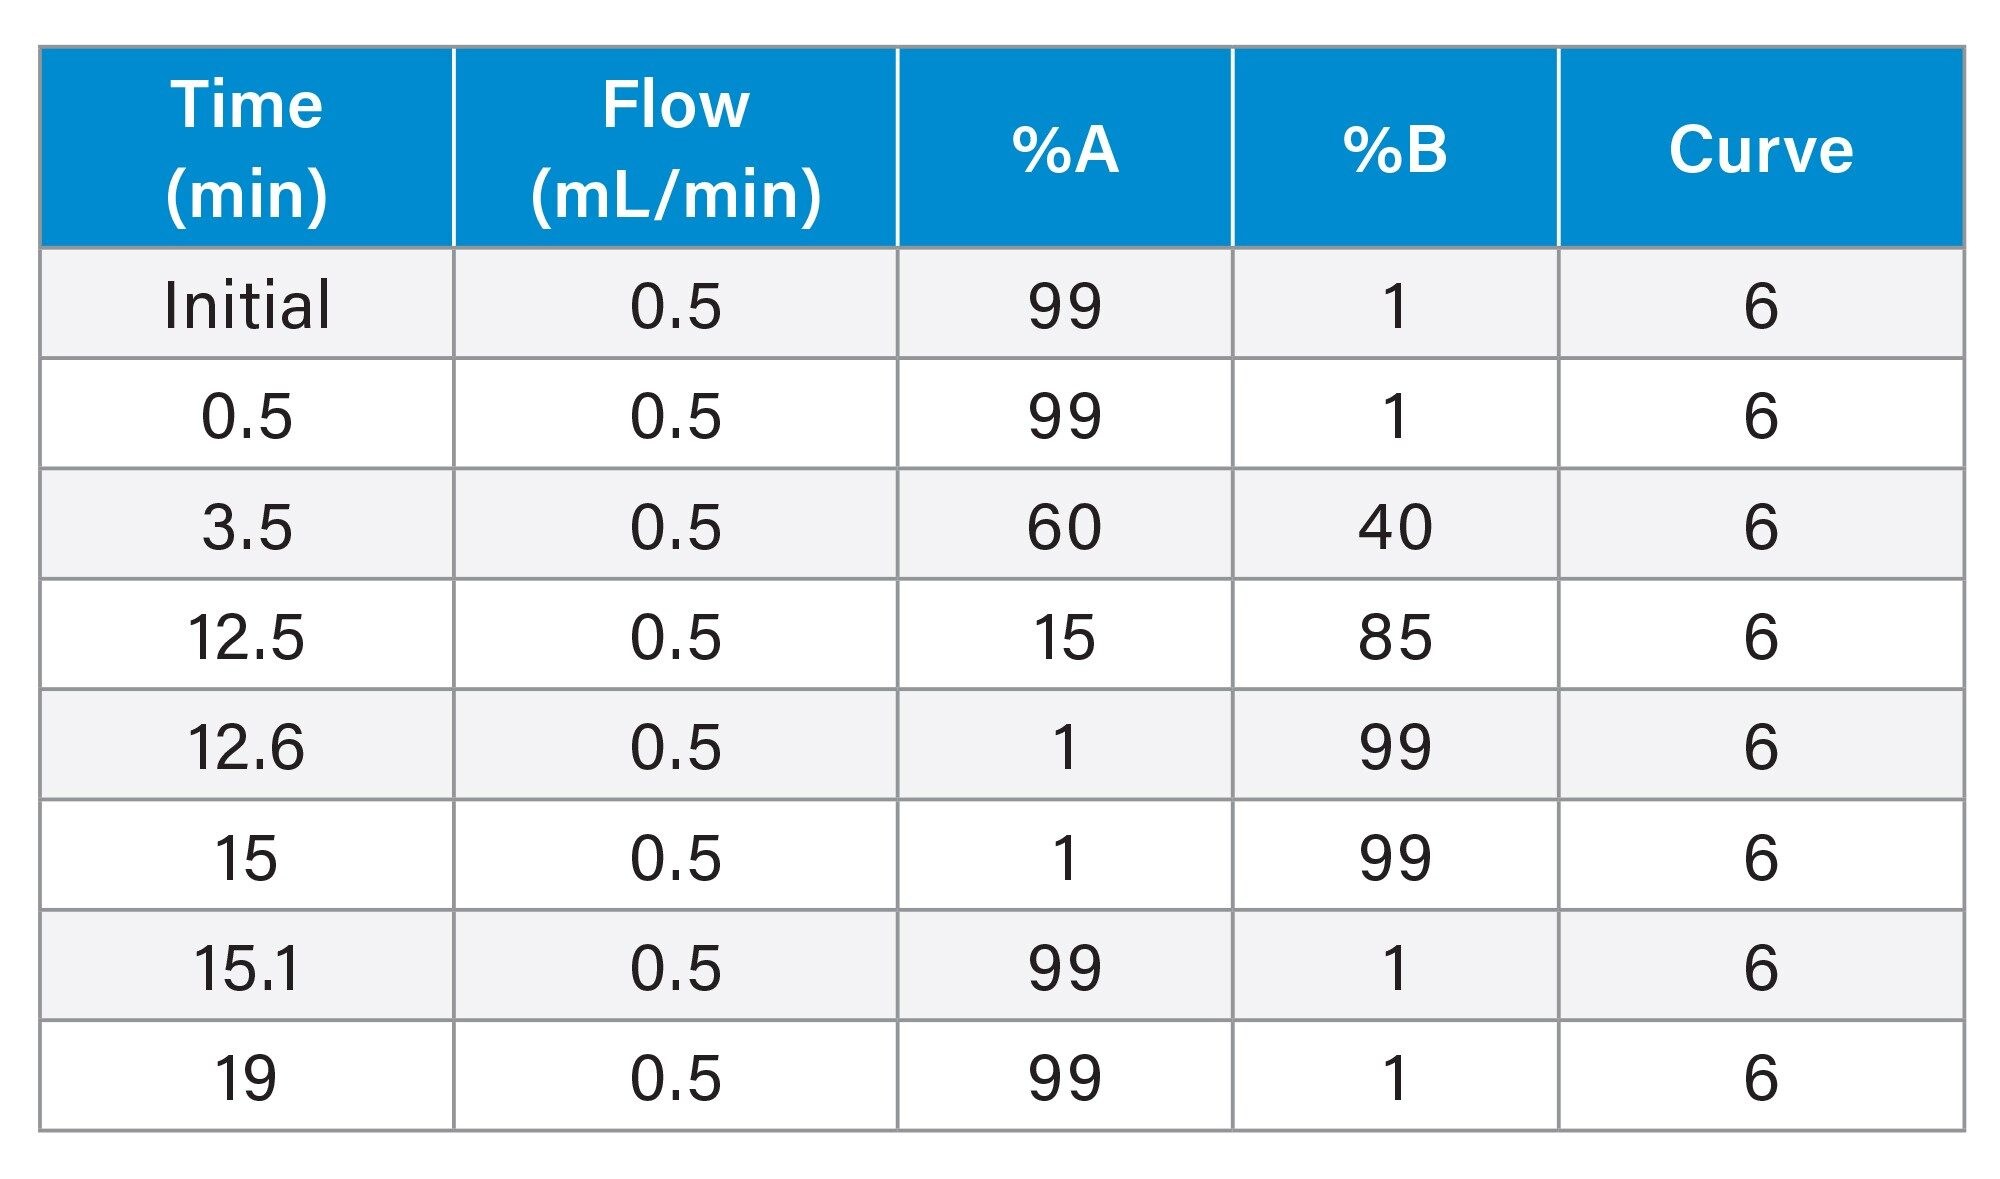
Gradient
Software
|
Chromatography software: |
TargetLynx™ XS |
|
MS software: |
MassLynx™ Version 4.2 |
Source Conditions
|
MS system: |
Xevo TQ-S cronos |
||
|
Ionization: |
Electrospray |
||
|
Ionization mode: |
+/- |
||
|
Capillary voltage: |
+0.4 kV / - 0.50 kV |
||
|
Desolvation temperature: |
600 °C |
||
|
Desolvation gas flow: |
1000 L/Hr |
||
|
Source temperature: |
150 °C |
||
|
Cone gas flow: |
0 L/Hr |
Results and Discussion
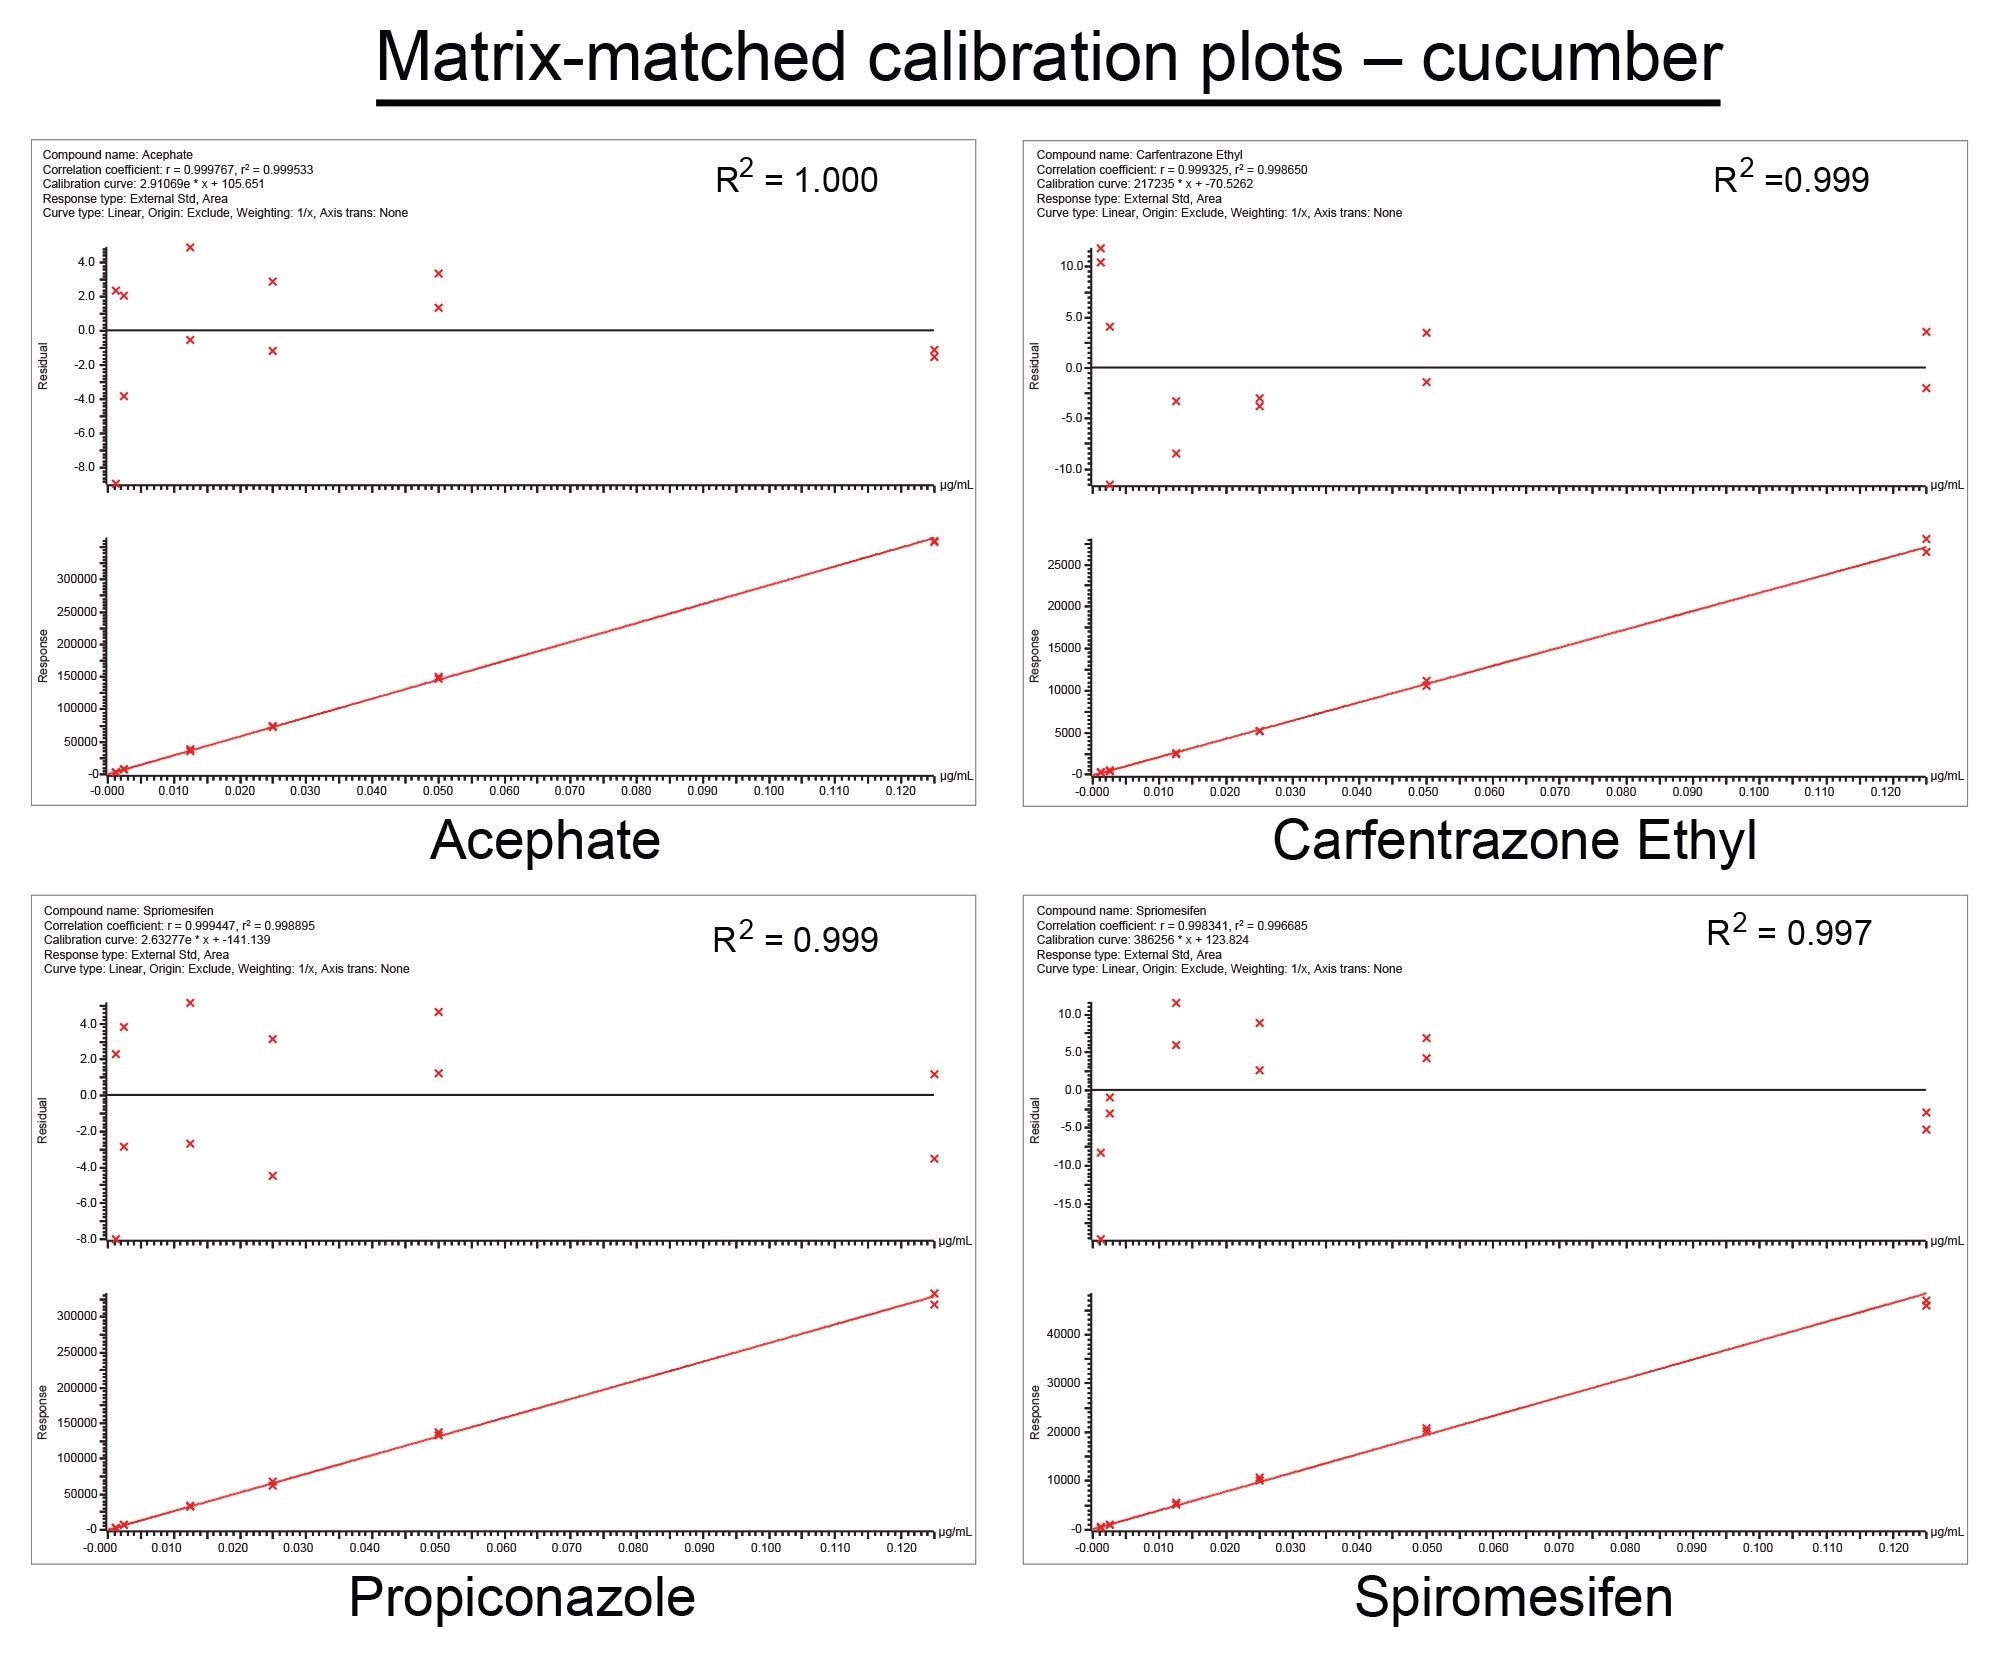
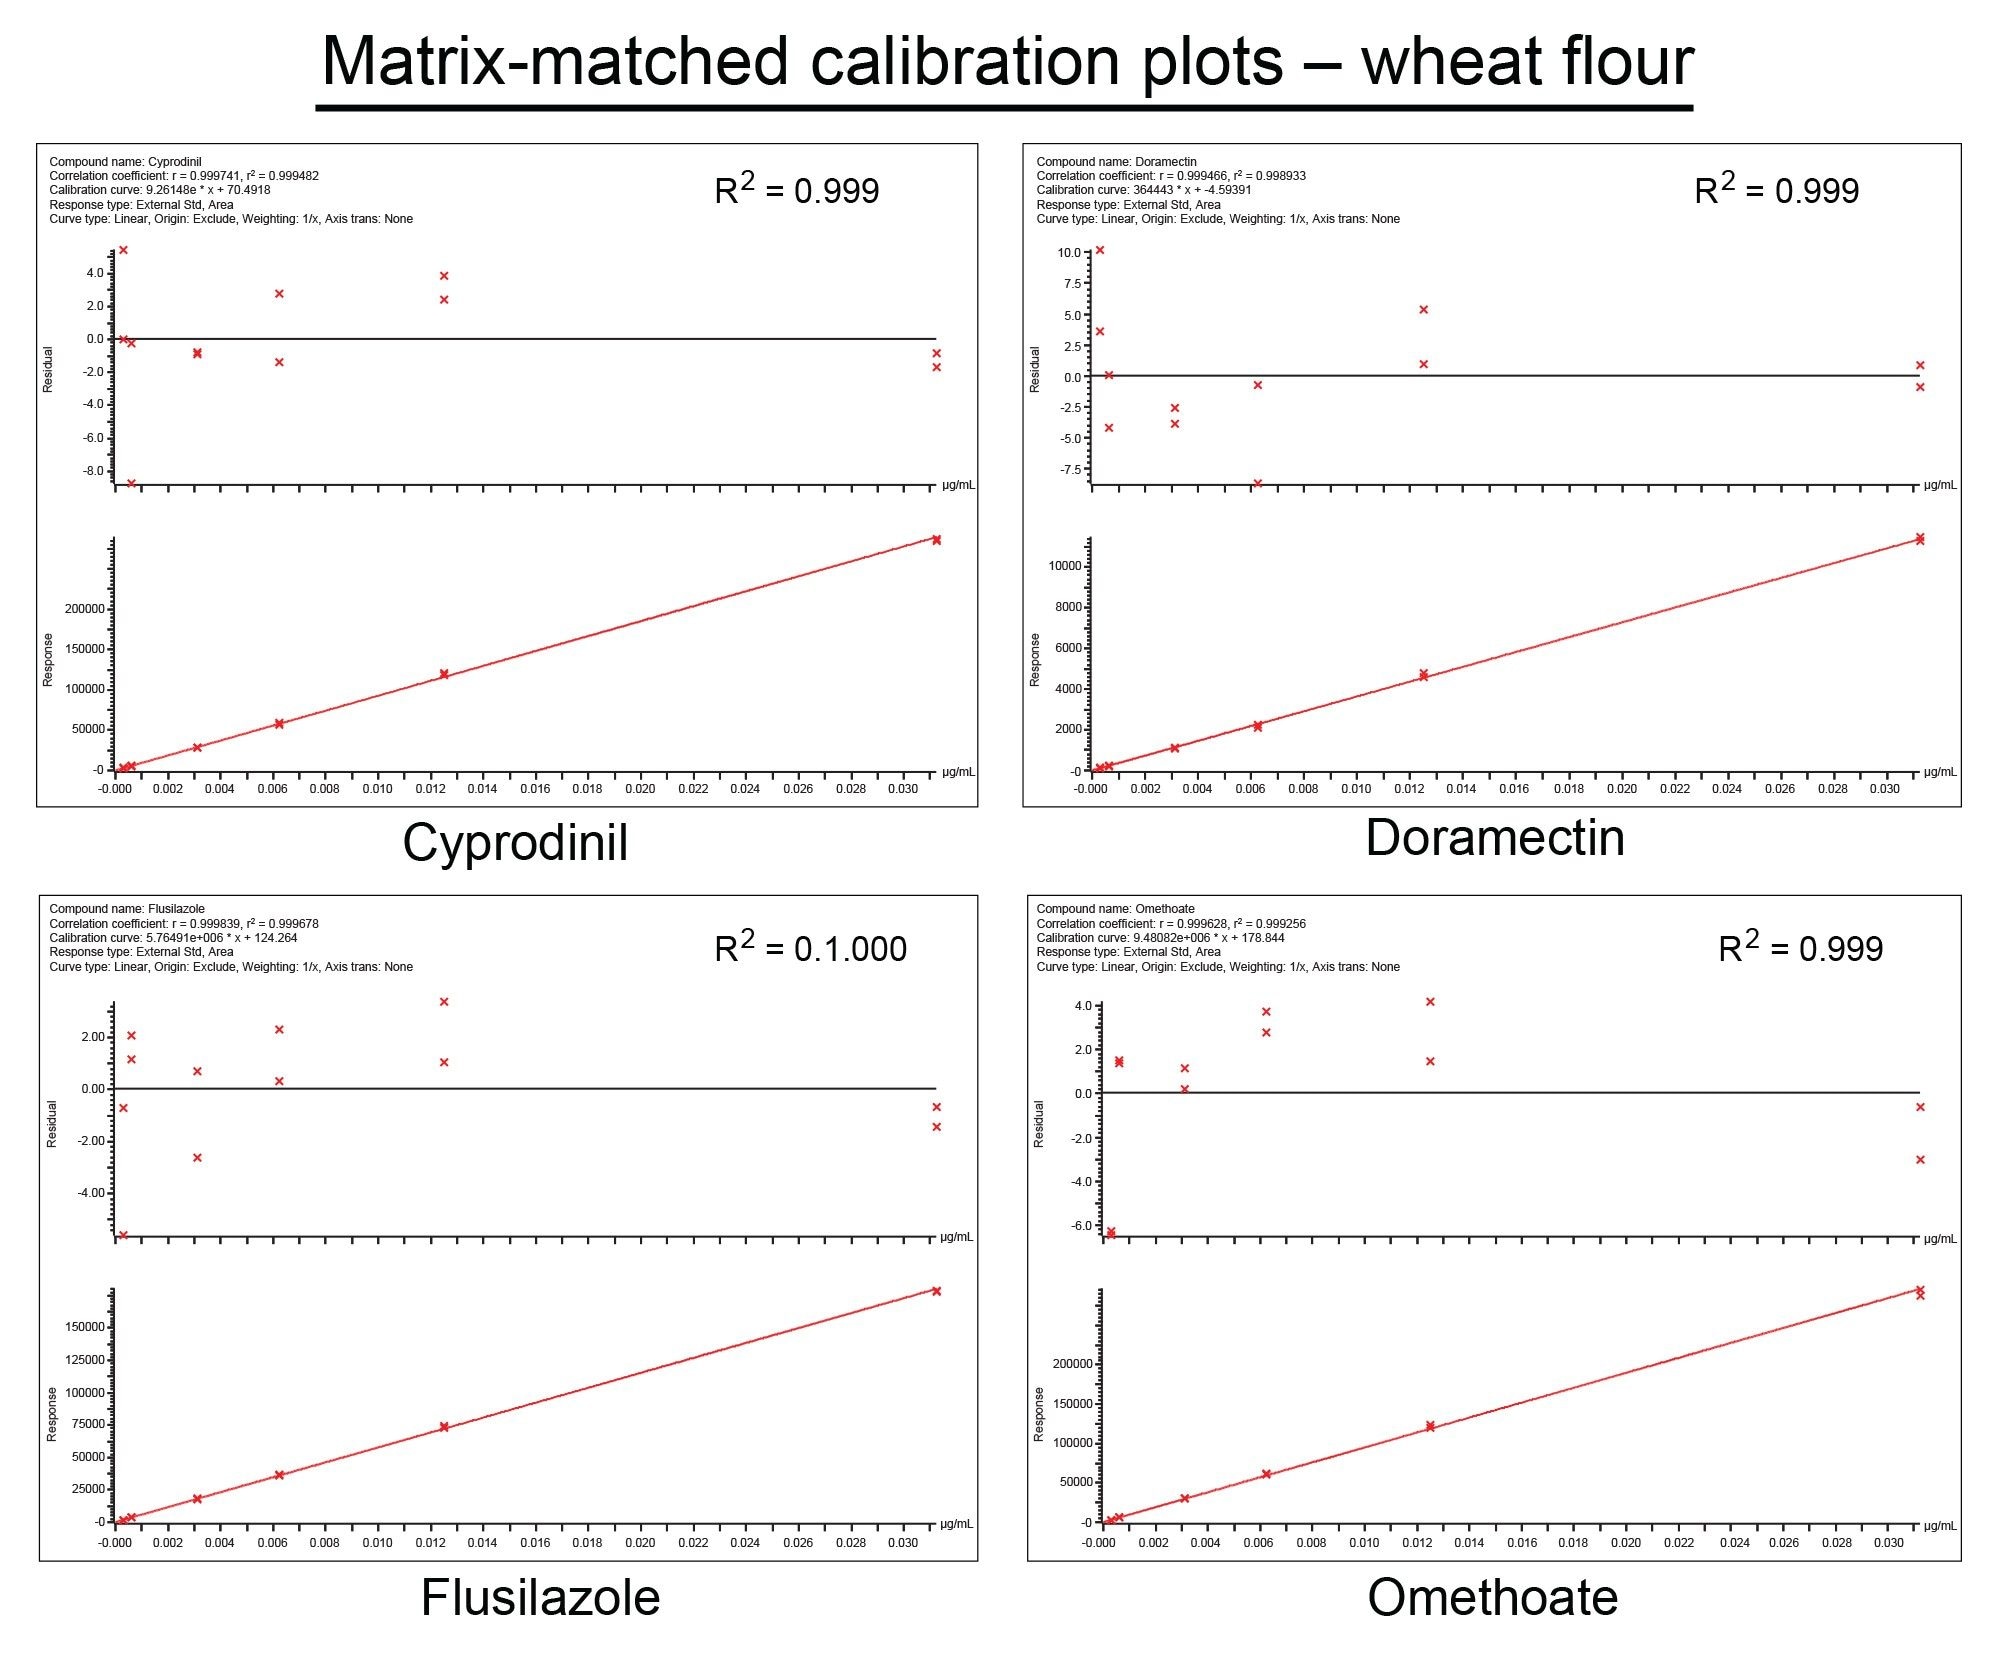
The sensitivity of the method was evaluated by assessment of matrix-matched calibration standards, with concentrations ranging from an equivalent of 0.005 mg/kg in the lowest concentration standard (0.00125 µg/mL and 0.000625 µg/mL in-vial, for cucumber and wheat flour respectively). Blank response for the respective matrices was below the criteria of ≤30% of the required reporting limit for the more than 180 analytes in the method. Response in matrix blanks was negligible, and no significant interferences in the chromatograms for either the quantifier or qualifier transitions were observed at the respective retention times.
The deviation of the back-calculated concentrations of the calibration standards from the true concentrations (residuals) did not exceed ±20%. All analytes exhibited residuals within this tolerance, set out by the SANTE guidelines. Some examples of this can be seen in Figure 3 and Figure 4. Calibration plots for almost all analytes (98% in cucumber, 96% in wheat flour) gave values of r2 ≥0.99, with only a few exceptions. Clothianidin and thiophanate methyl in cucumber matrix, and aldicarb, mesotrione, monolinuron, sulfentrazone, thiofanox, and zoxamide in wheat flour matrix, all gave of r2 >0.97 or higher. Ethofumesate (r2 >0.94) was the only analyte to fall below this threshold in both matrices. A majority of calibration plots across both matrices were linear. A weighting factor of (1/x) was used to construct the matrix-matched calibration curves.
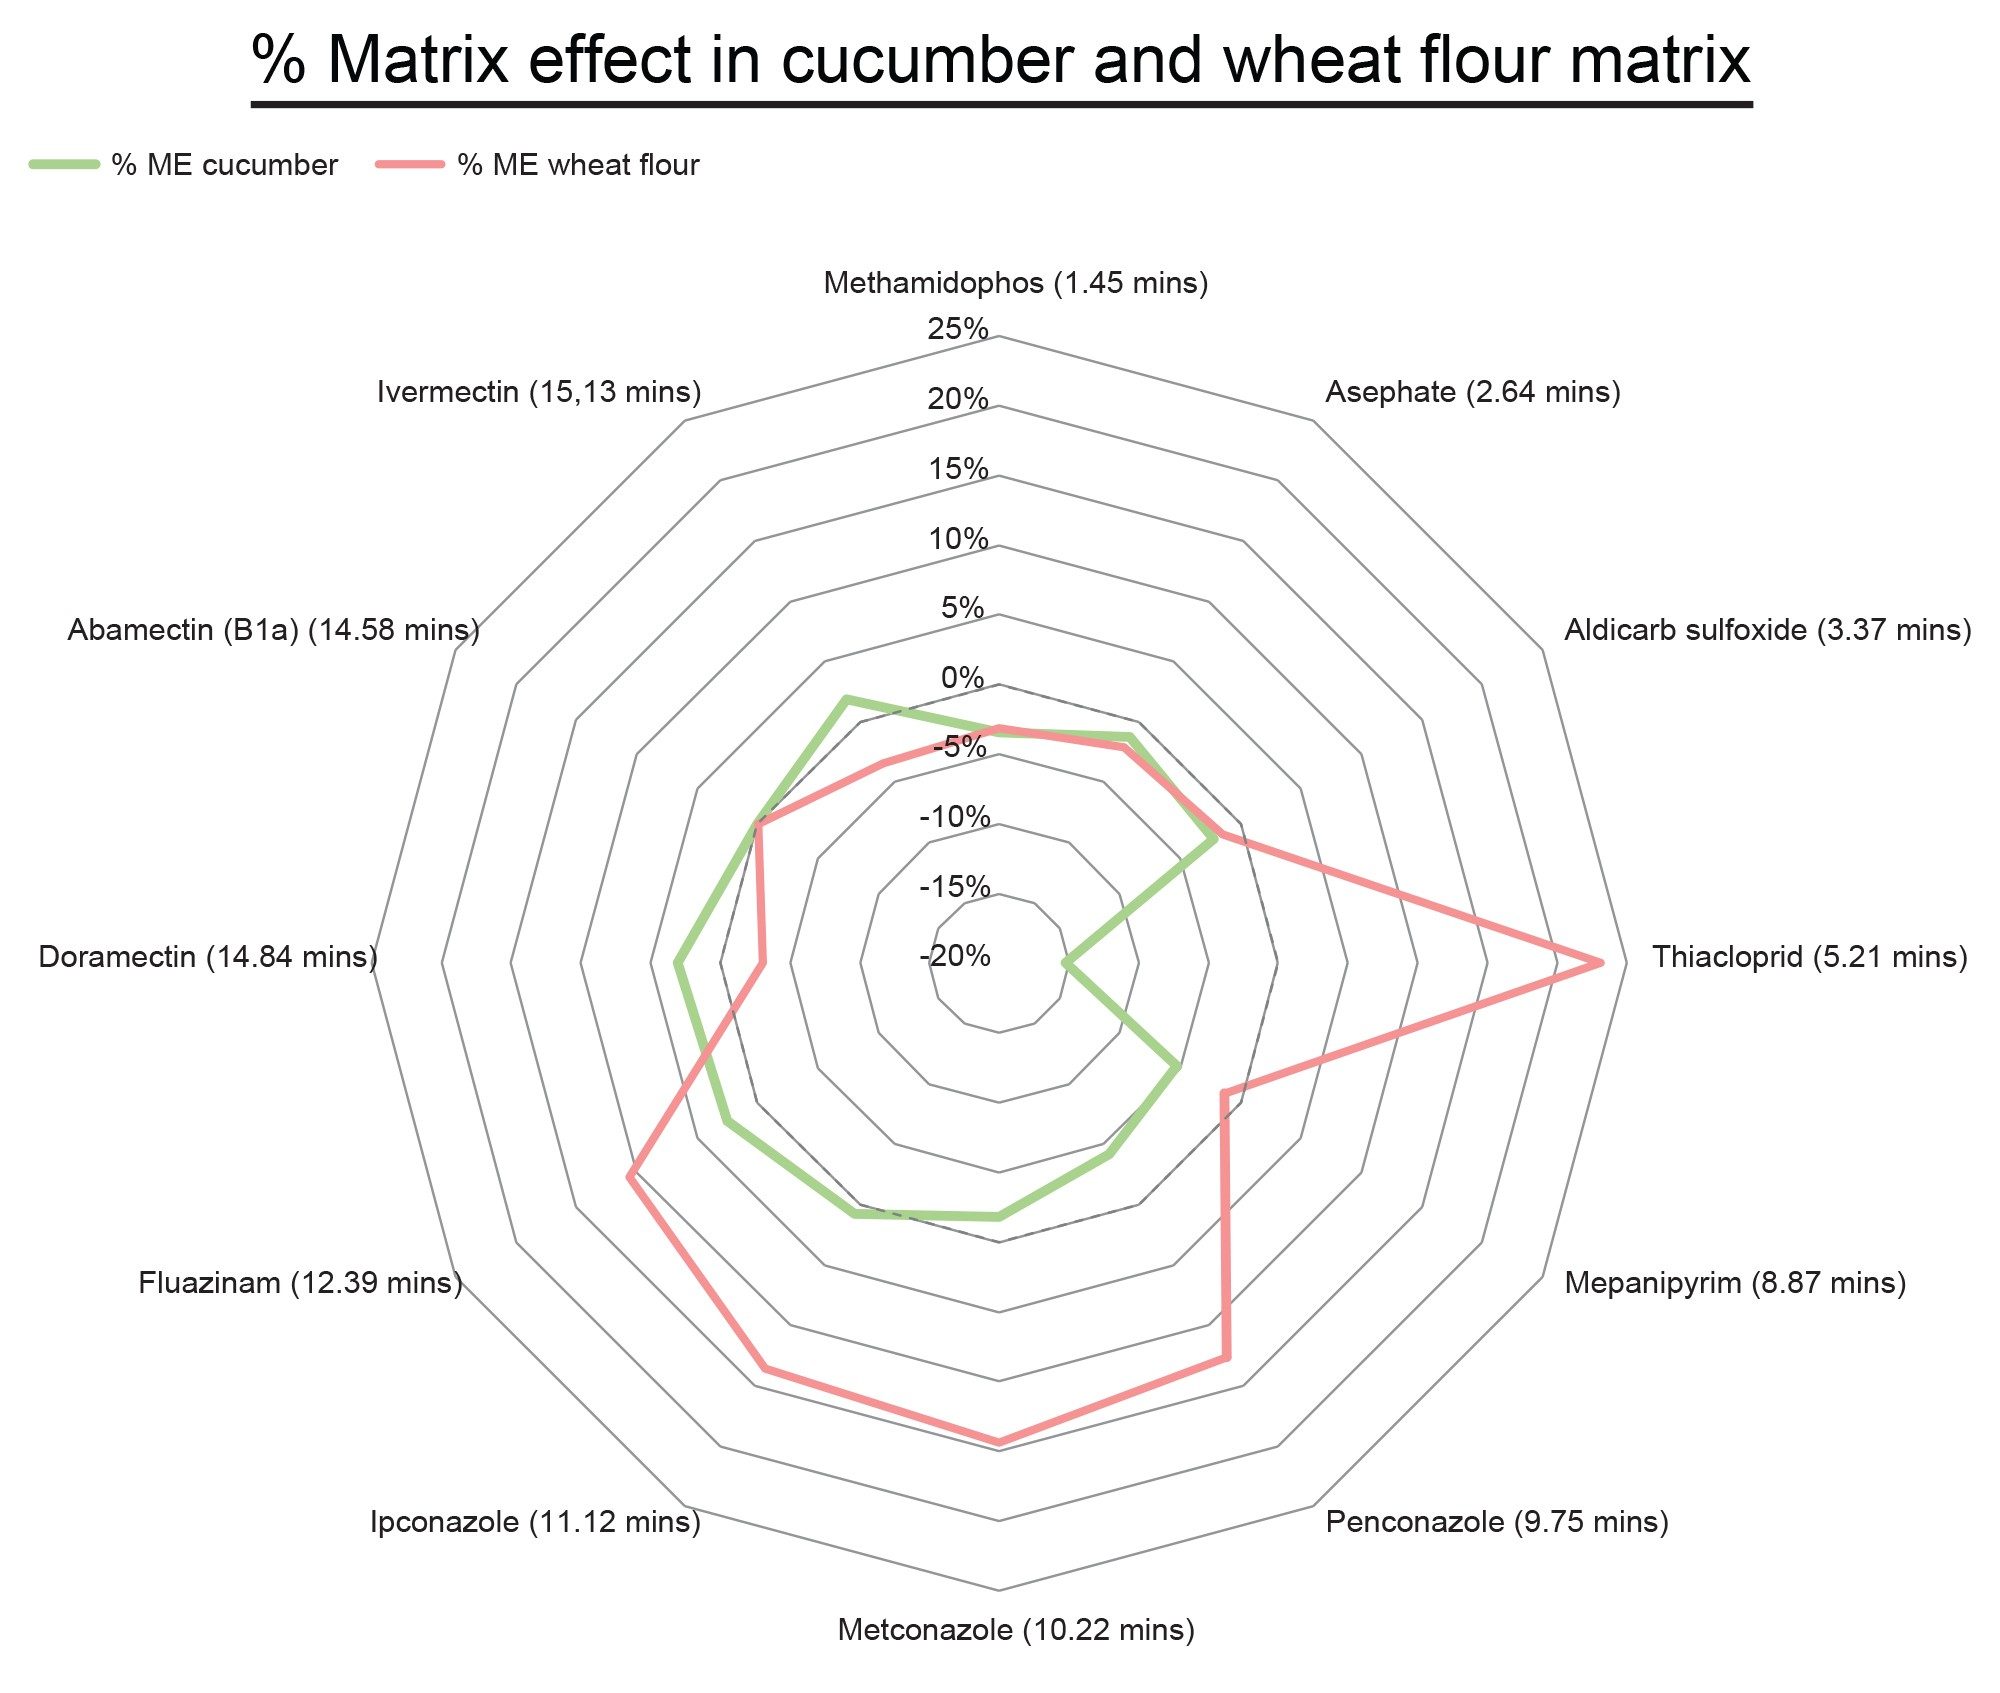
Matrix effects are often observed in routine pesticide analysis by LC-MS/MS and are primarily due to the presence of matrix components co-eluting with the analyte, thus competing for ionization efficiency. We have calculated matrix effect using the following percentage calculation:

Where bM and bS are the slope of the matrix-matched and solvent calibration curves respectively.
Compounds displayed in Figure 5 give a representation of the matrix effect across the method, with the first (methamidophos) and last (ivermectin) eluting compounds displayed amongst other compounds, as well as one of two negative compounds in the method (fluazinam).
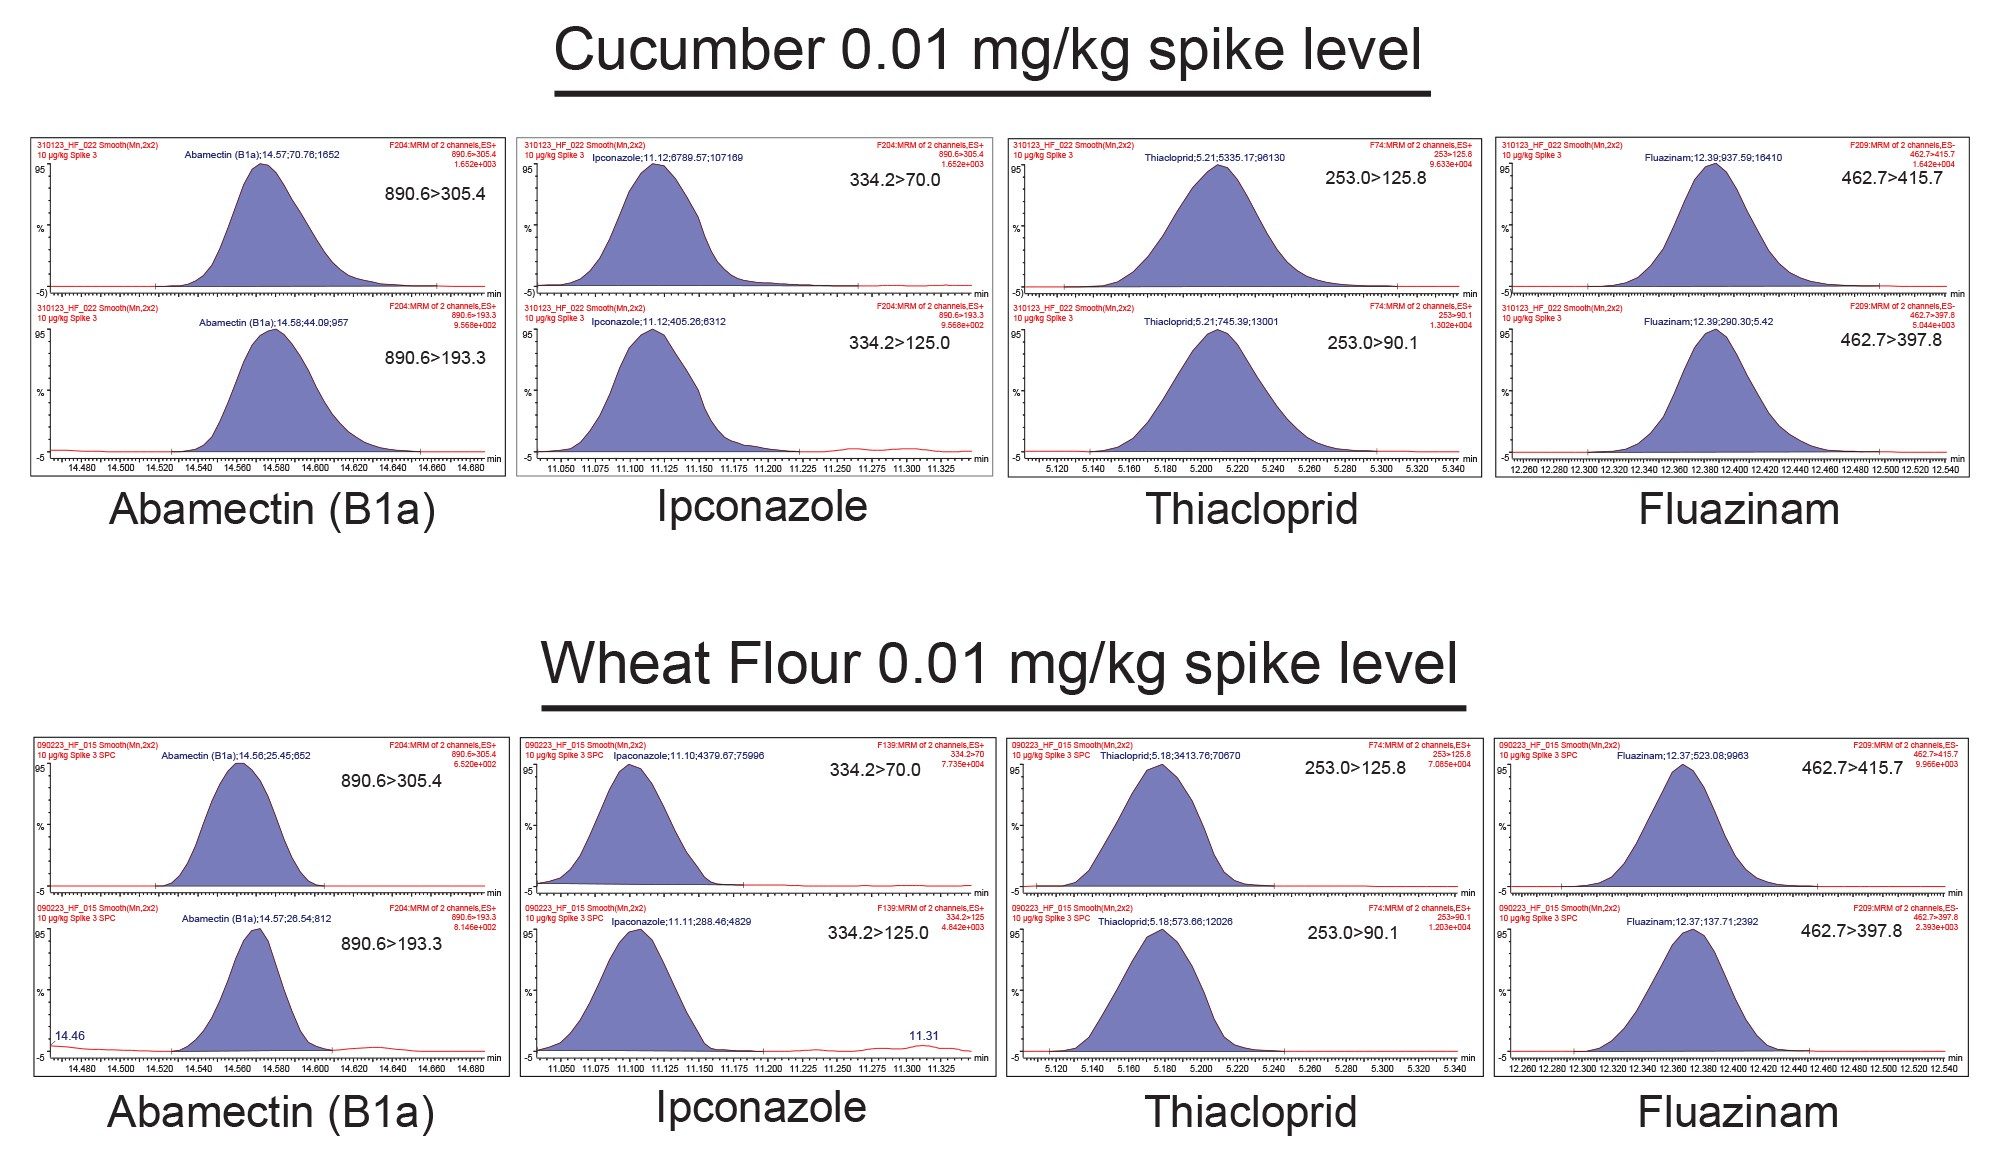
The retention times (RT) of all the analytes were found to be within the tolerance of ±0.1 minute. In general, where two transitions were detected for a pesticide, ion ratios were within the SANTE specified ±30% of the average of calibration standards for the same sequence. Example chromatograms can be seen in Figure 6.
The recovery was evaluated using the data from the analysis of the five replicate spikes, at two spike levels, 0.01 mg/kg and 0.1 mg/kg. SANTE guidelines specify an average recovery for each spike level tested to be between 70 and 120%. Demonstrated in Figure 7 and Figure 8, almost all recoveries plotted in both cucumber (94%) and in wheat flour (99%) are within the range of 70% to 120%, following the QuEChERS extraction and Oasis PRiME HLB Plus Short Cartridge clean-up.
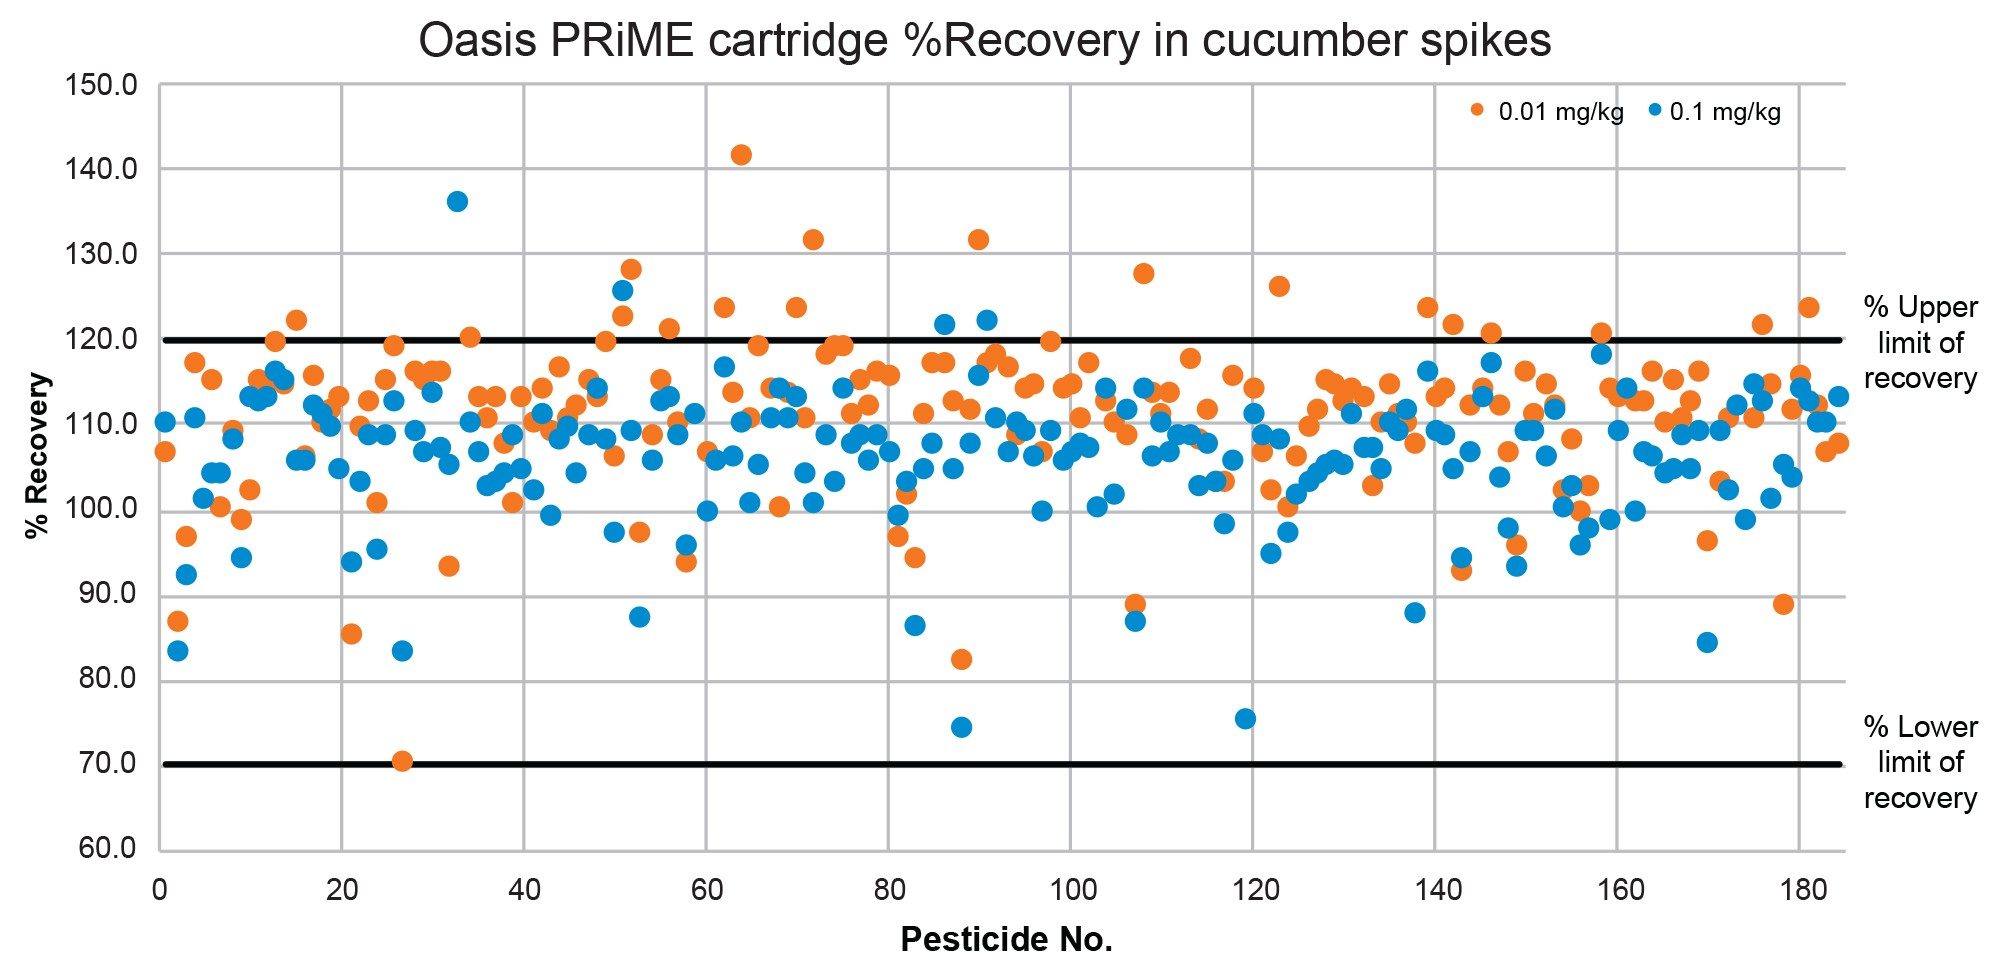
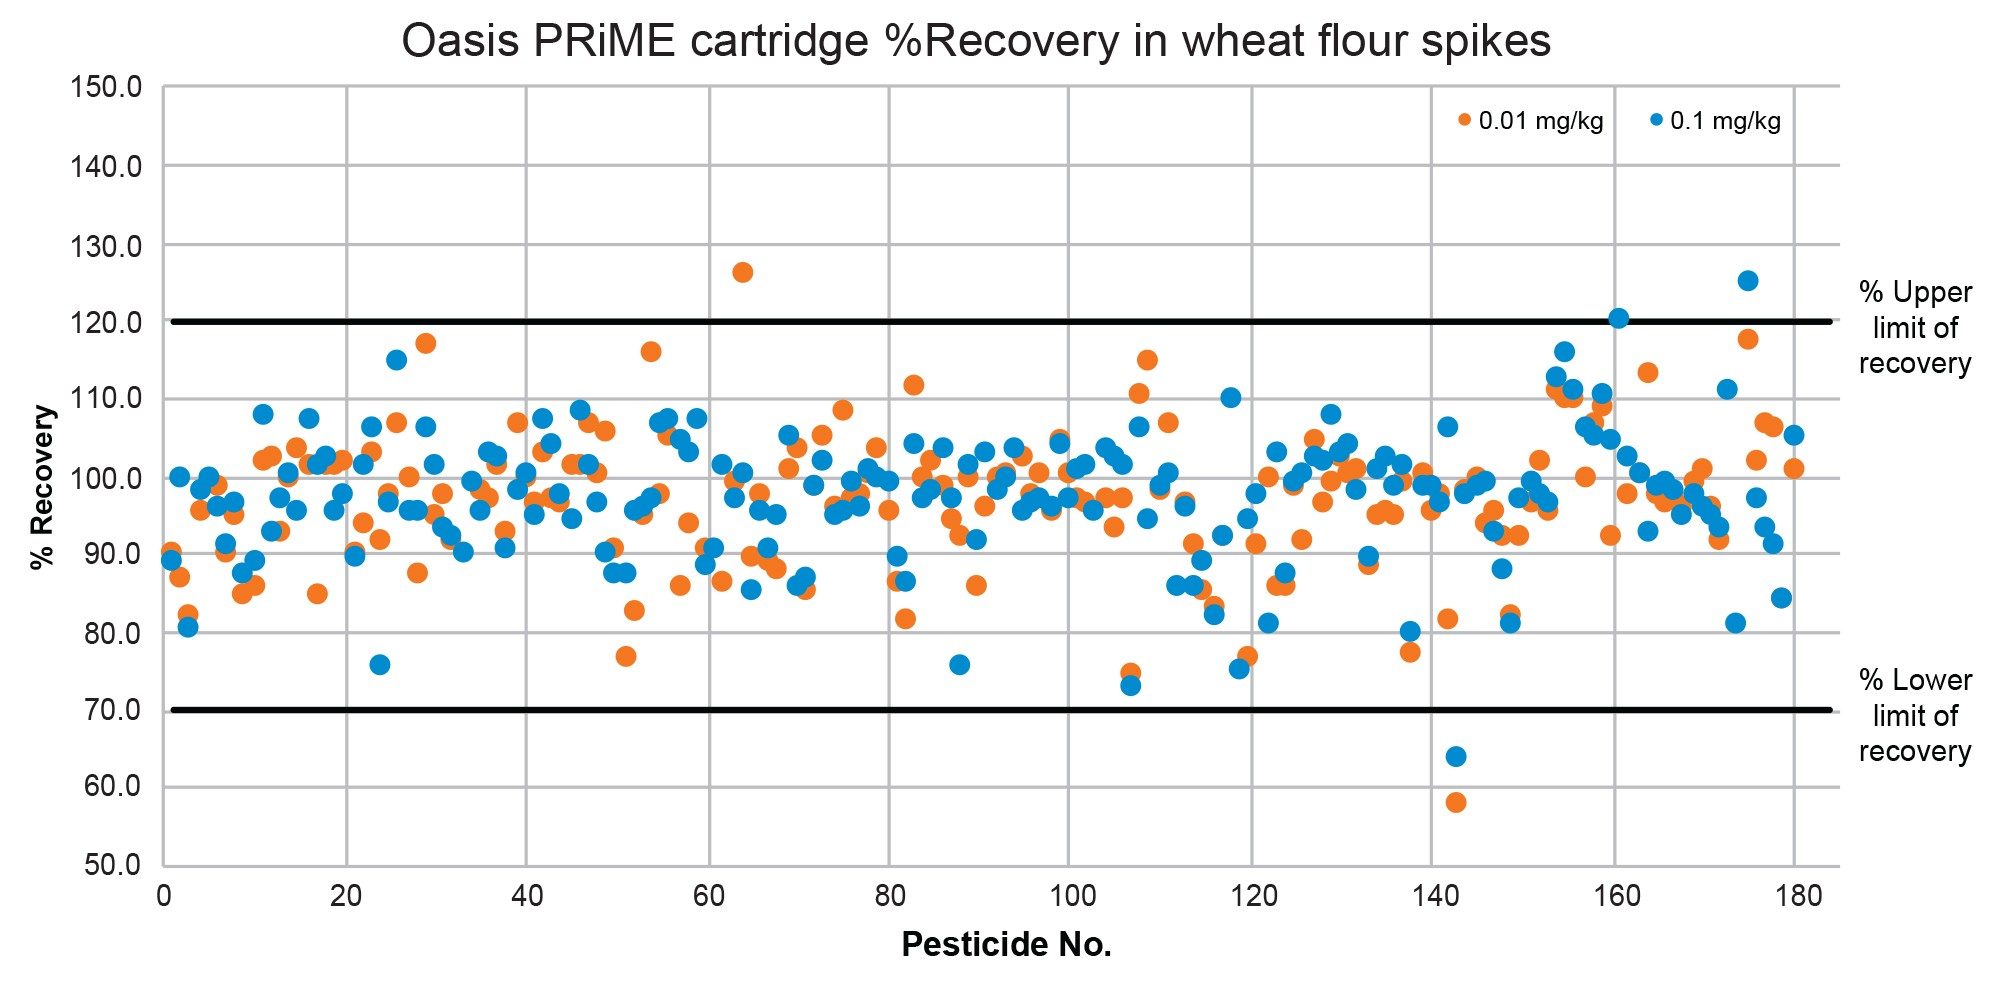
95% of compounds analyzed were detected at the lowest spike level 0.01 mg/kg in cucumber matrix, with recoveries ranging from 70–142% across both spike levels. In wheat flour, 93% of compounds were detected at the corresponding spike level, with recoveries ranging from 58–126% across the two spike levels.
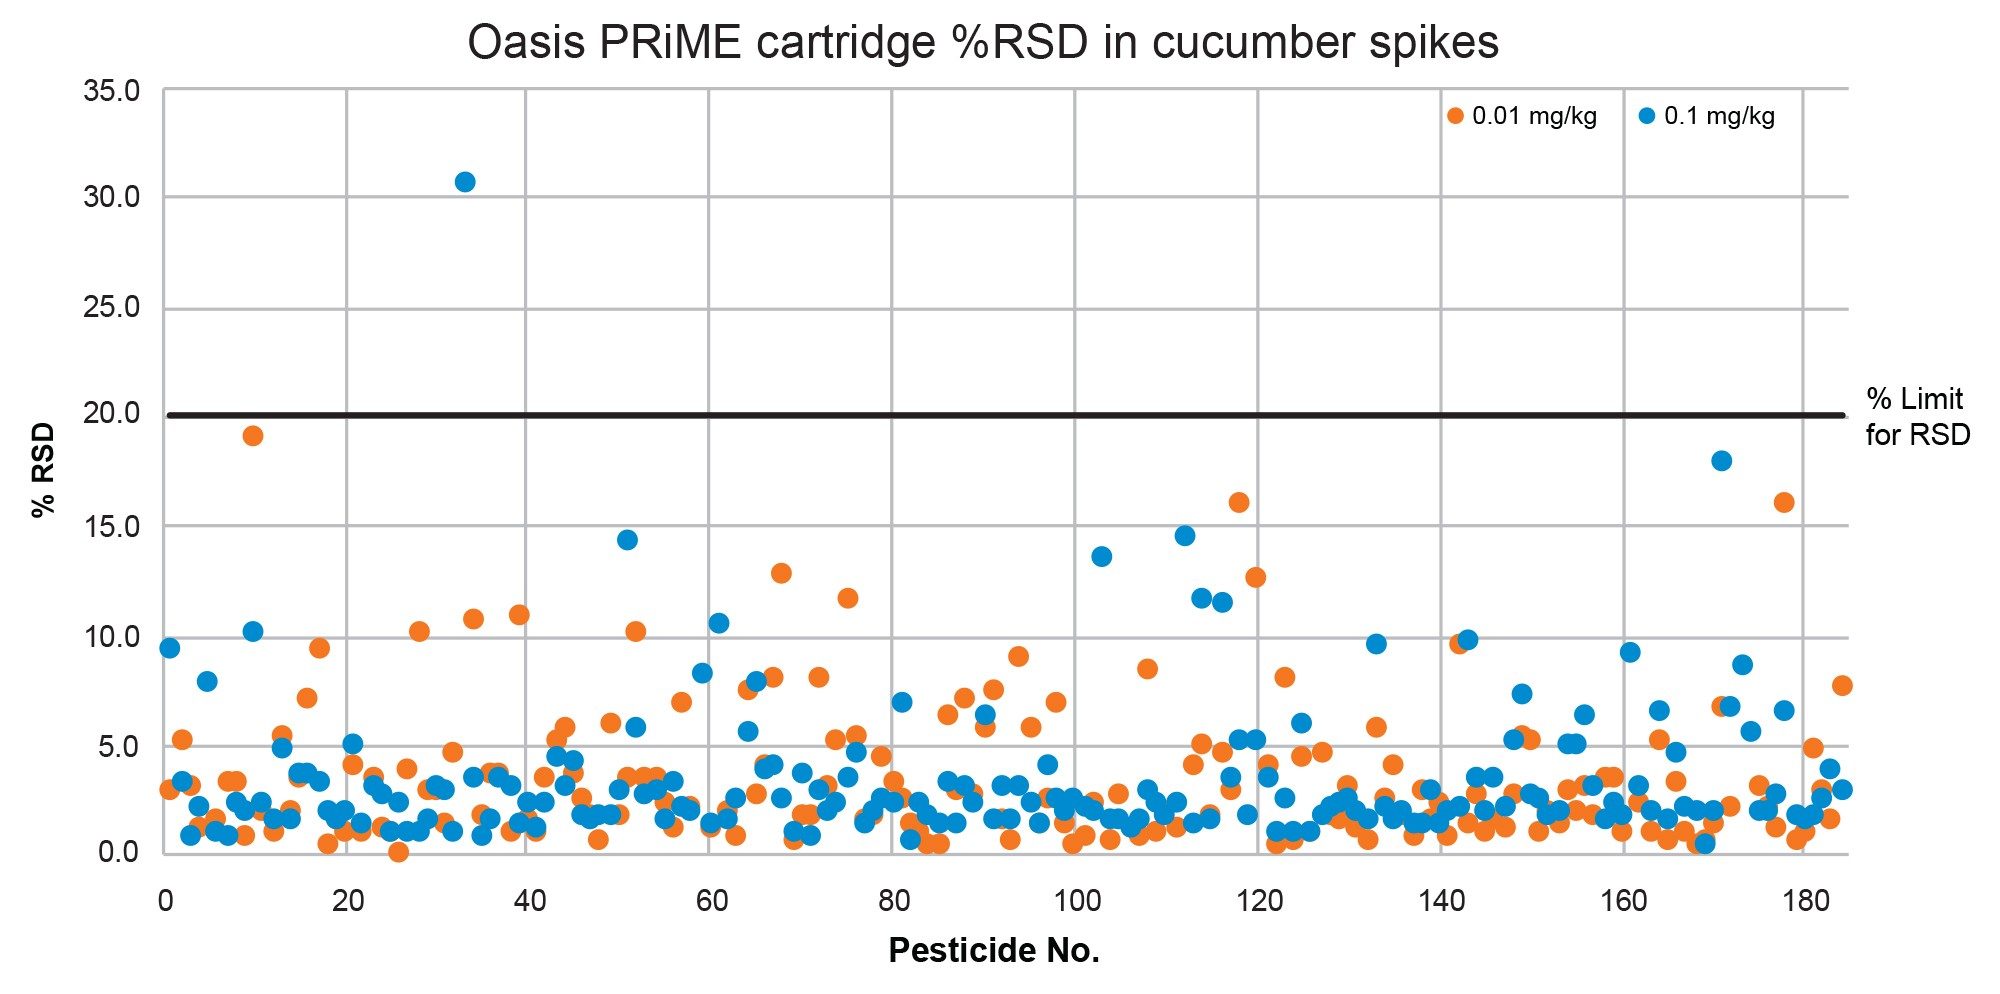
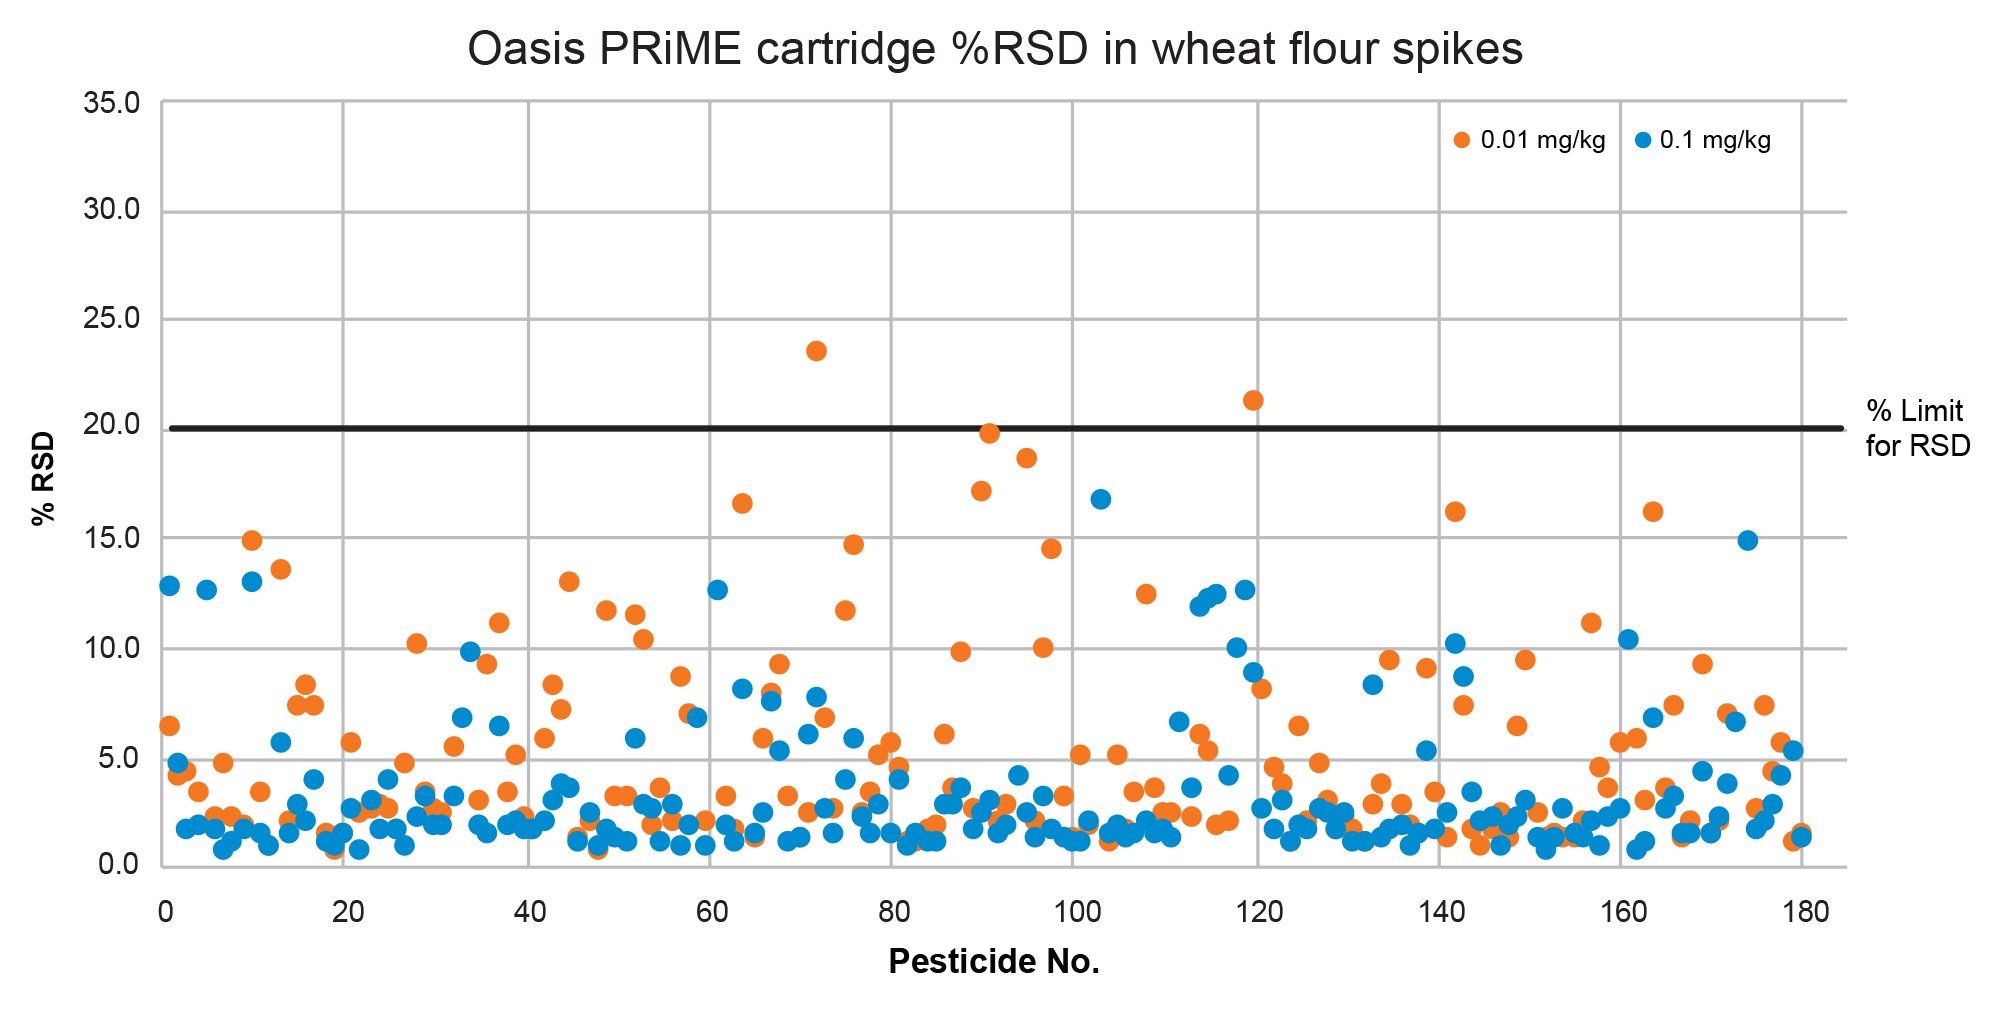
The repeatability (%RSD) of the method was satisfactory. This was assessed from the five replicates across both spike levels at 0.01 mg/kg and 0.1 mg/kg and was within the SANTE guidelines of ≤20% deviation in all but three cases: in cucumber at the 0.1 mg/kg spike level for clothianidin, and in wheat flour at the 0.01 mg/kg spike level for fipronil and myclobutanil. As shown in Figure 9 and Figure 10, 99% of analytes were within the %RSD tolerance for cucumber and wheat flour respectively. Mean %RSD across both spike levels was 3.6% in cucumber, and 4.1% in wheat flour.
Conclusion
Here we described a sensitive and accurate multi-residue method for the determination of pesticide residues in common matrices of cucumber and wheat flour, using UHPLC-MS/MS with an ACQUITY Arc coupled to a Xevo TQ-S cronos Tandem Quadrupole Mass Spectrometer. The method allows for the reliable quantification at typical EU MRL concentrations of 0.01 mg/kg for over 150 pesticides - in accordance with SANTE guidelines for calibration, sensitivity, and within-lab reproducibility. The CORTECS T3 Column demonstrated comparable run times to traditional UPLC multi-residue methods, with similar method performance. Pass through SPE with Oasis PRiME HLB offers a fast and effective alternative to dSPE, with interferences shown to be of an acceptable level following clean-up.
References
- Study Supporting The Evaluation Of Directive 2009/128/Ec On The Sustainable Use Of Pesticides And Impact Assessment Of Its Possible Revision. https://ec.europa.eu/food/document/download/89cff414-b640-4099-881e-7828790c565f_en?filename=pesticides_sud_workshop_20210504_pres_study.pdf
- EFSA Guide to MRLs in pesticides. https://www.efsa.europa.eu/en/topics/topic/pesticides#group-maximum-residue-levels-
- SANTE/11312/2021. https://food.ec.europa.eu/system/files/2022-02/pesticides_mrl_guidelines_wrkdoc_2021-11312.pdf
- QuEChERS website (accessed March 24, 2023). https://www.quechers.eu/
- European Committee for Standardisation (CEN) EN 15662:2018. Foods of Plant Origin - Multimethod for the Determination of Pesticide Residues Using Gc- And LC- Based Analysis Following Acetonitrile Extraction/Partitioning and Clean-up by Dispersive Spe - Modular Quechers-Method. https://standards.iteh.ai/catalog/standards/cen/167a30bc-edf9-4cf8-b96b-cabd932f2f02/en-15662-2018
- Dimple D. Shah, JodiAnn Wood, Gordon Fujimoto, Eimear McCall, Simon Hird, Peter Hancock. Multiresidue Method for the Quantification of Pesticides in Fruits, Vegetables, Cereals, and Black Tea using UPLC-MS/MS. Waters Application Note. 720006886. February 2021.
Appendix
720007918, August 2023