Fast RPLC Method Development for Structurally Similar Triazine Herbicides Using MaxPeak™ Premier Columns and the Systematic Screening Approach
Abstract
Triazine herbicides are commonly used in crop management to remove invasive plant species. These herbicides disrupt the photosynthesis cycle, leading to plant death and can contaminate soil and groundwater if used in high enough concentrations and for long enough duration. As such, the monitoring of these herbicides is important to minimize and monitor contamination. To monitor these analytes, an appropriate method is needed with sufficient performance to ensure robust analysis of the samples.
In the work shown, a systematic screening protocol was used to develop a method for the analysis of a mixture of seven structurally similar triazine herbicides. The final method conditions were realized after only eleven hours spread over two days of development and optimization. The final method conditions utilized an XBridge™ Premier BEH C18 Column and basic modified acetonitrile mobile phases. Good separation and detection were achieved for all seven analytes with both UV and MS detection, allowing both to be used for future work such as sample analysis or quantitation.
Benefits
- Baseline separation of seven analytes using an XBridge Premier BEH C18 Column
- Method development of a mixture of structurally similar compounds in eleven hours
- Systematic screening protocol reduces decision making by streamlining the process
Introduction
The use of herbicides and pesticides have been commonplace for several years. Only recently have environmental regulations changed to monitor and eliminate the use of some pesticides and herbicides. While their use has several benefits, these compounds can often contaminate the soil and groundwater, leading to significant environmental impacts. Once these compounds enter the groundwater and soil, they can enter the food chain leading to wildlife death. Due to their impact on the environment, monitoring the use of pesticides and herbicides is strictly controlled. As such, appropriate analytical methods are needed to separate and detect the compounds. Method development using reversed-phase liquid chromatography (RPLC) is one route forward, particularly for certain classes of compounds, like triazine herbicides.
Triazine herbicides control invasive plant life by disrupting the process of photosynthesis leading to cell death. The most common triazine herbicide is atrazine, which has been shown to not only be effective at killing weeds but can also leach into the soil and groundwater affecting aquatic ecosystems.1 Other triazine herbicides, like propazine and simazine, have also been included in several monitoring programs to determine their effect on aquatic life.2 As seen in the cited work, RPLC is a common method for monitoring these compounds, as long as adequate separation is achieved. The use of mass spectrometry (MS) is also common and benefits from having complete separation of the analytes of interest, as a full separation improves MS signal.
Creating a method for the retention and detection of triazine herbicides is simple enough using the well documented systematic screening protocol.3–6 This systematic screening uses a tiered analytical approach, where-in an analyst first assesses retention at high and low pH, then locks in that pH. Next a column and mobile phase screen takes place, and the best combination of stationary phase and mobile phase are selected. Lastly, if needed, method optimization is performed. By using this approach, a method can be developed quickly with minimal decision-making.
By coupling the easy-to-use systematic screening protocol with MaxPeak Premier Columns, which contain MaxPeak High-Performance Surfaces (HPS) technology, analysts can eliminate the doubt in their separation. MaxPeak Premier Columns are specifically designed to mitigate secondary interactions between the metal surfaces of the system, including the column, and the analytes of interest. This technology specifically mitigates the ionic interactions between the metal surfaces and the compounds of interest; however, it has been shown to improve overall separation quality for a variety of analyte classes.7–10 The work presented shows the application of the systematic screening protocol to a mixture of seven triazine herbicides using MaxPeak Premier Columns to ensure the most accurate data possible is obtained.
Experimental
Sample Description
A single mixture of triazine herbicides was purchased from Sigma Aldrich (p/n: CRM48392) with a starting concentration of 100 µg/mL each. The standard was diluted 1:10 with water and injected. Final sample composition was 90:10 water:methanol with a final concentration of 10 µg/mL of each herbicide.
LC Conditions
|
LC system: |
ACQUITY UPLC™ H-Class Plus System with Quaternary Solvent Manager (QSM) with optional solvent select valve, Sample Manager Flow Through Needle (SM-FTN), Column Manager, Column Manager Aux, PDA detector, and QDa mass detector |
|
Detection: |
UV @ 220 nm (unless noted) MS full scan and SIRs used for peak tracking |
|
Columns: |
All Columns are 2.1 x 50 mm with 2.5 µm particles XBridge Premier BEH C18 (p/n: 186009827) XSelect™ Premier CSH Phenyl-Hexyl (p/n: 186009879) XBridge Premier BEH Shield RP18 (p/n: 186009914) Atlantis Premier BEH C18 AX (p/n: 186009390) |
|
Column temperature: |
30 °C |
|
Sample temperature: |
10 °C |
|
Injection volume: |
1.0 µL |
|
Flow rate: |
0.7 mL/min |
|
Mobile phase A: |
Milli-Q Water |
|
Mobile phase B: |
Acetonitrile |
|
Mobile phase C: |
Methanol |
|
Gradient conditions: |
Constant 5% D was maintained throughout the gradient to ensure consistent additive concentration. Linear gradient of 5–95% B/C over 4.90 minutes. Hold at 95% B/C for 0.82 minutes. Return to starting conditions of 5% B/C and hold for 1.6 minutes. Total run time 7.37 minutes. Optimized gradient details provided in figure captions. |
Data Management
|
Chromatography software: |
Empower™ 3 Feature Release 4 |
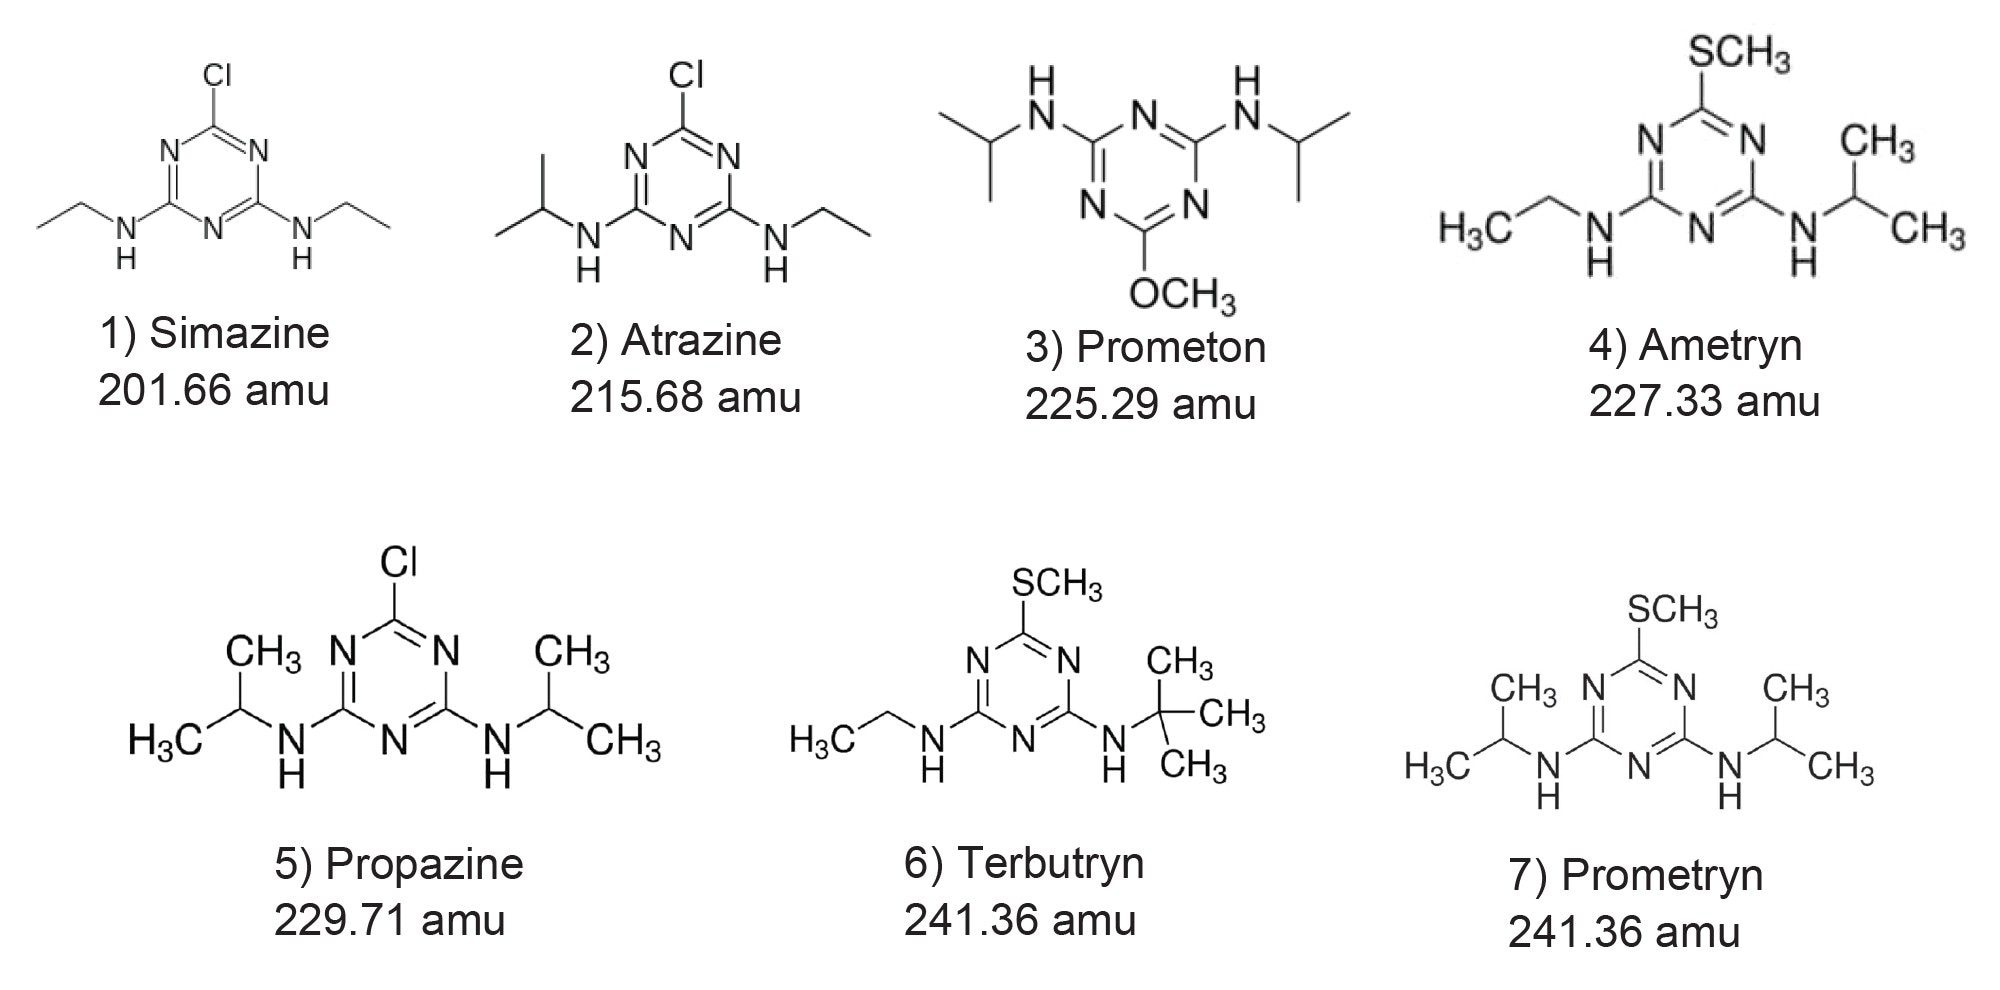 Figure 1. Chemical structures of analytes present in sample mixture. Note isobaric compounds terbutryn (6) and prometryn (7).
Results and Discussion
As outlined in previous work, the systematic screening protocol to method development starts with assessing the effect of mobile phase pH on the separation.6–10 This is done using a high pH compatible stationary phase like the XBridge Premier BEH C18 Column. This Column employs a hybrid silica base particle which is resistant to dissolution at high pH. A standard screening gradient of 5–95% acetonitrile is used with both low pH and high pH additives, formic acid and ammonium hydroxide, respectively. Once the data is run, the results are examined to determine which additive provides the most retention. Figure 2 shows the two chromatograms from this first step of the systematic screening protocol.
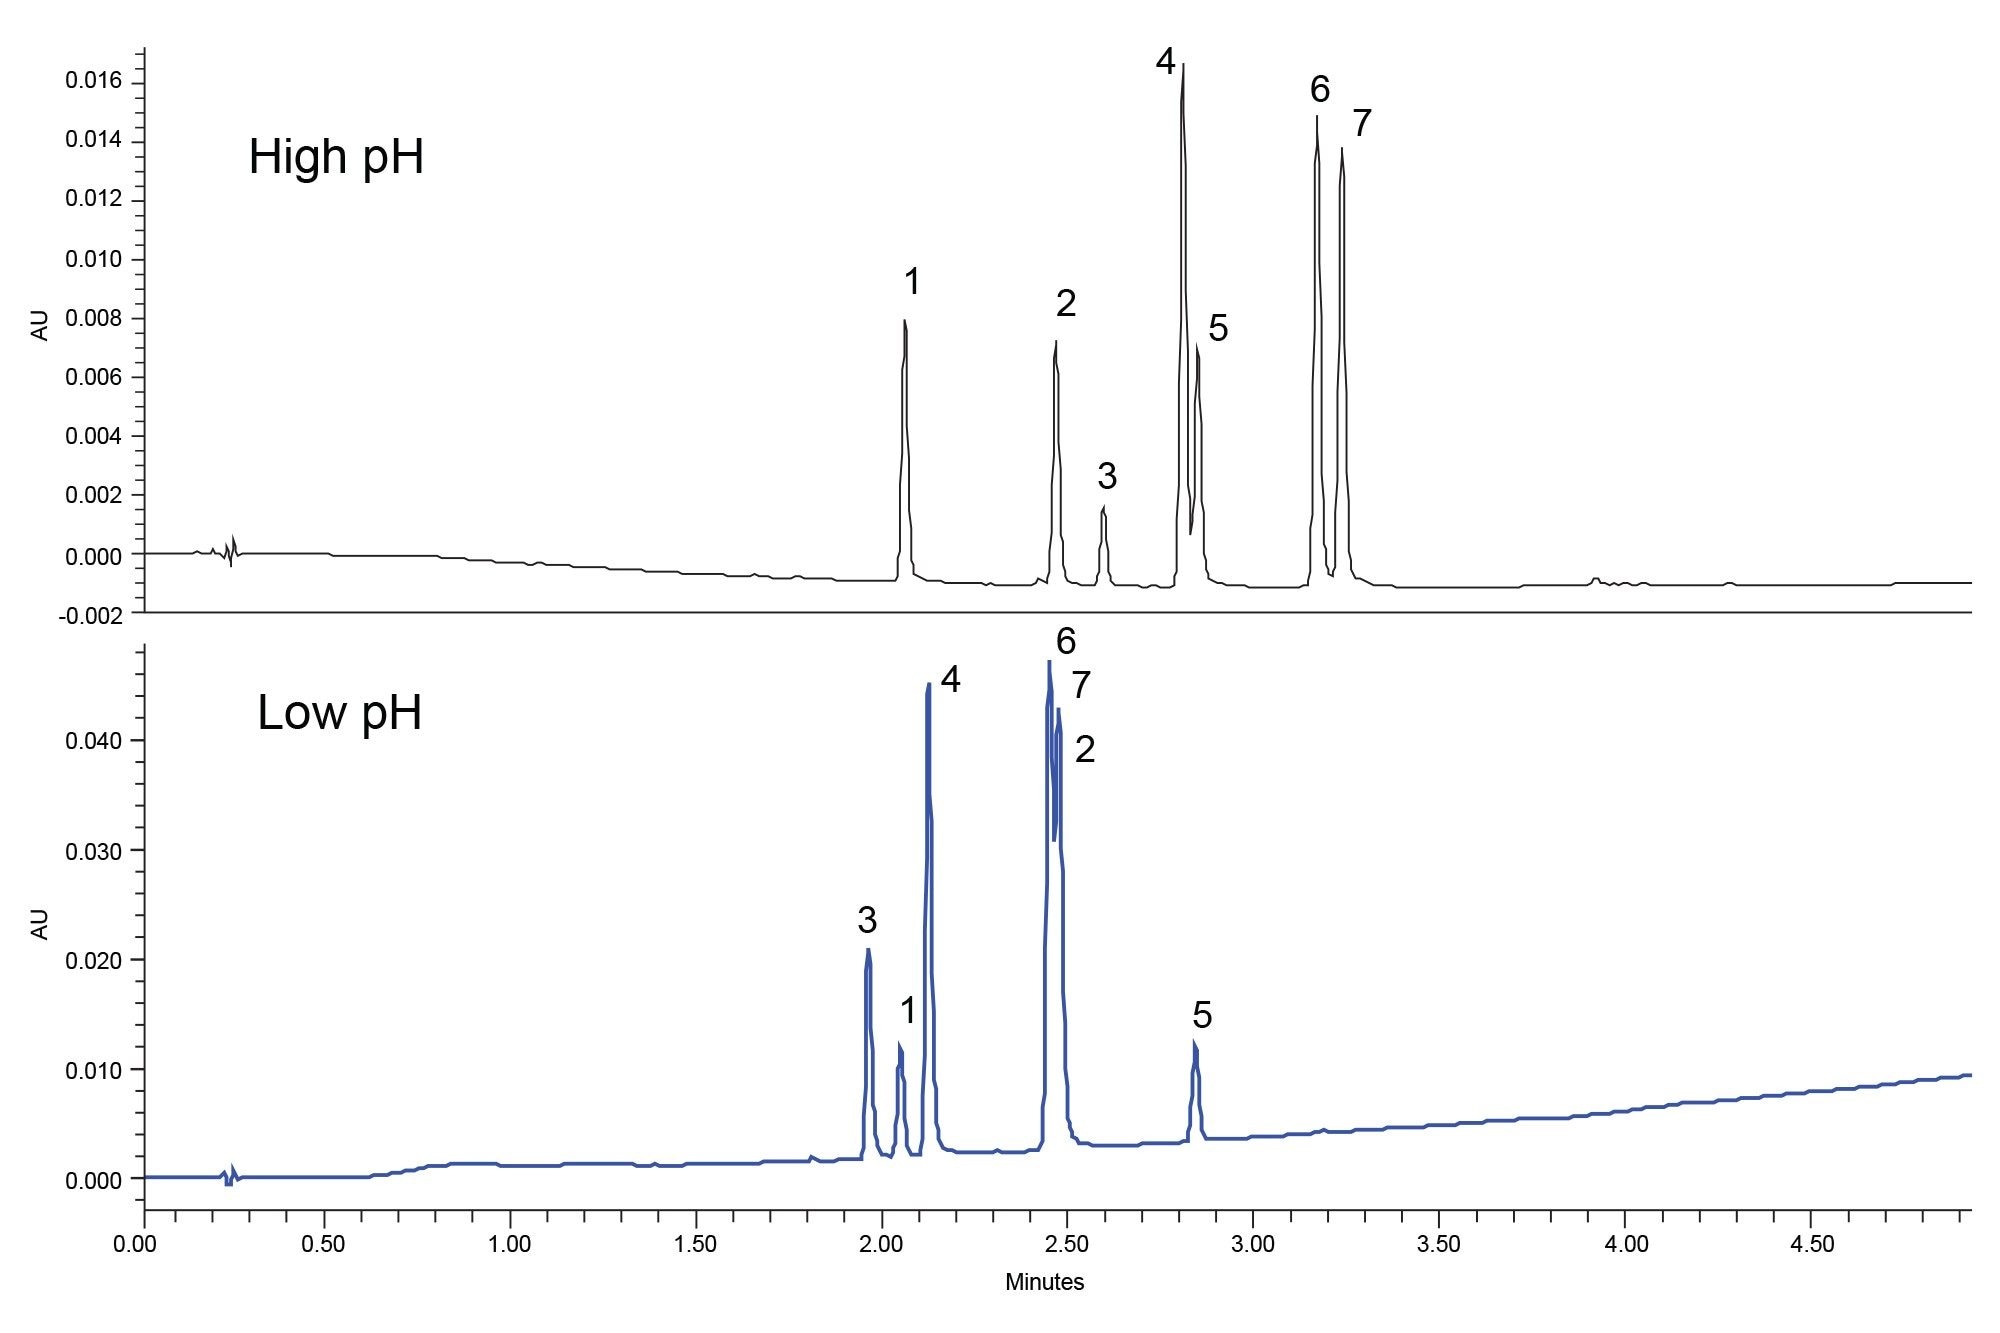 Figure 2. Rapid pH scouting results using the XBridge Premier BEH C18 Column using UV detection at 254 nm. Component IDs listed in Figure 1.
Good retention is seen for both additives, with the first compound eluting around the two-minute mark, which is almost halfway through the gradient. However, high pH shows better overall retention with the elution window being 2–3.5 minutes while low pH is ~2–3 minutes. The higher retention of the high pH additive allows an analyst more possibilities for method optimization if that step is needed. Additionally, this step allows the analyst to get a better sense of the analytes in question and how they behave at both high and low pH. All the compounds are less retained at low pH except for peak 5, propazine, which has similar retention between the two experiments.
As high pH provides the best overall retention for these probes, the additive is locked in for future experiments. This will have a profound impact on the next step, which is stationary phase and organic solvent screening. Given that high pH was selected, the stationary phases used must be high pH stable, i.e., hybrid base particles. This somewhat limits the options for bonded chemistry that can be used. Thankfully, there are options to maximize column selectivity even at high pH. For this work the XBridge Premier BEH C18 Column will be tested in the second step, along with the XSelect Premier CSH Phenyl-Hexyl Column, the XBridge Premier BEH Shield RP18 Column, and lastly the Atlantis Premier BEH C18-AX Column. These Columns all use hybrid base particles with different bonded ligands which should provide some selectivity benefits. The phenyl-hexyl stationary phase is ideally suited for analyzing compounds with aromatic rings by providing potential secondary π-π interactions when methanol is used. The shield RP18 stationary phase uses a similar linear chain ligand, but employs an embedded polar group, in this case a carbamate group, which can affect retention and separation of compounds especially at low percentages of acetonitrile. Lastly, the C18-AX stationary phase is a mid-coverage C18 with an ionic exchange (IEX) functional group. While the IEX group is designed to retain polar analytes, it can still have an impact on the separation of non-acidic probes. Figure 3 shows the separation of the triazine herbicides on the four stationary phases with methanol as the strong solvent.
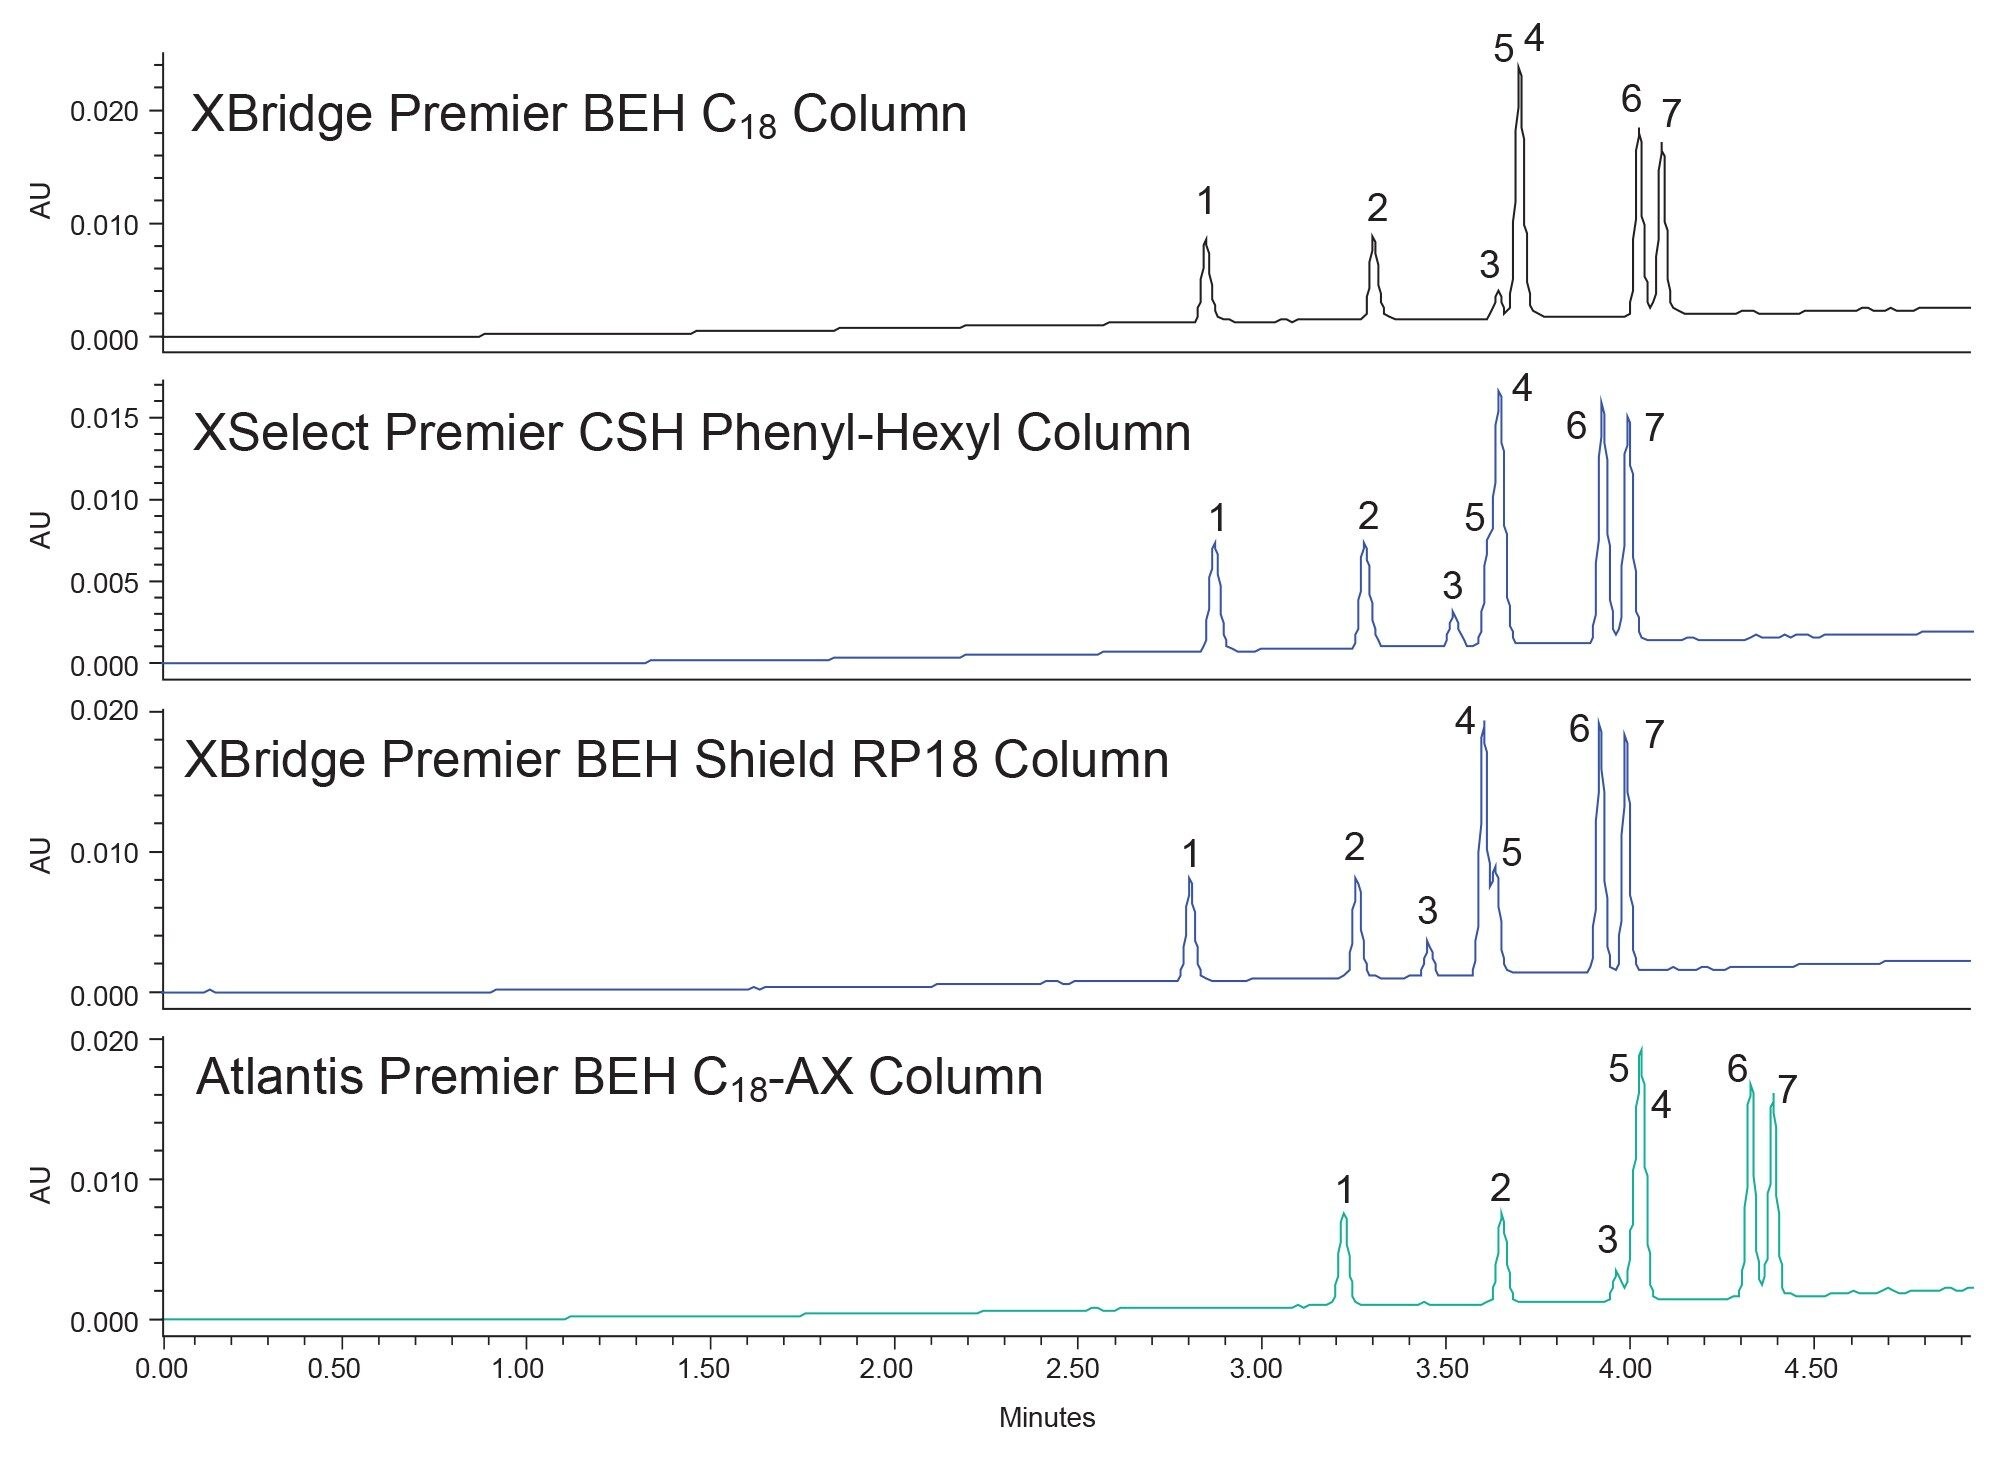 Figure 3. Chromatograms of Column and solvent screening using methanol at UV 254 nm. Components IDs listed in Figure 1.
None of the Columns selected could fully separate the seven components present. Components 4 and 5, ametryn and propazine, respectively, were very difficult to separate under these conditions, co-eluting with each other on all four stationary phases. Additionally, on the C18-AX stationary phase, component 3 co-elutes partially with the pair. One thing of note when looking at these separations is the elution order of ametryn (4) and propazine (5). On three of the phases, propazine elutes first, but not on the Shield RP18 stationary phase. On that Column, the propazine peak elutes after ametryn. This is mostly likely due to the presence of the carbamate group in the bonded ligand. Ultimately though, none of these experiments provided a good separation that could be used for method optimization. Figure 4 shows the separation of the same mixture of compounds, using the same columns and an acetonitrile mobile phase.
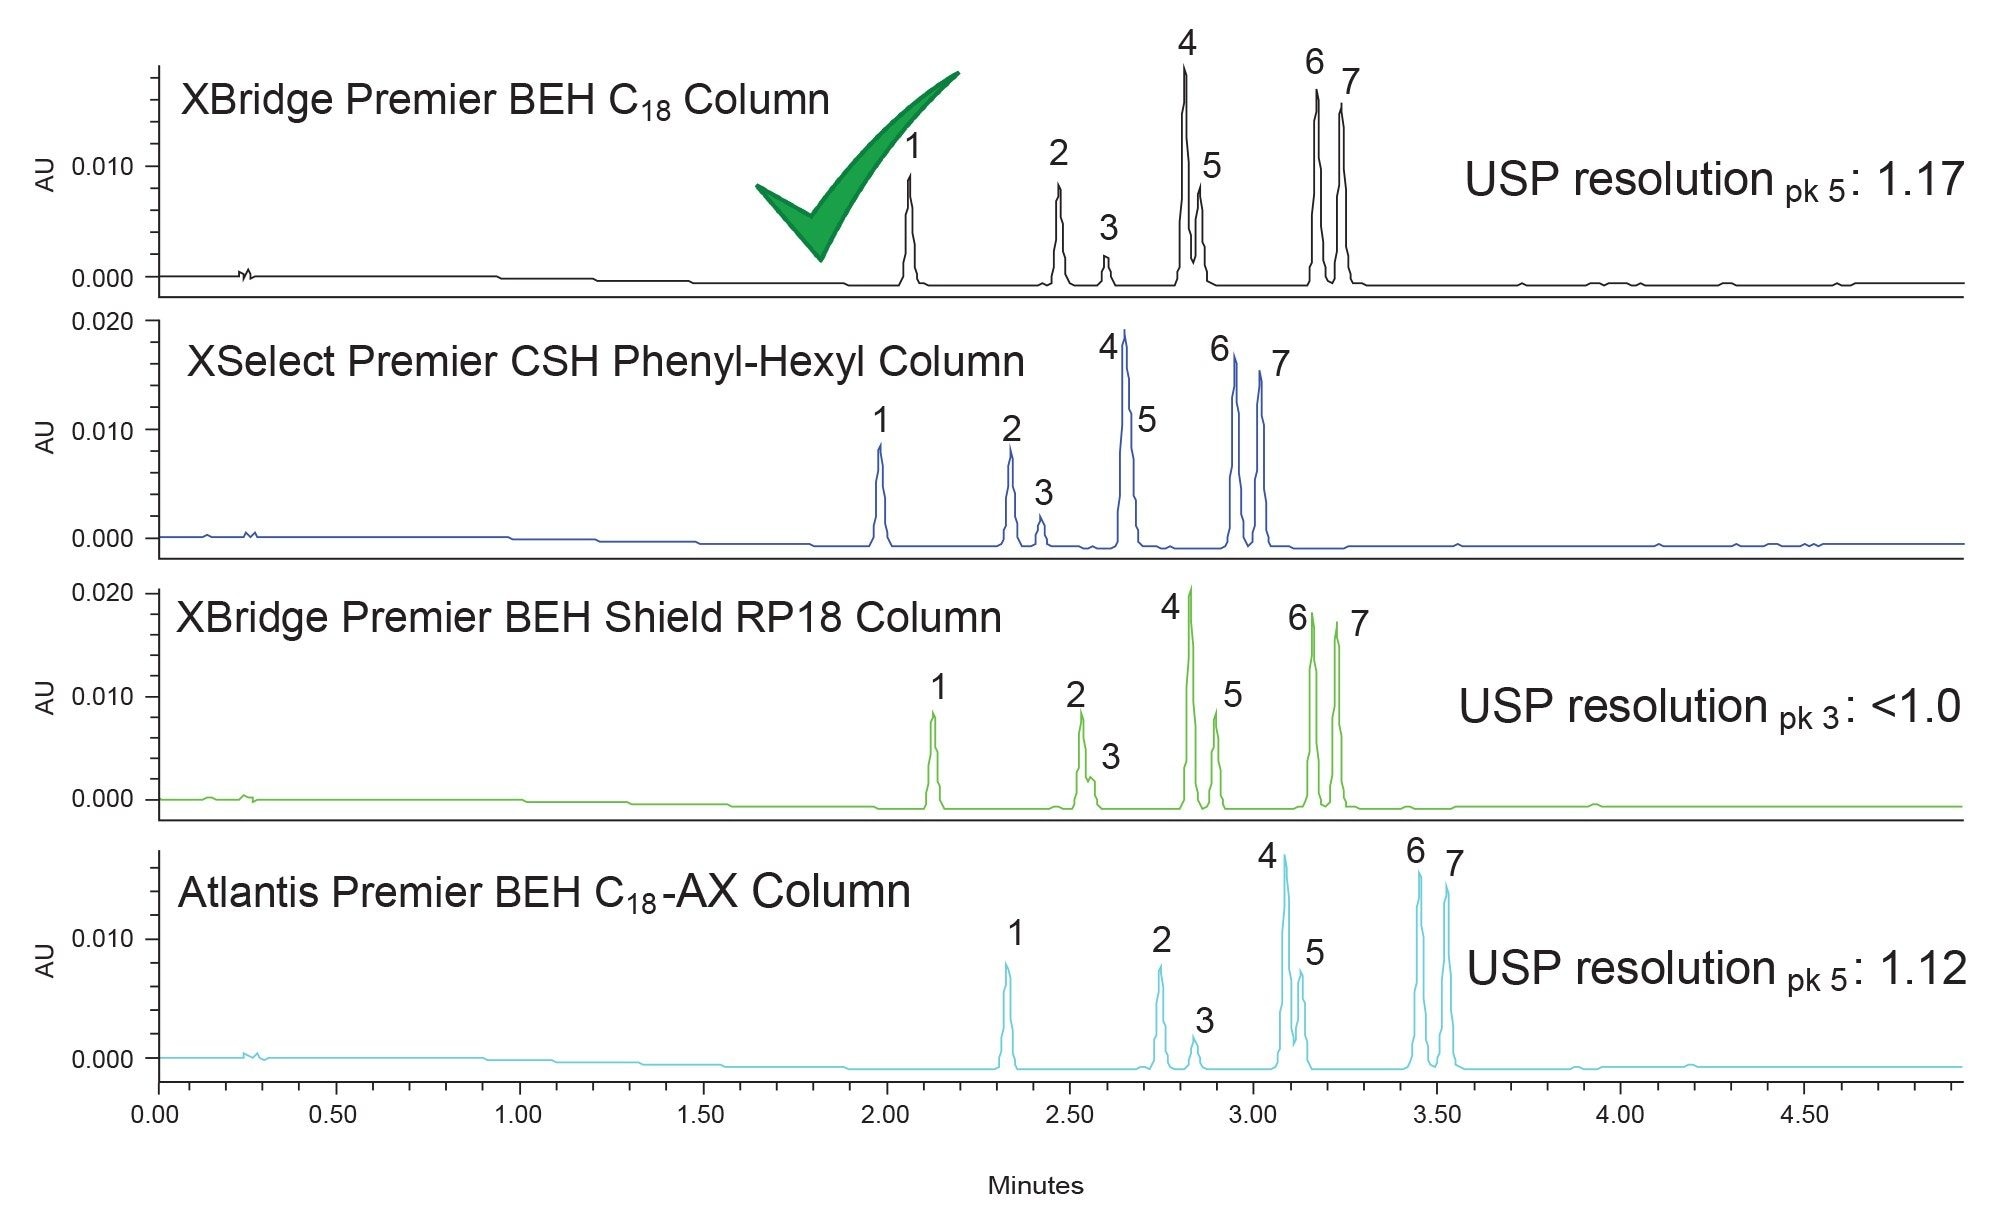 Figure 4. Chromatograms of Column and solvent screening using acetonitrile at UV 254 nm. Components IDs listed in Figure 1.
Components 4 and 5 were still co-eluting on a few of the stationary phases with acetonitrile. However, there was partial separation of the compounds on both the C18 and C18-AX stationary phases. The Shield RP18 stationary phase completely resolves the pair as well. However, the Shield RP18 was unable to separate components 2 and 3, atrazine and prometon, respectively. Those two were well resolved on the other phases though.
When examining these chromatograms for a suitable set of conditions, the Phenyl-Hexyl stationary phase can be ruled out due to the poor resolution between components 4 and 5. The remaining three sets of conditions have their benefits and drawbacks. If the USP resolution of the co-eluting pair are examined for each critical pair on the remaining three conditions, the Shield RP18 Column would be ruled out next. With a USP resolution of <1.0 for peak 3, optimizing the method on that column would be difficult. The separations on the C18 and C18-AX stationary phases are very similar with USP resolutions of 1.17 and 1.12 for peak 5, respectively. Taking a purely objective stand, the XBridge Premier BEH C18 Column provides the best separation for optimization. However, the Atlantis Premier BEH C18-AX may also be suitable for optimization. For this work, the C18 stationary phase was used for method optimization.
Method optimization includes, but is not limited to, adjusting gradient slope, mobile phase starting and ending organic percentages, column temperature, and column dimensions or particle sizes. For this work, the first steps taken were to increase the percentage of organic at the start of the method, while also shallowing the gradient. This was done in two steps. First, the approximate percent of organic solvent was calculated based on when the first peak elutes. In this case, given the screening gradient, the first peak simazine elutes at approximately 40% organic. For the optimization step, a starting percentage of 35% was used to ensure adequate retention of that first peak. From there the gradient was shallowed from the initial 3.0% organic/column volume (Vc). Two different gradient slopes were tested and USP resolution of peak 5 was monitored. Figure 5 shows the separations obtained from this optimization step.
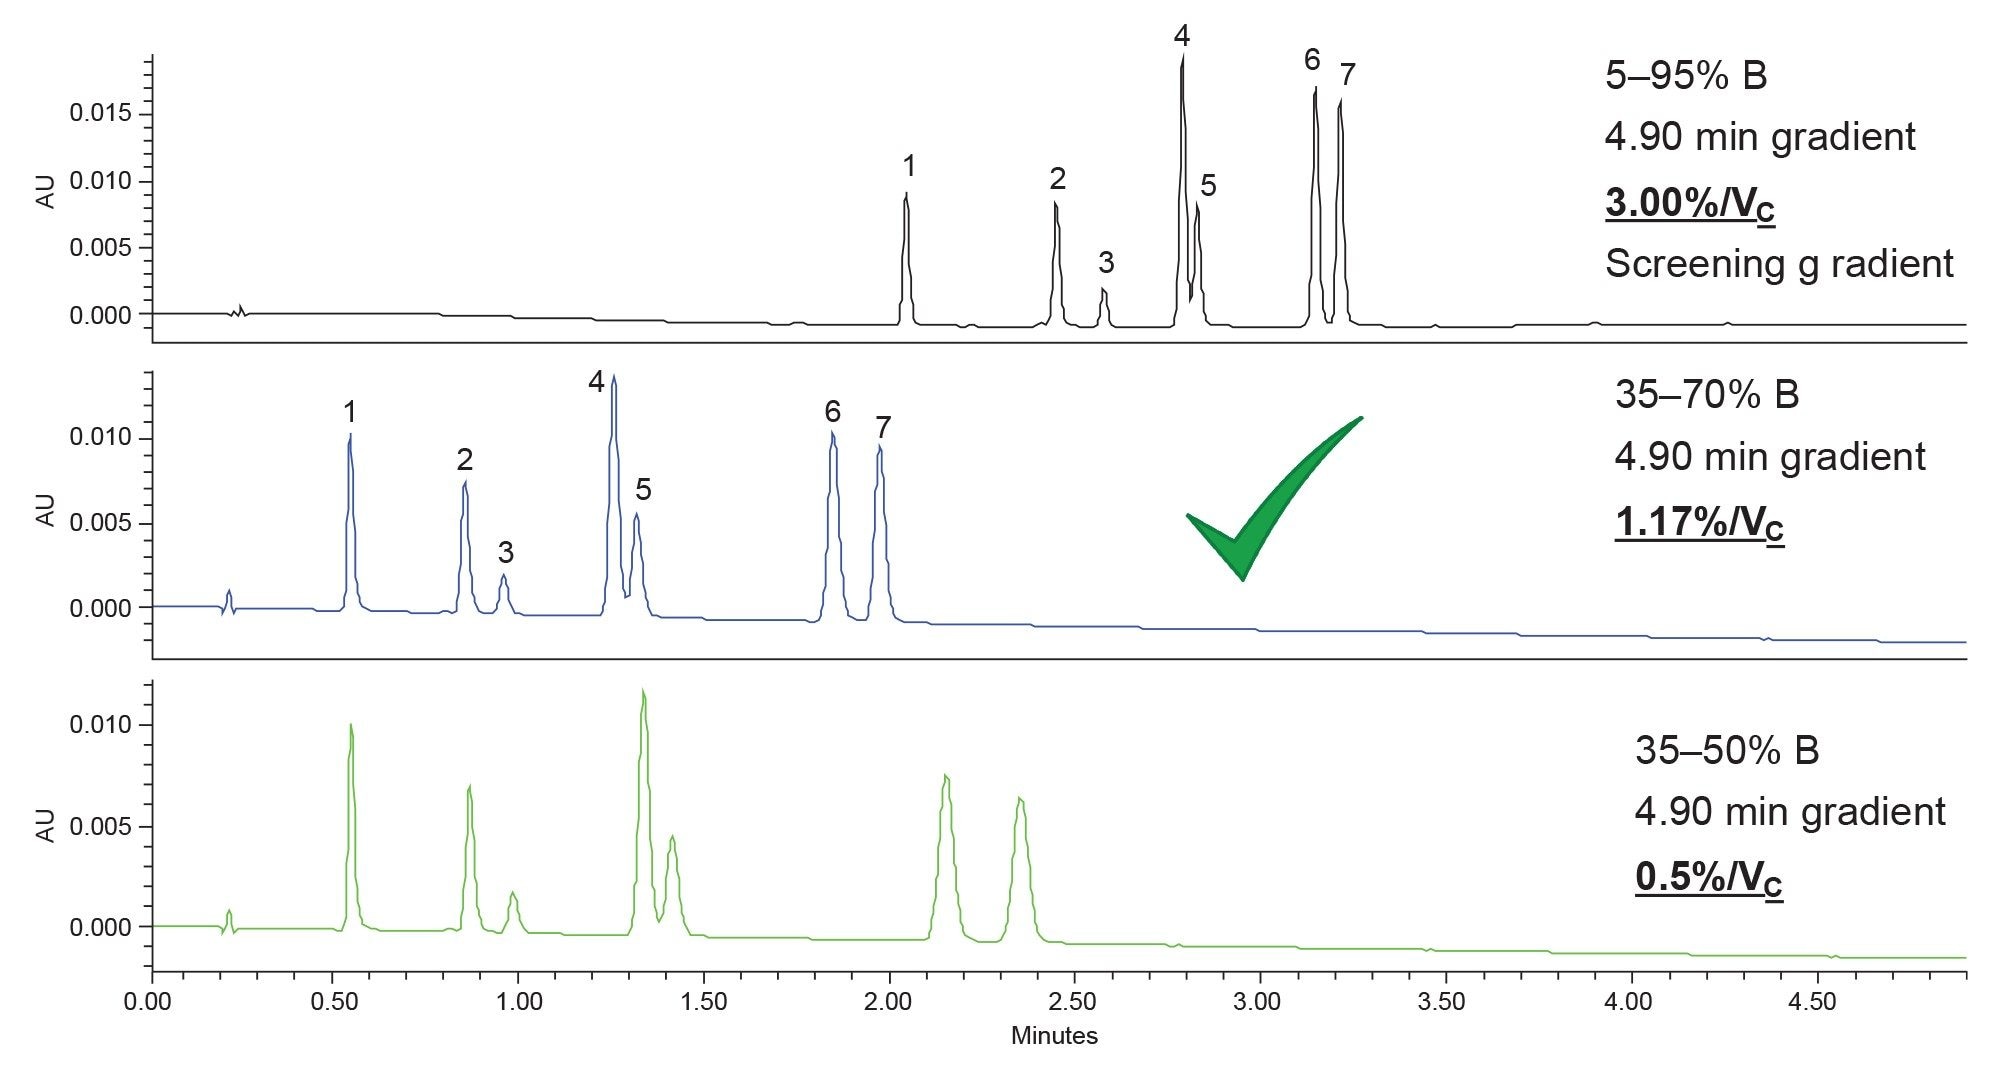 Figure 5. Gradient slope adjustment optimization at 254 nm. Component IDs listed in Figure 1.
The middle chromatogram of Figure 5 shows the first attempt at optimization, reducing gradient slope from 3.0%/Vc to 1.17%/Vc. USP resolution of peak 5 improved from 1.17 to 1.31, a modest improvement. An additional attempt at improving the separation by reducing gradient slope was performed using a method that employed a 0.5%/Vc gradient slope. However, this separation did not provide a significant enough improvement to the separation with a USP resolution comparable to the results of the 1.17%/Vc. The 1.17%/Vc slope was selected for further optimization as it improved the resolution compared to the original and had narrower peaks compared to the 0.5%/Vc results. The next step of optimization was adjusting column temperature. In this case, the temperature was adjusted to 40 °C and the 1.17%/Vc gradient method was used and compared to results obtained at 30 °C, Figure 6.
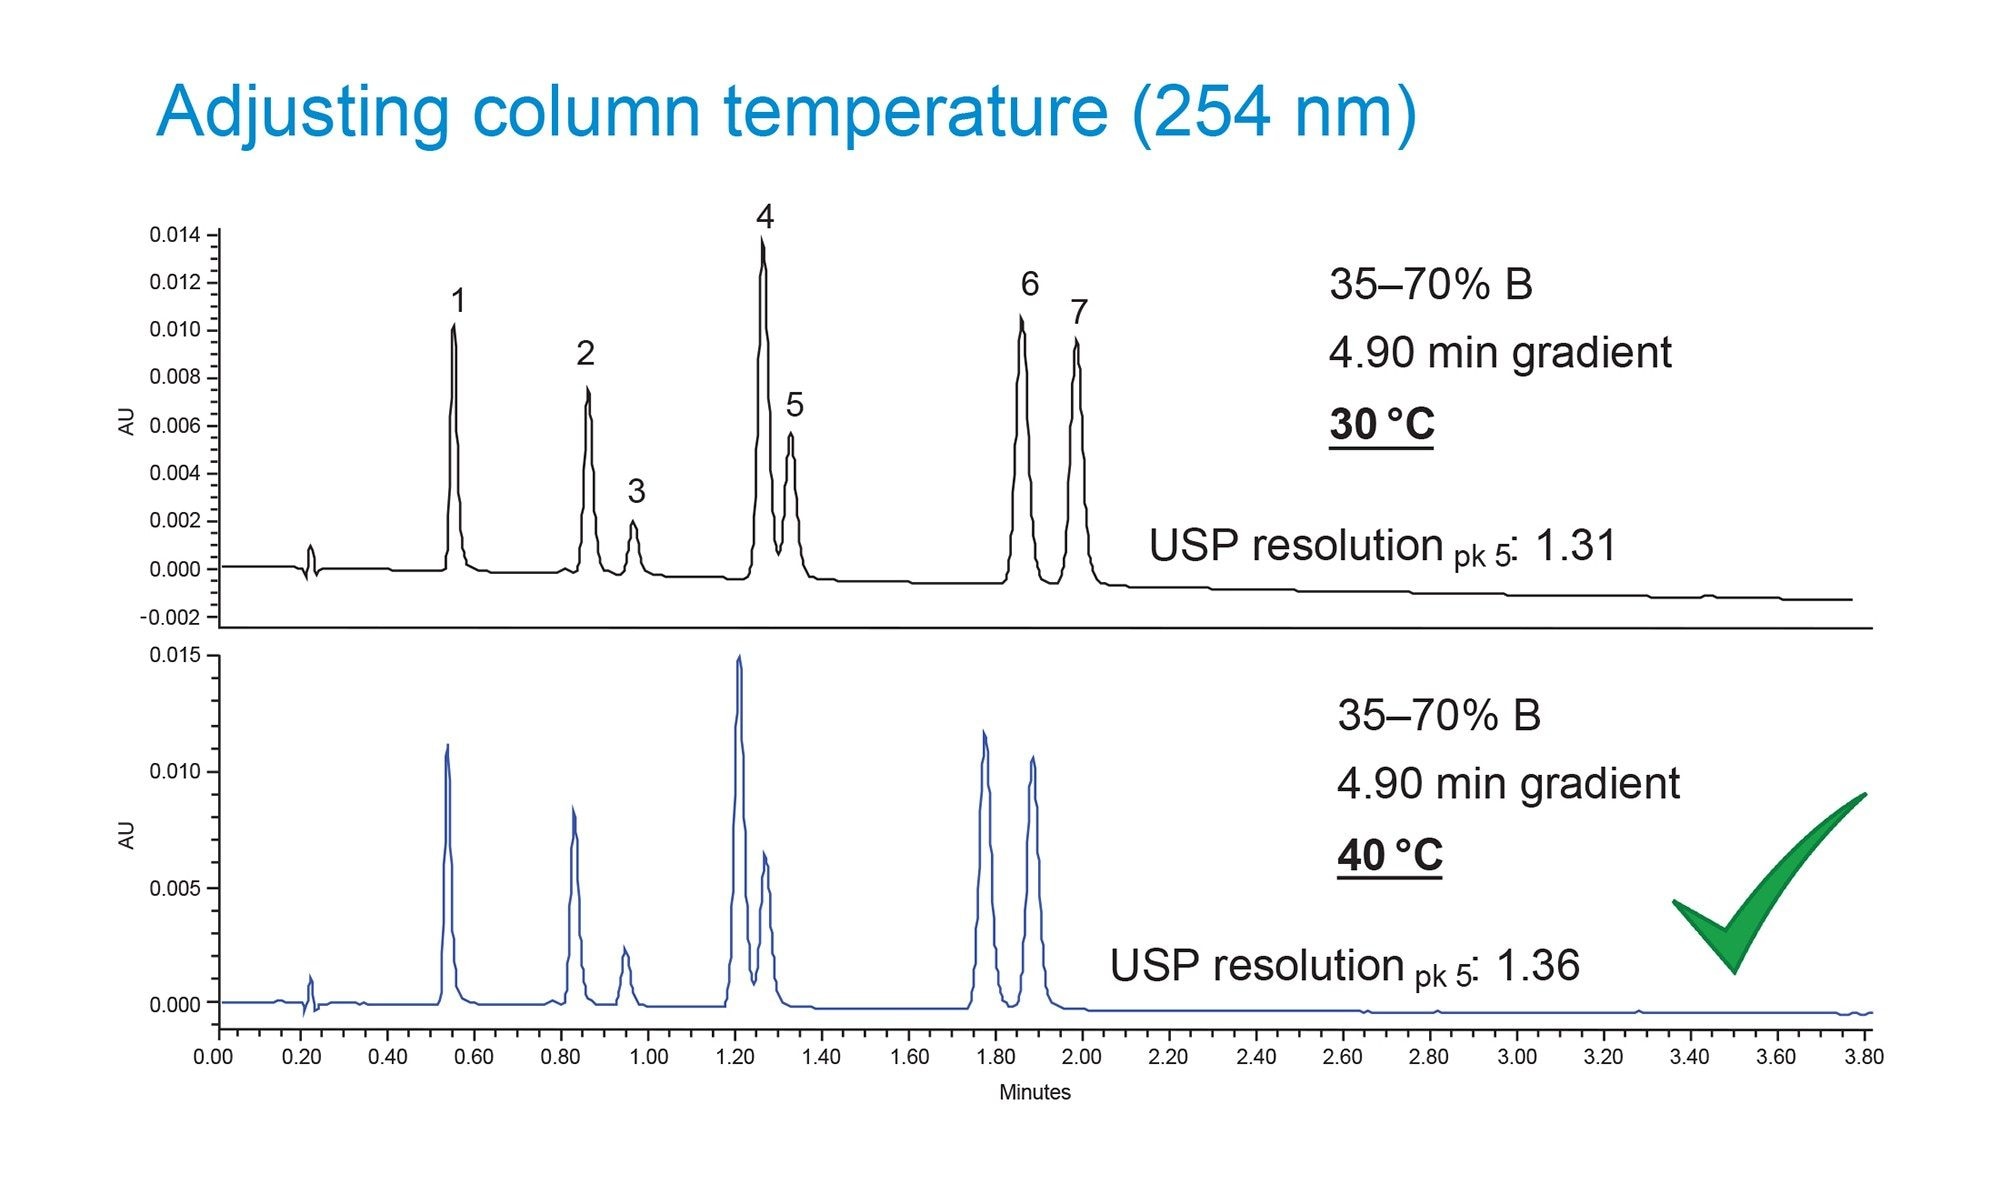 Figure 6. Column temperature optimization at 254 nm. Component IDs listed in Figure 1.
Increasing column temperature improved the separation efficiency slightly, from a USP resolution of 1.31 at 30 °C to 1.36 at 40 °C. Objectively, this improvement will be taken advantage of going forward, but it does not appear that column temperature plays a major role in the separation of these compounds. The last thing to try to improve the separation was to increase column length. By doing this, the efficiency of the column, commonly called the number of theoretical plates or length to particle size ratio (L/dp), is doubled providing better overall separation power. By moving from a 50 mm 2.5 µm particle column (L/dp of 20,000) to a 100 mm 2.5 µm particle column (L/dp of 40,000), the critical pair of ametryn and propazine should be completely resolved. Figure 7 shows the separation of this mixture on the two columns using an appropriately scaled gradient on the 100 mm column.
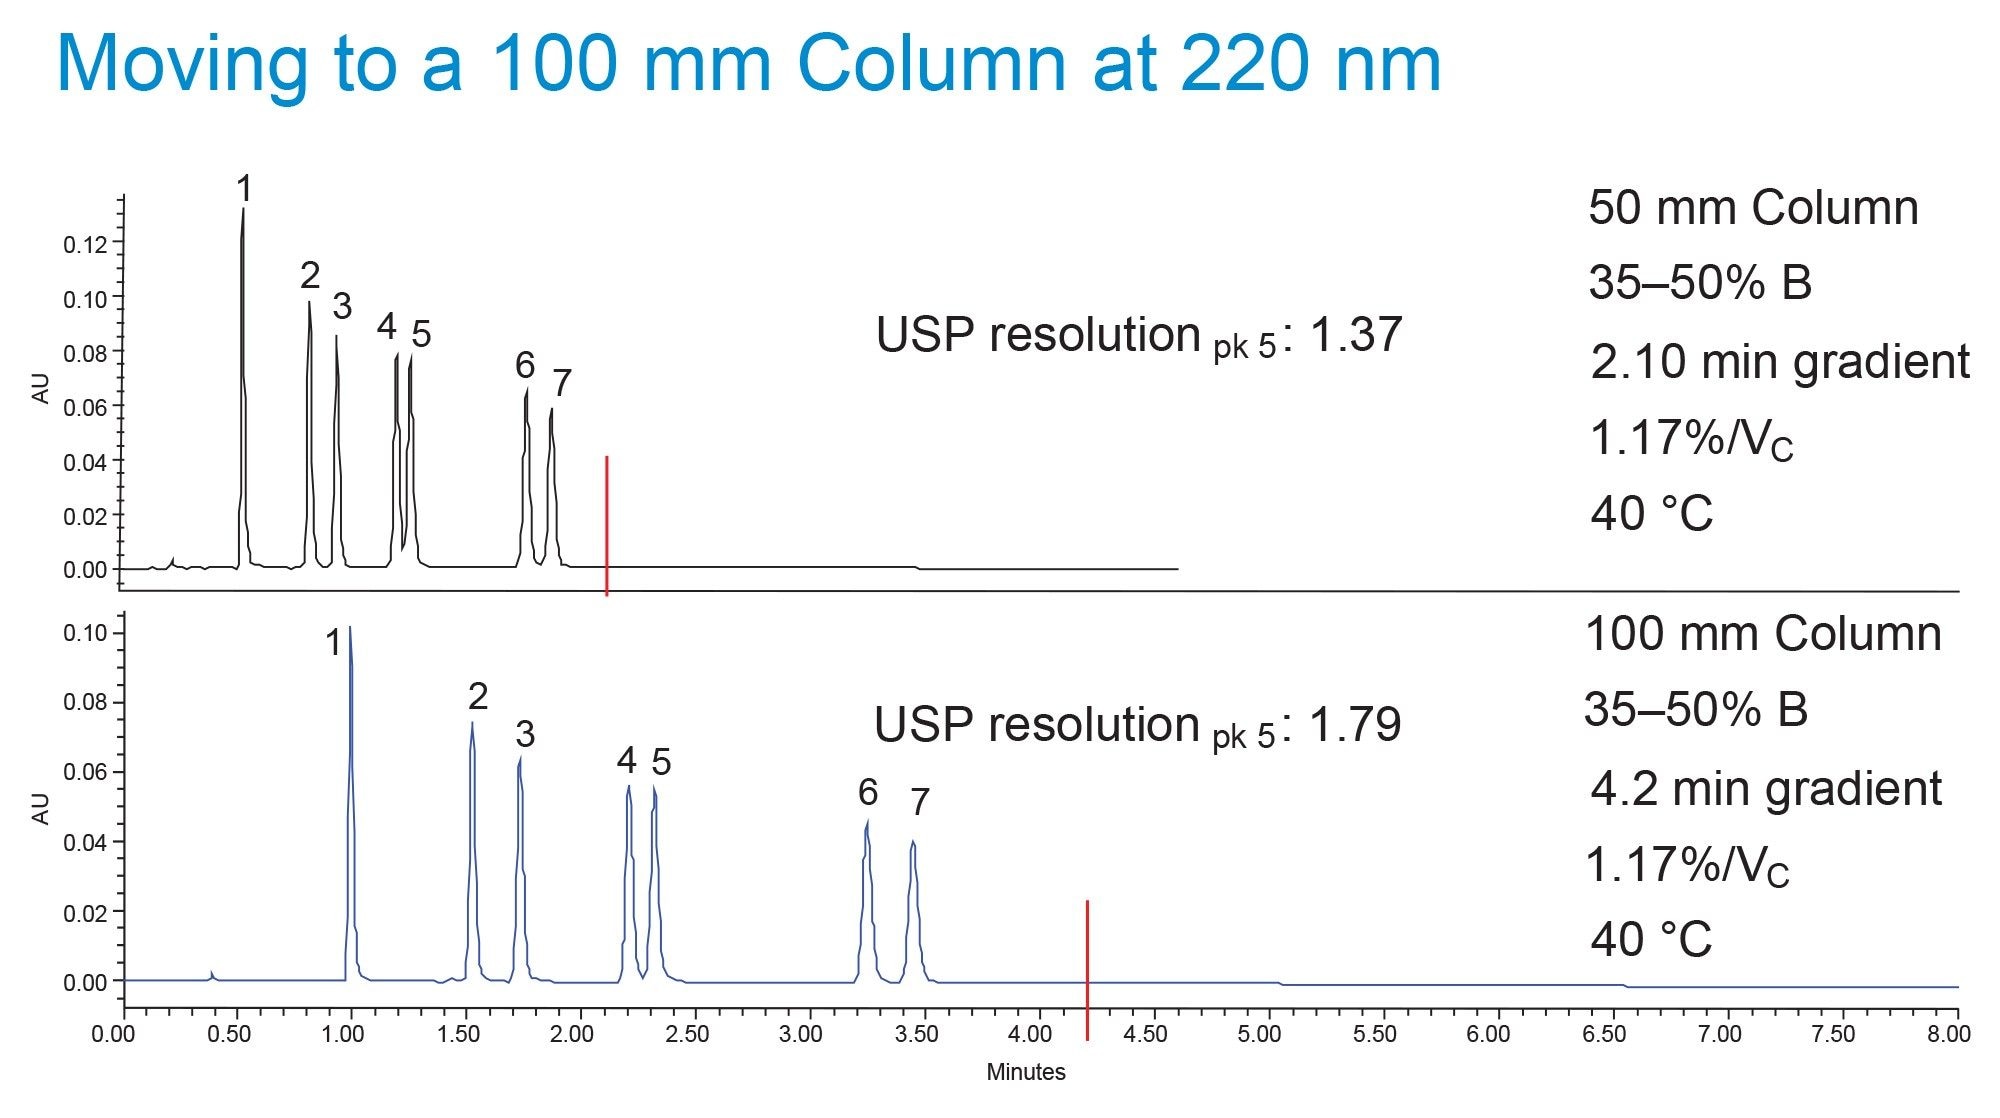 Figure 7. Separation of triazine herbicides on a 50 mm and 100 mm XBridge Premier BEH C18 Column using 2.5 µm particles. Final gradient conditions used 35–50%B in 2.1 minutes (50 mm) or 4.2 minutes (100 mm). Same gradient slope (1.17%/Vc) and column temperature (40 °C) from optimization used. Detection at 220 nm used. Gradient adjusted to reduce cycle time. Red line indicates end of gradient. Component IDs listed in Figure 1.
Prior to column scaling, the method was shortened to 35–50% B to improve cycle time. The optimized gradient slope, 1.17%/Vc, and column temperature, 40 °C, were maintained during shortening of the method. The end point of the gradient was adjusted to 50%B purely as a time saving exercise and because the gradient slope was unchanged; the performance of the method was not impacted. By scaling this shortened method to a 100 mm column, all the components were fully resolved with the lowest USP resolution value being 1.79. This method development activity would now be considered complete and could be used for sample analysis or method validation experiments. By using the systematic screening protocol, this method was created in just 11 hours (two days) of run time, including optimization. Combining the speed of the systematic screening protocol with the robust MaxPeak Premier Columns provides fast and reliable results that an analyst can trust day in and day out.
Conclusion
Triazine herbicides are widely used to control invasive plant species as a part of crop management. The use of these compounds can lead to soil and groundwater contamination, leading to negative effects on aquatic ecosystems. As such, the monitoring of these compounds is critical in areas where they are used. Having a separation where the compounds are baseline resolved is important to effectively monitor these analytes. High-end mass spectrometry may be able to distinguish the compounds by mass but having baseline separation minimizes potential ion suppression or enhancement and provides better results to be generated by the instrument.
A stepwise approach to method development can simplify the process, allowing methods to be developed faster and making the process more accessible to novice users. One example of a stepwise approach is the Systematic Screening Protocol, outlined in this application note. The streamlined process produced a method for seven triazine herbicides in two days, including optimization. In this case, the method was able to be created with use over 11 hours of instrument time, spread out over two days. Combining this with MaxPeak Premier Columns eliminates a lot of doubt in the separation. MaxPeak Premier Columns mitigate possible secondary interactions between the analytes and the metal surfaces of the column. Using these columns as a part of routine method development workflows ensures only the best results are seen, without having to worry about these deleterious secondary interactions.
References
- Graymore M, Stagnitti F, Allinson G. Impacts of Atrazine in Aquatic Ecosystems. Environmental International 483–495 2001.
- Pan X, Xu L, He Z, Wan Y. Occurrence, fate, Seasonal Variability, and Risk Assessment of Twelve Triazine Herbicides and Eight Related Derivatives in Source, Treated, and Tap Water of Wuhan, Central China. Chemophere. 2023.
- Maziarz M, McCarthy S, Wrona M. Improving Effectiveness in Method Development by Using a Systematic Screening Protocol. Waters Application Note. 720005026. 2014.
- Berthelette KD, Nguyen JM, Turner, J. Method Development of Ten Antibiotic Compounds Using a Systematic Screening Protocol on an ACQUITY ARC with UV and QDa Detection. Waters Application Note. 720007352. 2021.
- Berthelette KD, Turner JE, Walter TH, Haynes K. Using a Systematic Screening Protocol and MaxPeak HPS Technology to Develop a UHPLC Method for the Analysis of Deferoxamine and its Forced Degradation Products. Waters Application note. 720007834. 2022.
- Hong P, McConville P. A Complete Solution to Perform a Systematic Screening Protocol for LC Method Development. Wates White Paper. 720005268. 2018.
- Delano M, Walter TH, Lauber M, Gilar M, Jung MC, Nguyen JM, Boissel C, Patel A, Bates-Harrison A, Wyndham K. Using Hybrid Organic-Inorganic Surface Technology to Mitigate Analyte Interactions with Metal Surfaces in UHPLC. Anal. Chem. 93 5773–5781 2021.
- Walter TH, Alden BA, Belanger J, Berthelette KD, Boissel C, Delano M, Kizekai L, Nguyen JM, Shiner S. Modifying the Metal Surfaces in HPLC Systems and Columns to Prevent Analyte Adsorption and Other Deleterious Effects. LCGC Supplement, June 28–34 2022.
- Layton C, Rainville P. Advantages of Using MaxPeak HPS Technology for the Analysis of Non-Steroidal Anti-Inflammatory Drugs. Waters Application note 720007531. 2022.
- Alkhateeb F, Rainville P. Batch-to-Batch Robustness of MaxPeak Premier Columns for the Analysis of Dexamethasone Phosphate and Related Compounds. Waters Application note 720007350. 2021.
720007923, July 2023