Use of the Andrew+™ Pipetting Robot and OneLab™ Software for Bacterial Endotoxin Testing
본 응용 개요서는 구체적인 실험 내용을 포함하지 않습니다.
Abstract
To demonstrate that the Andrew+ and OneLab can be configured to execute the Pyrochrome® kinetic chromogenic assay.
Introduction
Pyrogen testing is a requirement for any injectable drug or medical device to ensure safety1 For example any vaccine or biologic must be tested for the presence of endotoxin in the final formulation. This can be accomplished by performing an endotoxin detection assay such as Pyrochrome.2 This Limulus Amebocyte Lysate (LAL) based assay3,4 is an extremely sensitive enzymatic cascade method for the detection of sub nanogram quantities (10-9 g/mL) of endotoxin. The 96 well microplate based chromogenic LAL assay requires a fairly complex process necessitating numerous pipetting steps. Standard curve preparation, positive product control (PPC) preparation, sample arraying, and reagent dispensing are time consuming and tedious, but are critical steps in successful use of these assays. Automation of the liquid handling steps used in standard curve, PPC, and sample preparation along with assay placement on the plate would significantly increase the efficiency for these assays. The automated process would liberate the analysts from repetitive time-consuming operations, lead to increased productivity, better quality in analytical work, and consistency in execution. In addition the added benefit of the OneLab event log would ensure a fully auditable process simplifying any future analyses and investigations.
LAL endotoxin assay execution note: As mentioned above these assays detect minute quantities of endotoxin in down to the 0.005 EU/mL (EU: endotoxin units) range (i.e. sub nanogram (10-9 g/mL). As indicated in the IFU all materials used for assay execution must be tested for potential interferences. Excellent lab technique and a clean environment are required to execute these assays. To address these requirements these results were collected with the Andrew+ in a static enclosure.
Here we present example results from the execution of the basic Pyrochrome protocol with Andrew+ and OneLab utilizing the standard pipettes and dominos. Dominos are modular holders for tubes, plates, tips, reagents, and other materials that can be configured in various combinations on the deck. Figure 1 shows the physical set up of the robot and the deck with the associated dominos.
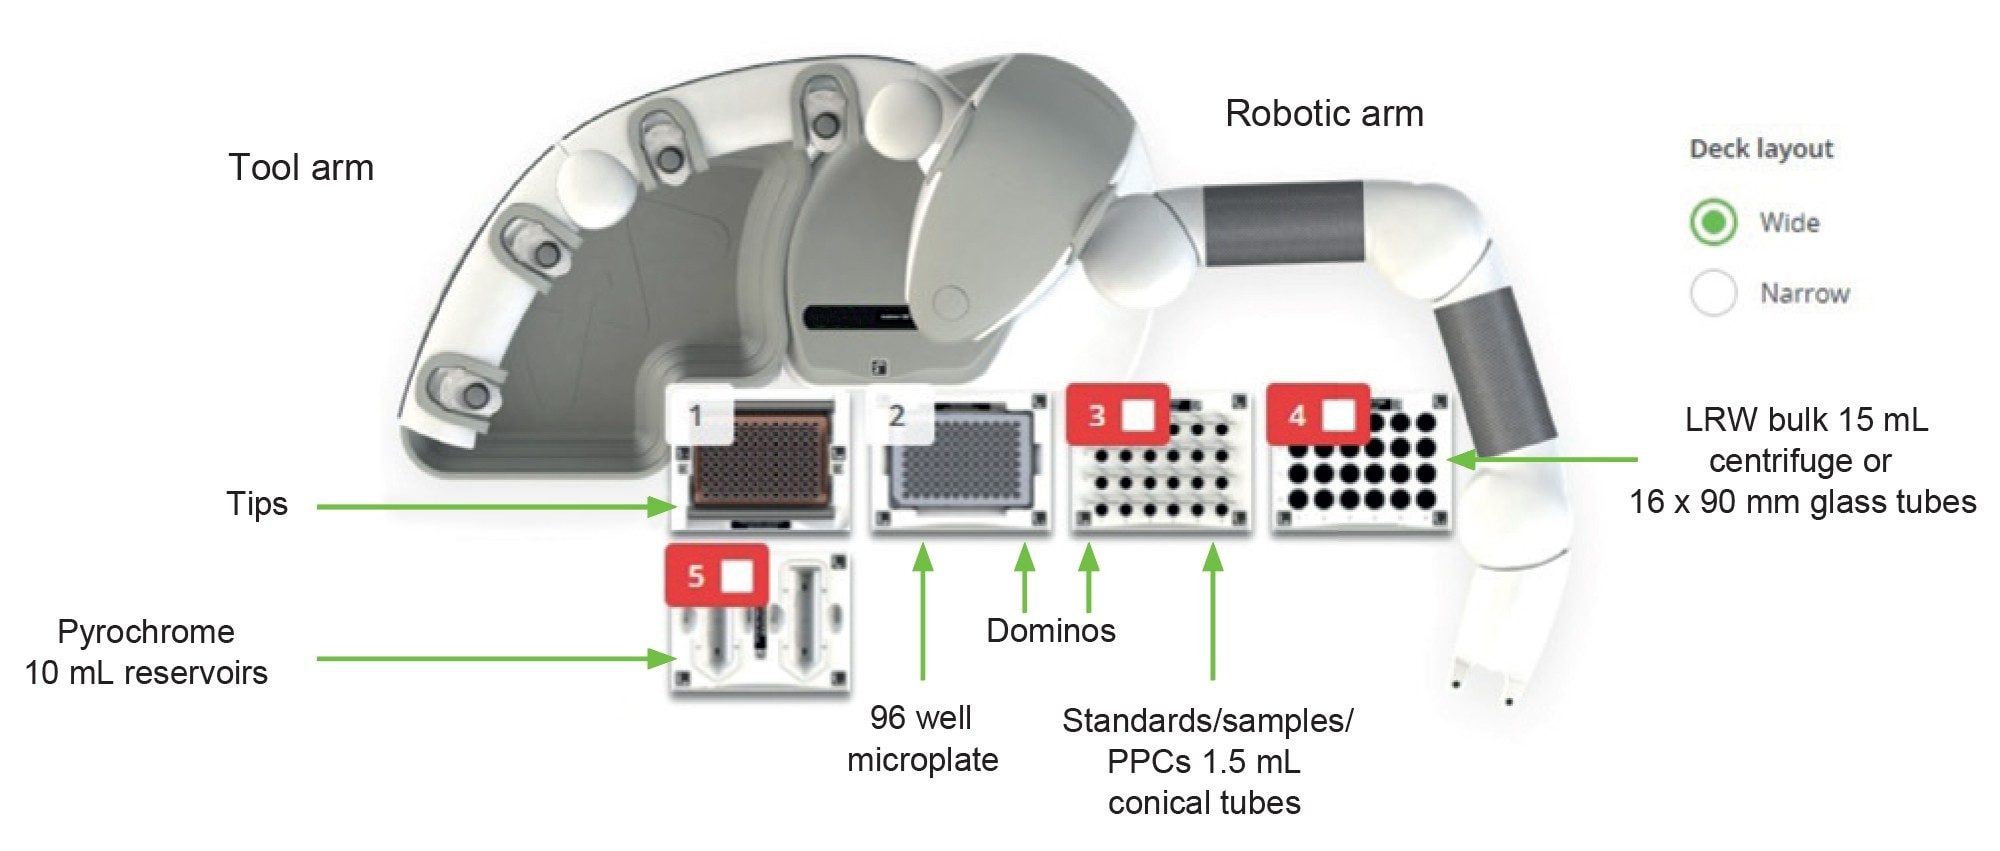
Configuration used to execute the experiments for the Pyrochrome results described in this technical note. The electronic Bluetooth connected pipettes used were the 300 µL multichannel and 300 µL single channel pipette. LRW is LAL reagent water.
Results and Discussion
This initial evaluation of the Andrew+ system addressed the creation of an OneLab protocol to execute a basic Pyrochrome protocol using currently available dominos. The protocol was designed to evaluate the capability of the Andrew+ and OneLab to consistently create a standard curve and execute sample and PPC preparation and was conducted from multiple runs over four days. A key element of the Pyrochrome assay is the construction of the standard curve. For each plate a new standard curve was produced. These dilutions were created as serial dilutions 30 µL:270 µL starting with a 500 EU/mL stock to create a five point standard curve with concentrations of 50, 5, 0.5, 0.05, and 0.005 EU/mL. The standards were loaded onto each plate in triplicate. The standard curve onset time data (time for each sample to cross the 0.03 OD threshold) for each plate were analyzed by creating a log-log plot and performing a linear regression on the transformed data producing a slope, intercept, and R-value for each of the fourteen runs. These results are summarized in Figure 2. The variance for slopes and intercepts across the fourteen runs was 4.1% and 1.2%, respectively. The R-values were all excellent with the lowest one being 0.995 (the requirement is R ≥0.980). These results are all within criteria for execution of a Pyrochrome assay as indicted in the IFU.
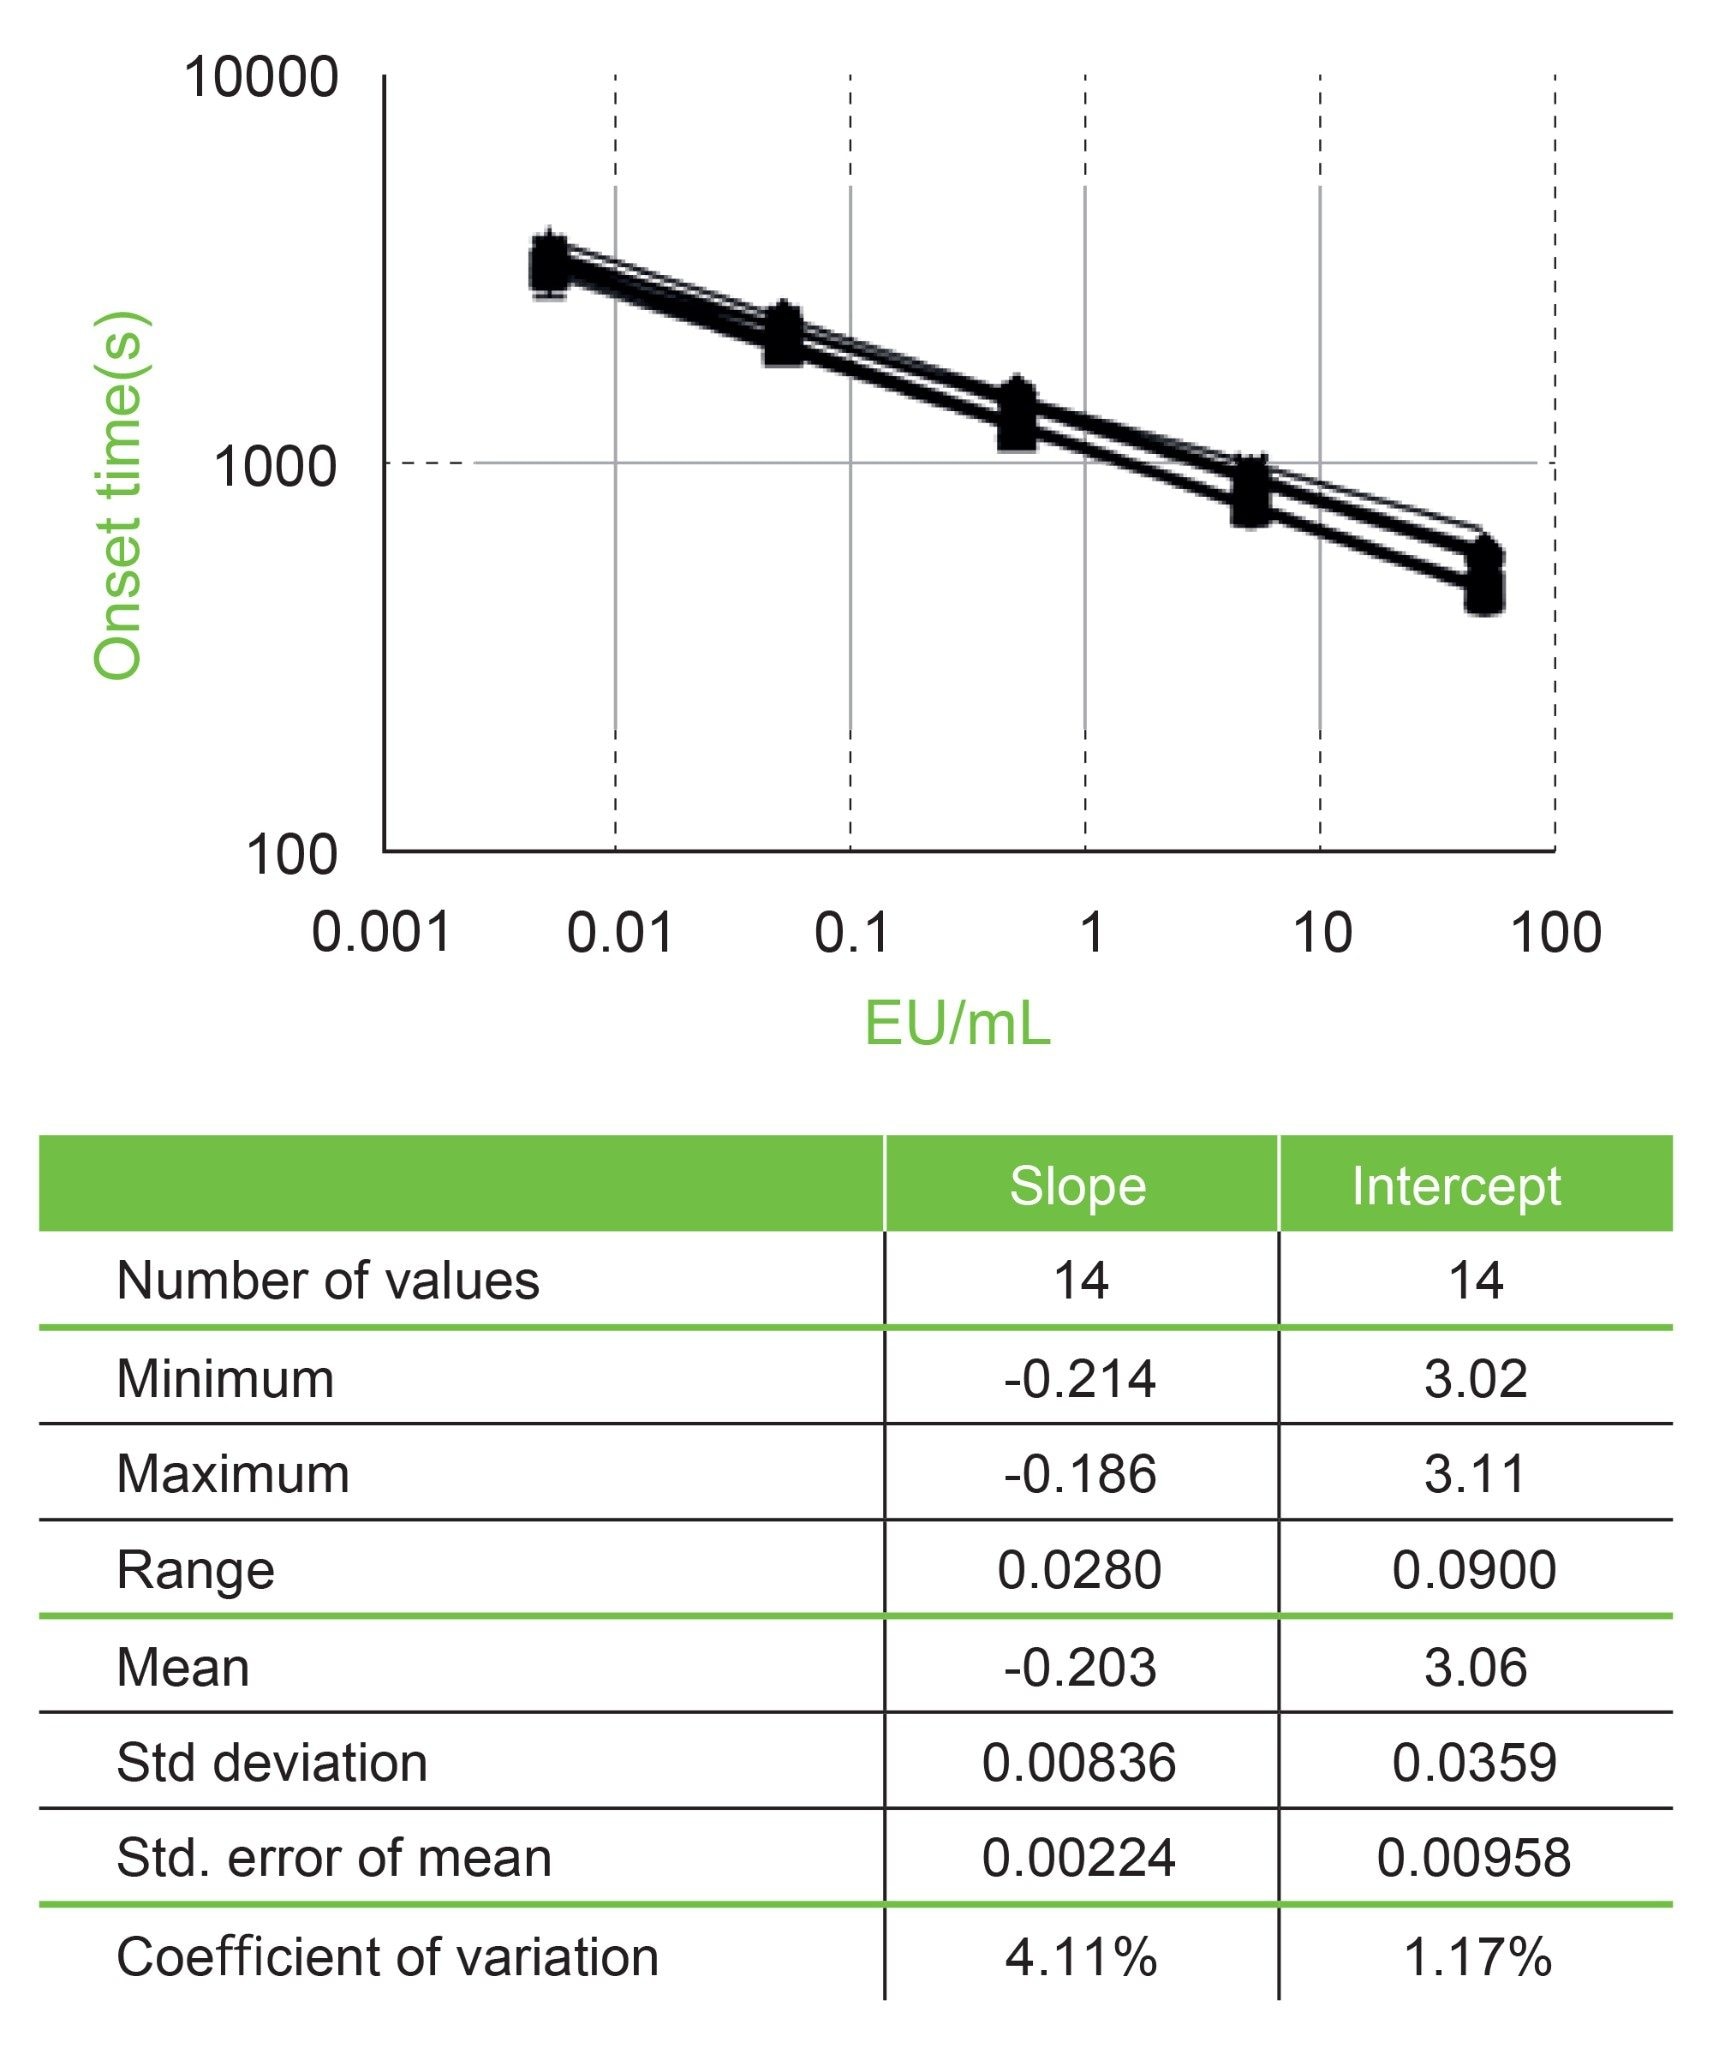
This set of data (fourteen runs) is from four days using the same lots of reagents and reference standard endotoxin. The standard curve for each plate was constructed and dispensed from a unique set of dilutions. These linear fits are log-log plots from each plate. The standards for these curves are 50, 5, 0.5, 0.05, and 0.005 EU/mL. The associated plot has all onset time data for each of the fourteen lines plotted (there are a total of 42 points per x-axis value). The associated table presents the average of the resultant fourteen slopes and intercepts.
In addition to the standard curve evaluation, a sample and two PPCs were included in these experiments. The sample was made manually in water to be ~0.5 EU/mL and loaded onto the deck. The sample and the 5 EU/mL standard were combined (10x dilution as with standard curve construction, 30 µL:270 µL) creating the two PPCs with Andrew+. The PPCs were expected to be about 1.0 EU/mL. The sample and the PPCs were each loaded into ten wells on each plate. The data from across fourteen plates were examined and is summarized in Figure 3. In this case the average calculated values from each plate for each sample and PPC are presented. The calculated variances are larger for the samples (24.6%) and PPCs (16.3%) partly due to the back calculation from the log-log plots. In addition, it should be noted that the samples were made manually for each day. The actual calculated mean for the samples across all plates was 0.57 EU/mL. This was within 14% of expectations across all 14 plates. The PPC of 1.04 EU/mL was within 4% of expectations across 14 plates. The average percent recovery for the PPC across all plates was 93.5%, well within the specified requirements of 50 to 200%.
Note all data collected in the experiments presented here used the same lots of reagent and materials. Endotoxin samples were all derived from the same lot of reference standard endotoxin.
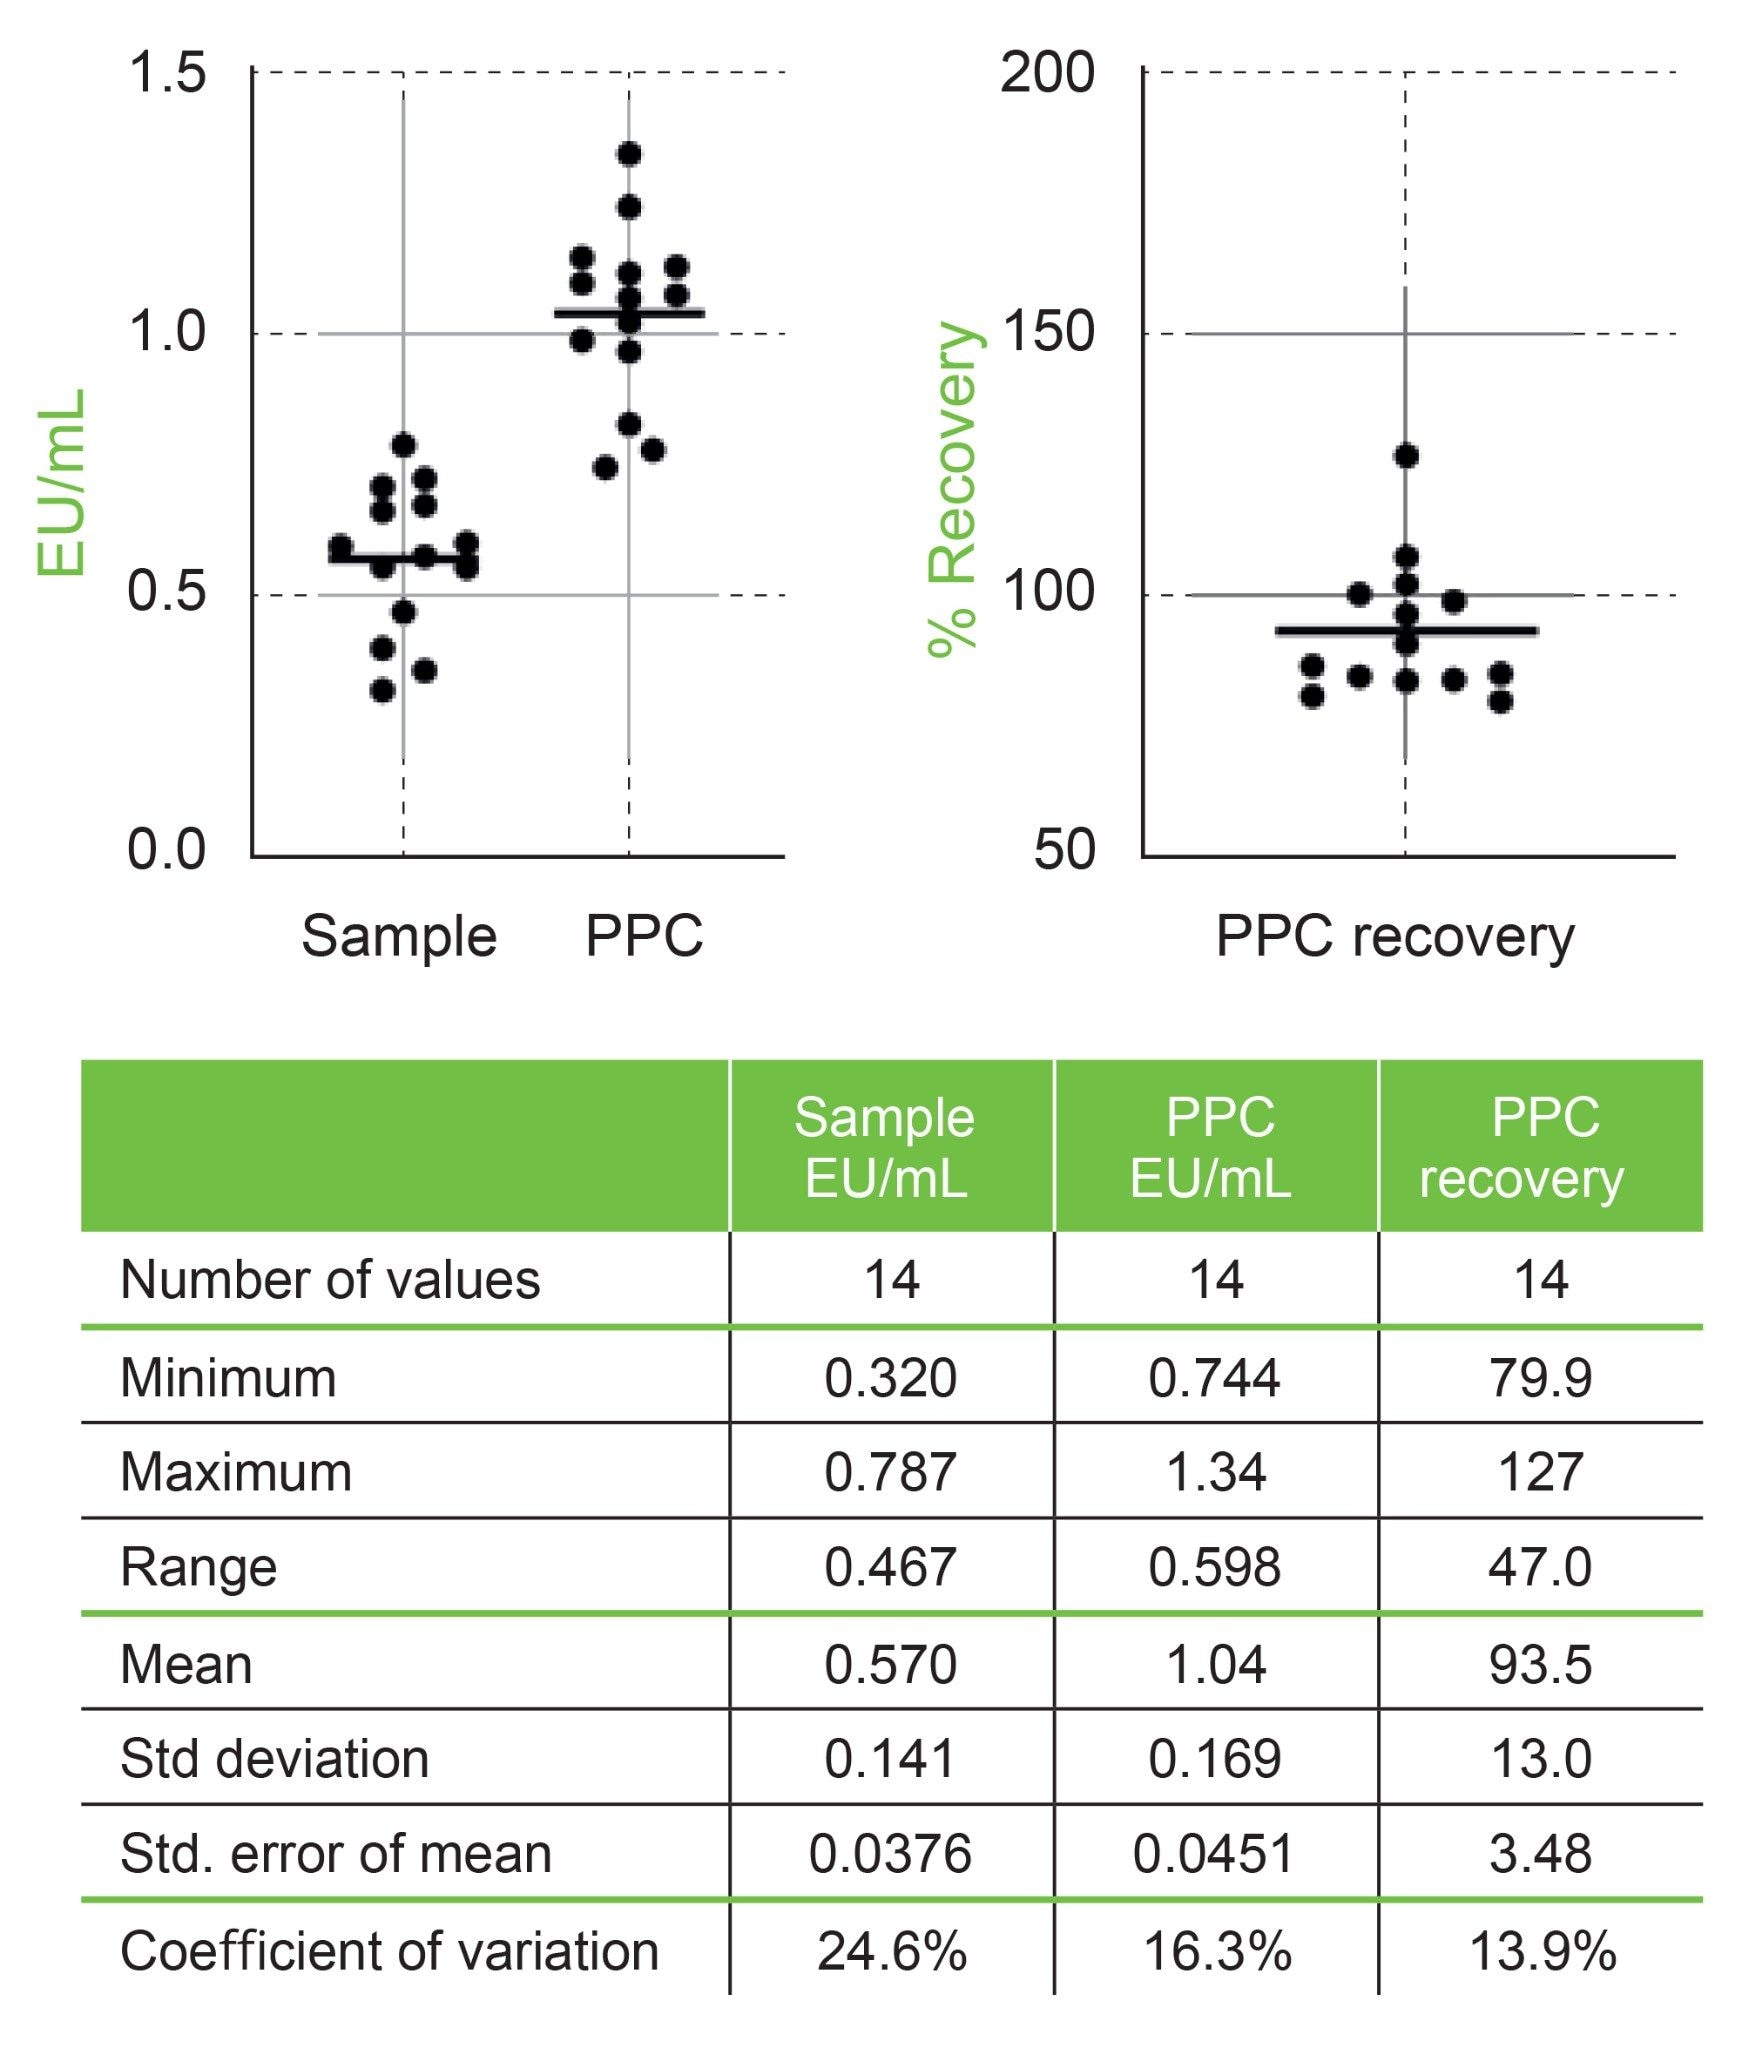
This set of sample and PPC data is from fourteen runs over four days using the same lot of reagents and reference standard endotoxin. Each sample or PPC run from a plate was derived from ten results; each plate was constructed and dispensed from a unique set of two PPC dilutions from a single sample and standard dilution. These results are the back calculated values derived from the individual linear fits described above in Figure 2. The line in the scatter plots is the mean of each set.
Conclusion
As presented above the results for the slopes and intercepts derived from fourteen plates have low variance and the R-values for the linear fits at 0.995 or better in each case. These results are consistent with the range of variances observed based on the historical data for the manual execution of this assay.
The sample variance was ~24.6% across the fourteen plates and the overall average result was within 14% of expectations. All PPCs were within the specified ranges of 50 to 200% consistent with the assay requirements and the average value across all plates was within 4% of expectations. Over all these results demonstrate than Andrew+ can execute the Pyrochrome assay within the expected requirements outlined in the instructions for use.
There have been a number of publications describing custom automation processes for the execution of similar LAL based endotoxin testing methods.5,6 While all have to overcome the same issues regarding consistency and sensitivity to contamination, none have the simplicity and accessibility demonstrated using Andrew+.
References
- Bacterial Endotoxins Test, United States Pharmacopoeia <85>.
- Pyrochrome Instructions for use https://www.acciusa.com/tools-and-resources/package-insert-sheets/.
- Lindsay, G. K., P. F. Roslansky, and T. Novitsky. 1989. Single-Step, Chromogenic Limulus Amebocyte Lysate Assay for Endotoxin J. Clinic. Microbiol. 27:947–951.
- Prior, R.B., 1990. The Limulus amoebocyte lysate test. In Clinical Applications of the Limulus Amoebocyte Lysate Test (p. 27). CRC Press Boca Raton, FL.
- Tsuji KI, Martin PA, Bussey DM. 1984 Automation of chromogenic substrate Limulus amebocyte lysate assay method for endotoxin by robotic system. Applied and environmental microbiology. Sep 1;48(3):550-5.
- Jorgensen, J.H. and Alexander, G.A., 1981. Automation of the Limulus amoebocyte lysate test by using the Abbott MS-2 microbiology system. Applied and environmental microbiology, 41(6):1316–1320.
Featured Products
720007998, August 2023