This application note describes how the addition of a light scattering detector to a GPC/Viscometer System offers the analyst many advantages over a single detector GPC System.
The addition of a light scattering detector to a GPC/Viscometer System offers the analyst many advantages over a single detector GPC System. Since the light scattering detector response is directly proportional to molecular weight, it is the most sensitive commercially available GPC Detector for looking at subtle differences in high molecular weight tails in polymer molecular weight distributions. For many applications, these low concentration high MW tails can drive the rheology and polymer performance. Subtle differences in branching can also exist which are hard to detect by conventional GPC, or GPC/Viscometry. The addition of a light scattering detector to a GPC/Viscometer System allows the generation of true Mark-Houwink plots, which can be useful in determining polymer branching architecture.
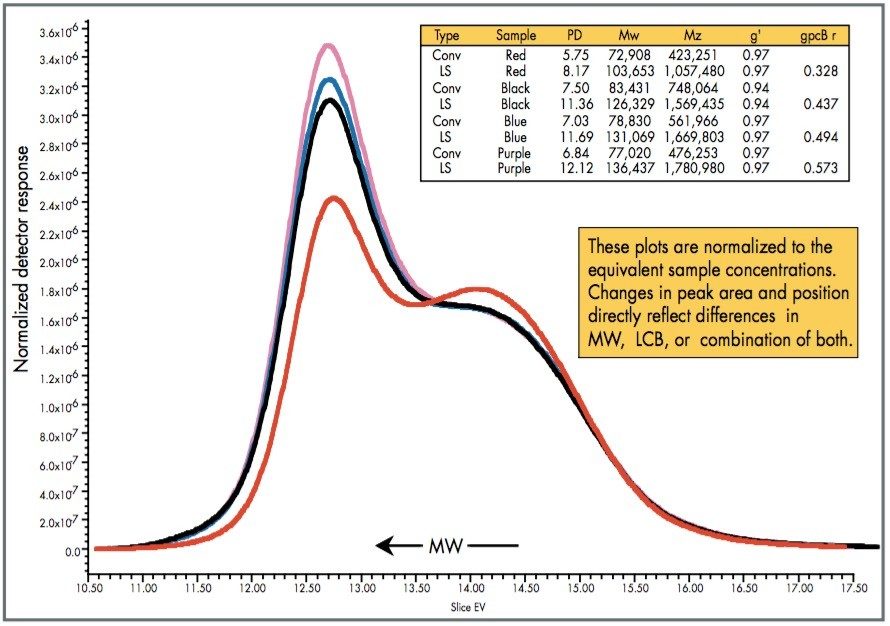
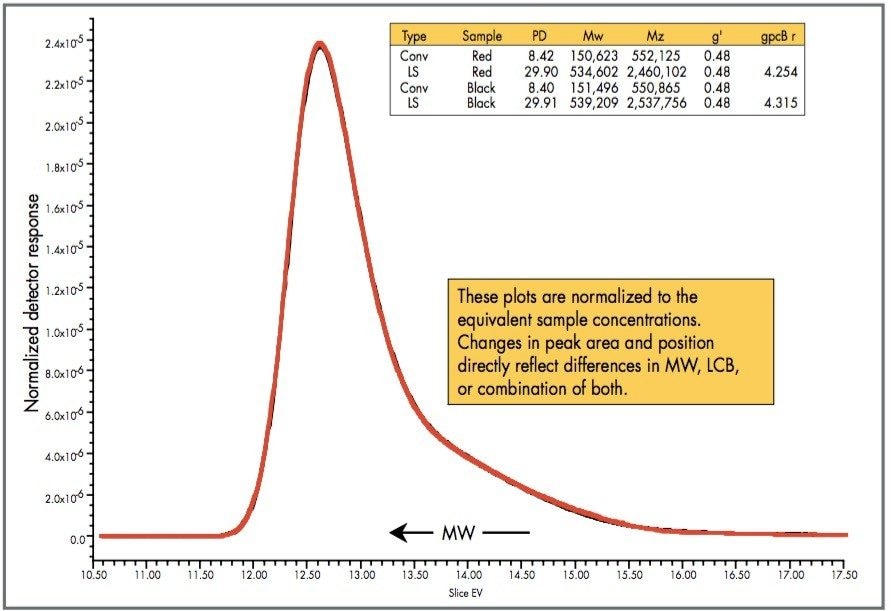
The combination of three detectors, referred to as 3D-GPC, provides a tremendous selection of data and molecular plots. However, one of the problems that faces the GPC analyst is how to present the data to non-GPC experts in a way that is easily understandable. Yau1 introduced a useful light scattering plot, which was called a normalized light scattering plot. This plot is based on the relationship between the concentration detector (RI) and the light scattering (LS) signal.
RI ∝ C
LS ∝ C x Mw
Here RI is the refractometer detector response, C is concentration, Mw is the weight average molecular weight, and LS is the light scattering detector response at any given angle. We usually use the 15° angle for our LS plots. By dividing the LS signal by the RI signal, a plot is generated with an area that directly reflects the weight average molecular weight. These can be especially important for LDPE samples where the backbone molecular weight distributions are similar, but branching levels differ.
Figures 1–3 show the benefits from using this type of plot. Figure 1 shows an overlay of the molecular weight distributions of four polyethylene product precursors that were synthesized with slightly different recipes. Three of the distributions are perfectly super-imposable and the fourth is slightly different but the difference does not appear to be significant. Figure 2 shows the normalized light scattering plot for these same four samples. The small differences in the high Mw tail are now greatly magnified. Figure 2 also illustrates that even a 3–4% difference in overall Mw can be easily visualized by this plot.
Figure 3 shows an example of the comparison of an in-house resin with a competitive sample obtained from a customer. This plot vividly illustrates that these two resins are equivalent in molecular weight and branching levels.
This example illustrates one of the great advantages of Waters Empower Software, that of using an often overlooked feature: Custom Fields. The Custom Fields feature provides the user with the ability to develop custom calculations that are specific to an application. (See below for steps to create the Custom Field used in this application.) They are most often used to create custom text fields that contain information such as lot numbers, batch numbers or LIMS numbers. However, one of the most powerful features of this customization tool is the ability to create new distribution variables. A distribution variable is a custom calculation that is applied to every data point across the entire chromatogram. This newly defined distribution can then be displayed in any of the standard plots that are available within Empower Software.
A simple overlay of two LS signals may be misleading since the concentrations of the two curves may not be exactly the same. Normalization of the LS detector signals is accomplished by dividing each data point by the total area under the concentration detector signal. This allows the LS signals for two samples to be reflective of MW only, not MW times concentration.
To create a Custom Field follow the method presented below.
Now that the Custom Field and calculation have been created, it can be applied to any of the other distribution fields available in Empower Software. It can be displayed as part of the graphs available in the results window when in Review (where calculations are performed) or it can be used in any of the molecular weight plots that are a part of Reports.
720001025, November 2004