• Application Note

UPLC oa-Tof MS for Rapid Screening of Multiple Pesticide Residues

UPLC oa-Tof MS for Rapid Screening of Multiple Pesticide Residues

  • Daniel McMillan
  • María Ibañez Martinez
  • Waters Corporation
  • Research Institute for Pesticides and Water (IUPA), University Jaume I

Abstract

This application note demonstrates the applicability of Time of Flight (Tof) MS analysis for pesticide screening and the potential advantages of such a technique in a controlled laboratory environment.

Introduction

Pesticides Analysis Background

New pesticides are continually being developed and introduced for use in agricultural production. Recent advances in analytical techniques, as well as changes in the types of pesticide compounds and the way in which they are used, have lead to a requirement for a rapid and sensitive, yet generic, pesticide residue screening method.

Traditionally, GC and LC coupled to either single quadrupole MS, or other detectors, have been the most commonly employed analytical techniques. However, due to their relatively low sensitivity and selectivity, they have required large injection volumes or more rigorous sample preparation to reach the required limits of detection. More recently, tandem quadrupole MS/MS analyzers have been used to attain low detection levels and increased selectivity. The superior selectivity is provided by multiple reaction monitoring (MRM) experiments where complex matrices may be analyzed without extensive clean-up. These advantages have made MS/MS the method of choice for low level quantitation and confirmation for a large number of targeted compounds.

Setting up MRM methods for the selected analytes is time consuming and the analysis is inherently targeted towards a limited number of compounds. This has led analysts to consider what other potentially harmful, non-targeted analytes may be in the samples and has resulted in the demand for an analytical method that is sensitive and selective, but not specific.

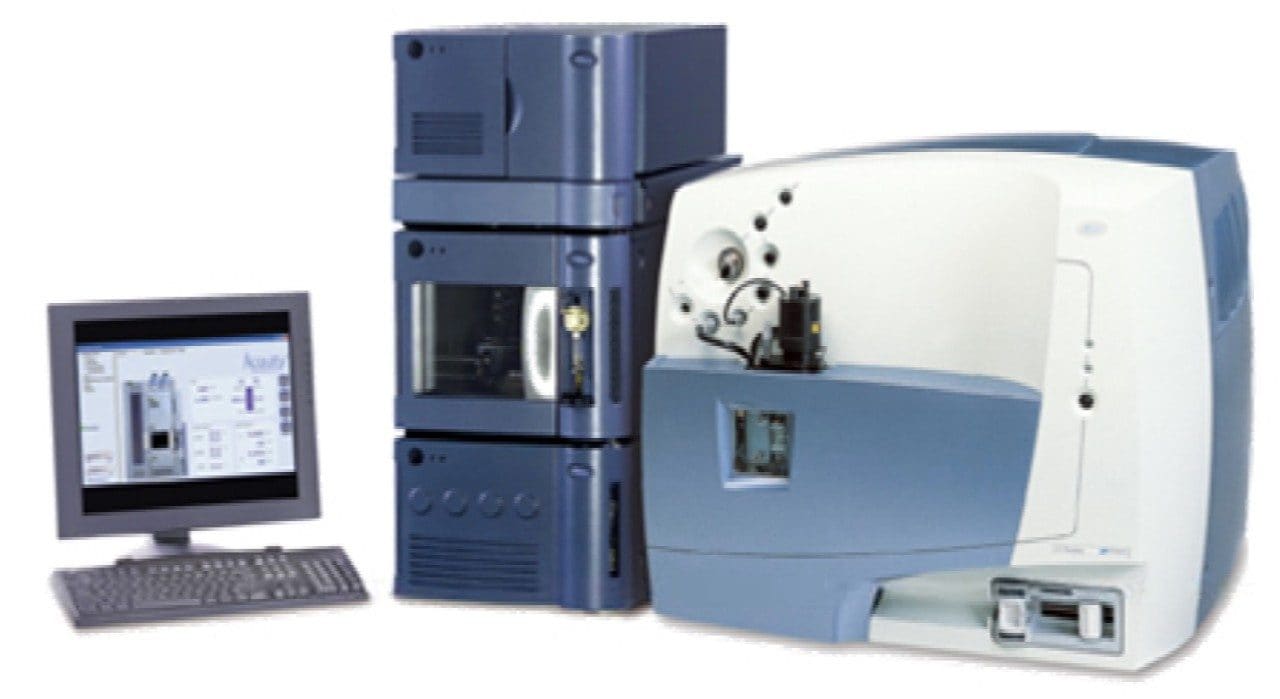
The Waters Micromass LCT Premier, a time of flight (Tof) mass spectrometer, provides a solution for this dilemma. The LCT Premier Mass Spectrometer couples very high, full-spectral sensitivity with high resolution mass spectra allowing any ionizable component in a sample to be exact mass-measured and its elemental composition calculated or confirmed to <3 ppm.

The Waters ACQUITY UPLC is a novel UltraPerformance Liquid Chromatography System utilizing 1.7 μm stationary phase particles in a high pressure system. This provides a fast, high resolution separation which increases LC-MS sensitivity and mitigates matrix interference arising from minimal sample preparation.

Waters ACQUITY UPLC with Waters Micromass LCT Premier Mass Spectrometer.

Outline of Work

The focus of the experiments presented here is to demonstrate the applicability of Time of Flight (Tof) MS analysis for pesticide screening and the potential advantages of such a technique in a controlled laboratory environment.

Drinking water has recently become the subject of much discussion due to homeland security concerns, where the analysis of unexpected contaminants is a particularly high priority. Although water is a relatively simple medium, the techniques used in such an analysis are applicable to a wide range of different matrices. In order to illustrate this, quantitative results from tomato extracts are also presented. Data generated by the UPLC-MS system is processed with Waters ChromaLynx Application Manager software which de-convolutes the chromatograms and displays the mass-measured spectra from each peak. The spectra can be compared against a library of target analytes or used to help determine the identity of an unknown compound.

Experimental

Methods

Extraction Proceduredeveloped by Jeannette Klein and Lutz Alder at FIRA, Berlin.

- 10 g sample weighed. 5 g for dry sample materials.

- Water is added to obtain 10 mL as a sum of natural and added water.

- After addition of 20 mL methanol the sample is blended for 2 min.

- 6 mL of extract is mixed with 2 mL of NaCl solution.

- 5 mL is transferred to a ChemElut Column.

- The column is eluted with 16 ml of dichloromethane and evaporated.

- The dry residue is dissolved in 250 μL methanol and 1000 μL water.

- Extract is filtered through 0.45 μm syringe filter.

- Matrix equivalent of 1 g/mL for normal produce or 0.5 g/mL for dry produce.

LC Conditions

LC system:

Waters ACQUITY UPLC

Mobile phase A:

5% aqueous MeOH + 2 mM CH3CO2NH4

Mobile phase B:

95% aqueous MeOH + 2 mM CH3CO2NH4

Column:

ACQUITY UPLC BEH C18, 1.7 μm, 2.1 x 100 mm

Flow rate:

0.45 mL/min

Injection vol.:

20 μL

Column temp:

40 °C

Gradient:

t = 0 min 0% B

t = 8.5 min 100% B

t = 11 min 100% B

t = 11.1 min 0% B

t = 13.5 min 0% B

MS Conditions

Instrument:

Waters Micromass LCT Premier

Ion mode:

Electrospray +/-

Capillary voltage:

1000 V

Source temp:

120 °C

Desolvation temp:

400 °C

Gas flow:

600 L/hr

Mass range:

50–1000 Da

Acq. time:

0.25 s/function

Calibration:

NaCH2O2 in pos. and neg. modes

LockSpray:

Leucine Enkephalin

Reference:

[M+H]+ = 556.2771 Da

[M-H]- = 554.2615 Da

Results and Discussion

Figure 1 shows the base peak intensity chromatograms from the analysis of drinking water spiked with 92 pesticide residues at a concentration of 100 ppb. Six of the components ionize exclusively in negative mode, and both traces are shown to illustrate the simultaneous acquisition of all spiked pesticides in positive and negative mode. The chromatographic peaks here are typically ~5 s wide at base.

Figure 1. Positive and negative ion BPI chromatograms of drinking water spiked at 100 ppb.

Figure 2 shows a typical combined spectrum of Diuron, together with its elemental composition calculation. It is clear that there are a number of possibilities within 5 ppm of the measured mass, so the observed isotope pattern is compared to a theoretical model using i-FIT Software. In this case, although not the closest match by exact mass (ΔM =1.3 ppm) the correct formula is displayed as the highest rank, since its isotope pattern is the closest match.

Figure 2. Spectrum and EleComp report for Diuron, ranked by closest isotope ratio fit.

When targeting a specific compound, it is a simple operation to plot an extracted ion chromatogram (XIC) of its exact mass. Because of the high mass accuracy of the Tof data, the selectivity of this technique is greatly enhanced and good signal-to-noise ratios are obtained, as illustrated in Figure 3. However, if multiple residues are to be investigated, it becomes time consuming to target them all individually. In this case, it is useful to process data using the powerful chromatographic deconvolution software provided by the ChromaLynx Application Manager. ChromaLynx automatically plots the XICs of up to the eight most intense ions at any point in the chromatogram, and if a peak is found to satisfy user-defined parameters, displays its deconvoluted exact mass spectrum. This can then be analyzed to elucidate an elemental composition, or compared against a library of spectra obtained from standards. Each library entry will include mass, formula, retention time and polarity/cone voltage information, all of which can be used to filter the ‘hit list’ and effectively minimize the occurrence of false positive results. In Figure 4, the ChromaLynx browser indicates the presence of various pesticides in the spiked drinking water sample. Peaks found to match with a high degree of confidence to the library entry are highlighted green, tentative matches in yellow and low ‘fits’ in red.

Figure 3. Comparison of different mass extraction windows.
Figure 4. ChromaLynx browser window showing screening results.

Traditional Tof MS instruments suffer from detector saturation at relatively low concentration levels, thus limiting the quantitative capability of an analysis. The LCT Premier utilizes novel ion optics to provide the Dynamic Range Enhancement (DRE) function which enables precise and easy quantification comparable to that of more conventional mass analyzers. Figure 5 shows an example of the quantification of Ioxynil performed in positive/negative switching mode with DRE.

Figure 5. Quantification of Ioxynil in +/- switching mode with Dynamic Range Enhancement.

In order to verify the method on samples in a more complex matrix, organic tomatoes were purchased locally, spiked at various concentrations around the typical Maximum Residue Level (MRL) and extracted as outlined in the procedure above. Limits of Detection (LoDs) as shown in Figure 6 were estimated by extrapolating the calibration curve to the concentration which would give a signal-to-noise ratio of 3:1. It should be noted that the lowest MRL currently standing for tomatoes is 20 μg/kg in the cases of acephate, daminozide, oxydemeton-methyl, dimethoate and prosulfuron. All others, where set, are 50 μg/kg or higher. Figure 7 overleaf shows an example of the quantification of Triasulfuron in tomato extracts.

Figure 6. Graph of estimated LoDs and list of pesticides analyzed in tomato extracts.
Figure 7. Quantification of Triasulfuron in tomato extracts. The MRL for this compound in tomatoes is 50 μg/kg.

Conclusion

  • The method is shown to provide a rapid and sensitive automated screening analysis that is applicable to both simple and complex matrices.
  • The ACQUITY UPLC System provides a fast chromatographic run with good resolution so as to minimize interference from co-eluting peaks.
  • High mass-accuracy MS spectra provided by the LCT Premier Mass Spectrometer allows confirmation of targeted compounds and helps identify unknowns.
  • ChromaLynx Application Manager Software performs automated de-convolution of complex chromatographic data to provide simplified results.
  • Further work should extend the library to contain as many contaminants as possible, and investigate the use of exact-mass fragments formed by in-source CID for confirmation purposes.

Featured Products

720001437, January 2006

Back To Top Back To Top