• Application Note

Analysis of Gramicidin using UltraPerformance Convergence Chromatography (UPC2)

Analysis of Gramicidin using UltraPerformance Convergence Chromatography (UPC2)

  • Sean M. McCarthy
  • Andrew J. Aubin
  • Michael D. Jones
  • Waters Corporation

Abstract

In this application note, we present the separation of gramicidin as a model membrane-spanning peptide using Waters UltraPerformance Convergence Chromatography technology on the ACQUITY UPC2 System.

Benefits

  • Rapid separation of gramicidin
  • Linear response with mass load
  • Accurate and precise method for analysis of gramicidin
  • Potential application for other hydrophobic peptides and proteins

Introduction

Analysis of hydrophobic peptides and proteins by reversed phase liquid chromatography (RPLC) is challenging. Detergents are often required to keep hydrophobic species in solution, and they tend to aggregate and/or precipitate, which can adversely affect their recovery. These factors, among others, can make it difficult to separate hydrophobic peptides and proteins by RPLC.

In this application note, we present the separation of gramicidin as a model membrane-spanning peptide using Waters UltraPerformance Convergence Chromatography technology on the ACQUITY UPC2 System.

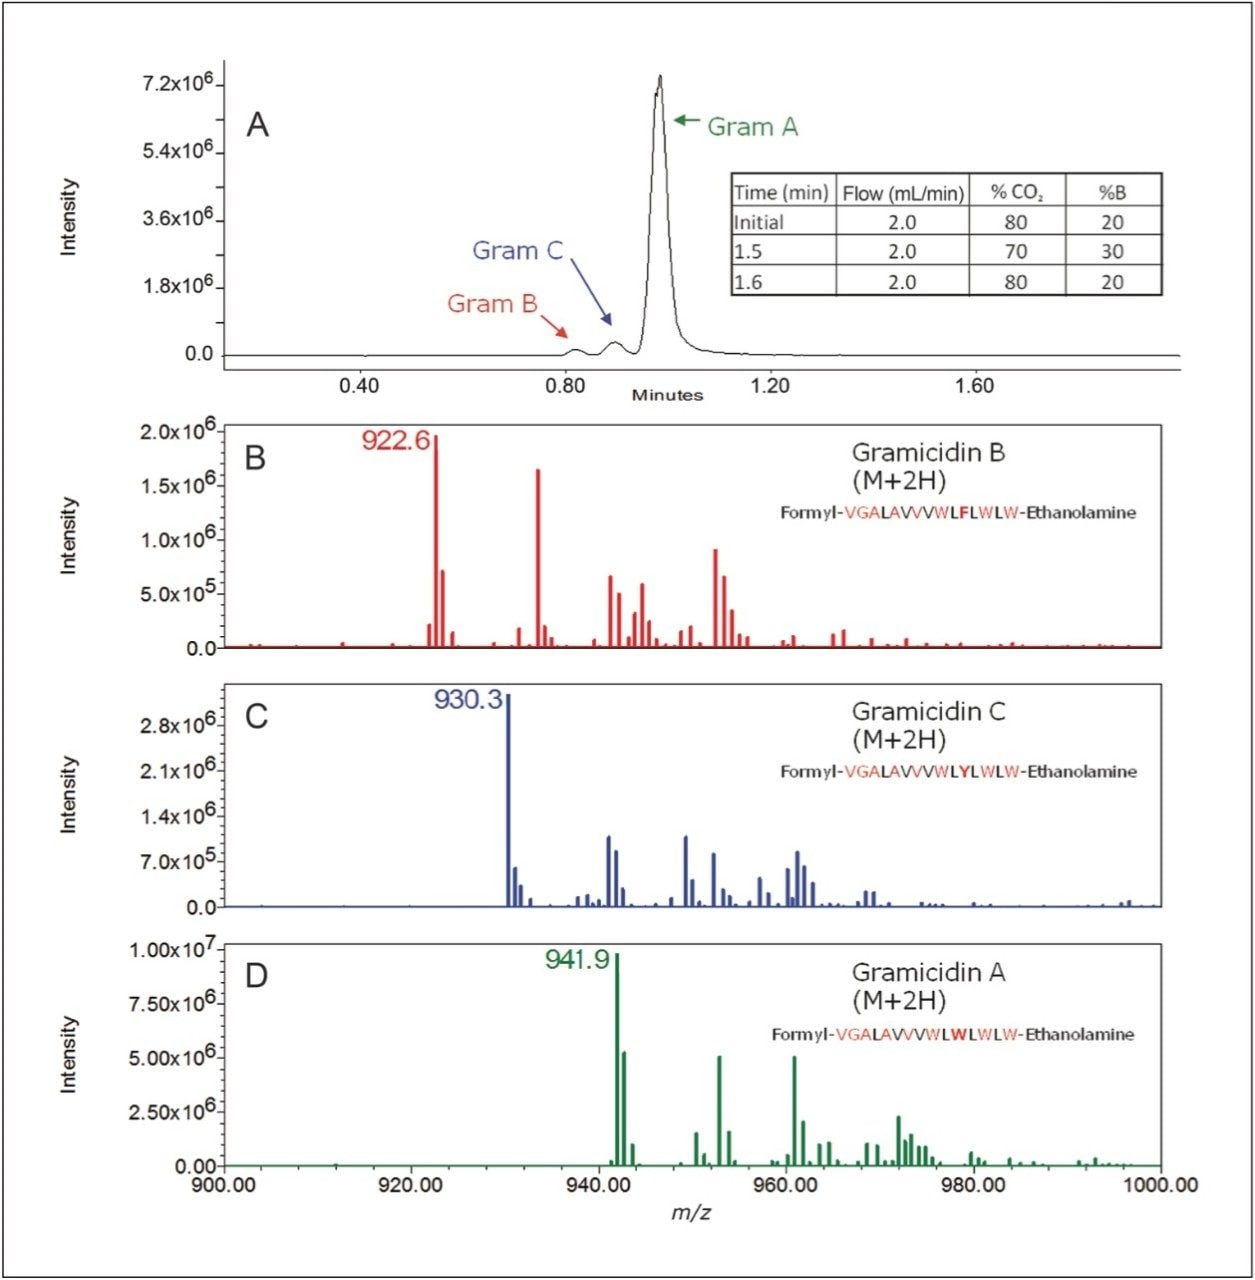
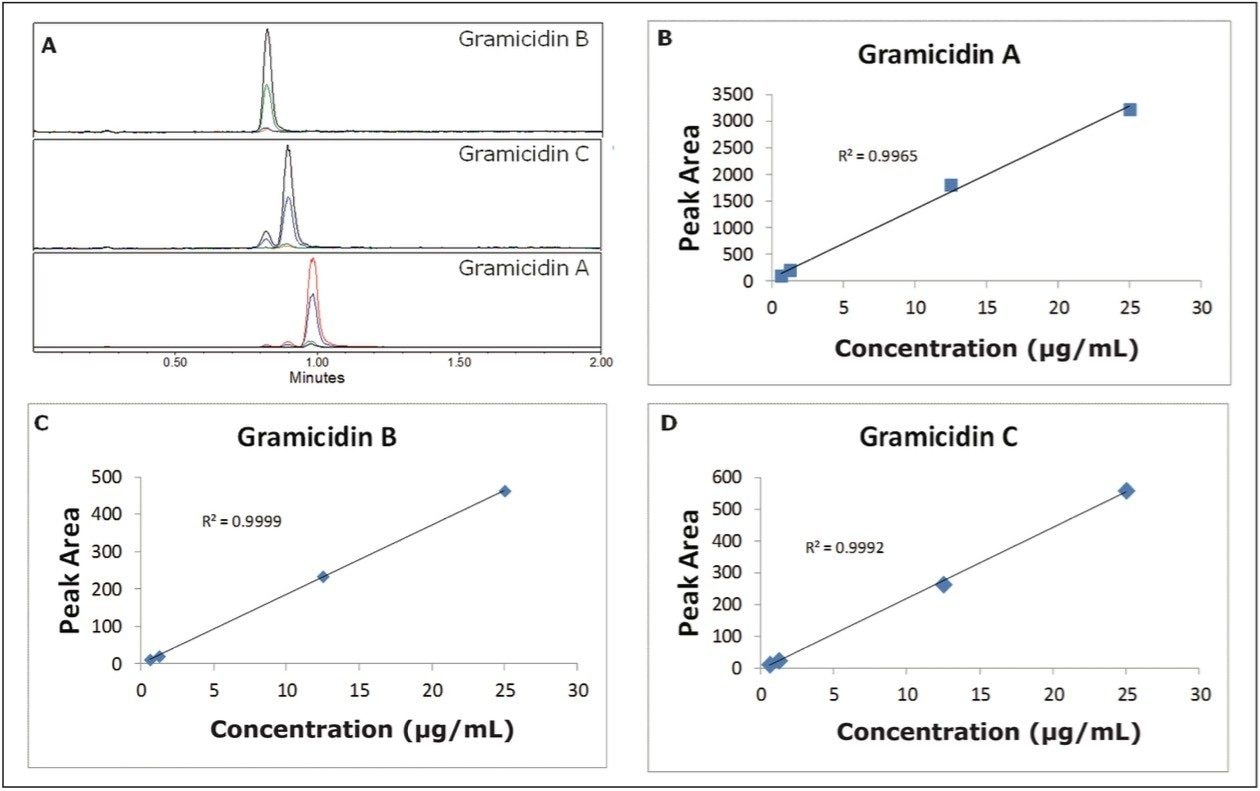
Gramicidin is a common, well-characterized membrane-spanning peptide produced by Bacillus brevis. It is used as a local antibiotic to fight gram-positive and some gram-negative bacteria. Gramicidin is composed of a family of members with the general composition of formyl-L-Val-Gly-L-Ala-D-Leu-L-Ala-D-Val-L-Val- D-Val-L-Trp-D-Leu-L-X-D-Leu-L-Trp-D-Leu-L-Trp-ethanolamine, where X depends on the gramicidin molecule, namely Gram A (X = Trp), Gram B (X = Phe), and Gram C (X = Tyr), making up roughly 87.5%, 7.1%, and 5.1% of the total gramicidin, respectively.1 The alternating D and L amino acids are necessary to form a β-helix.

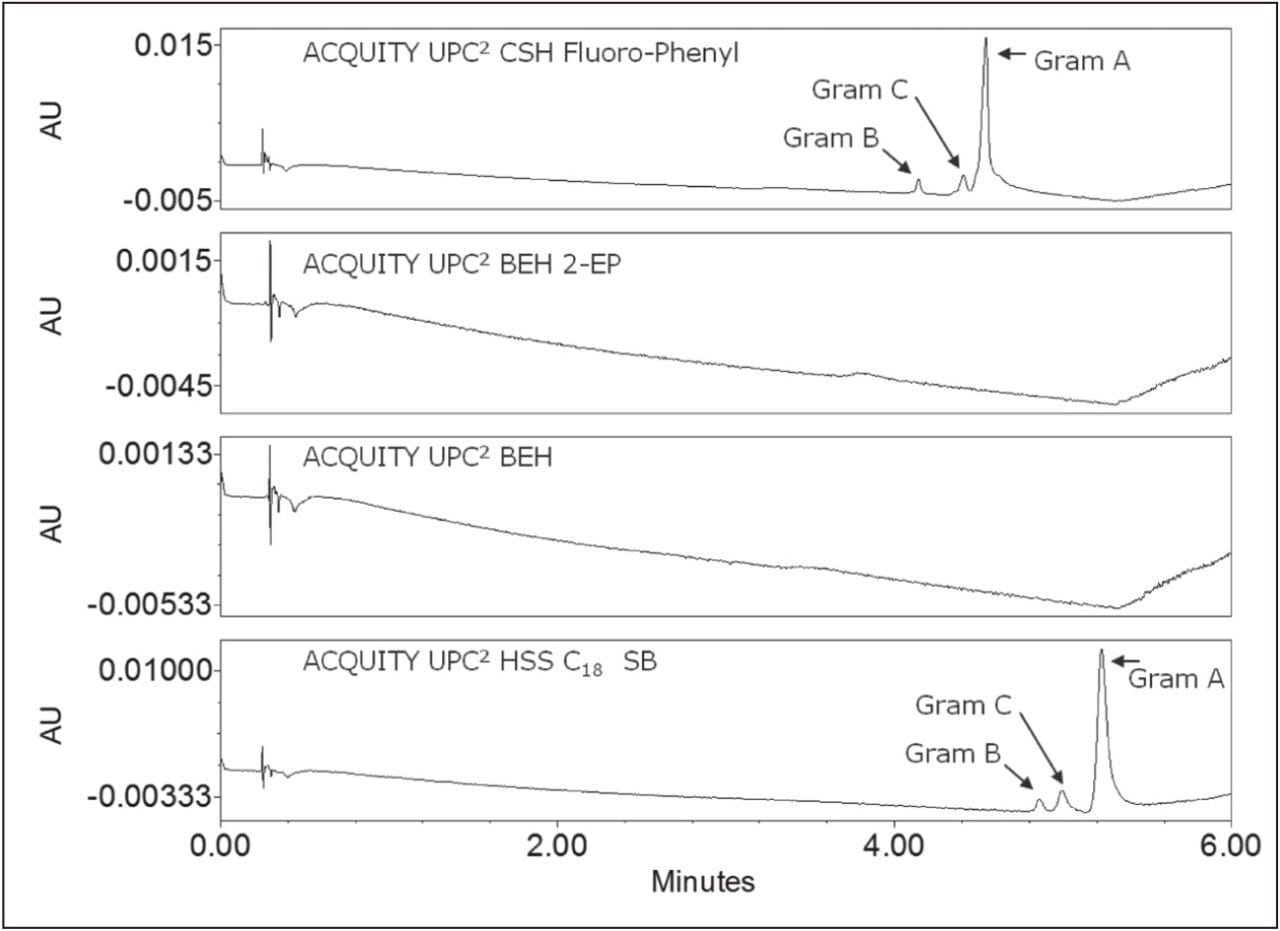
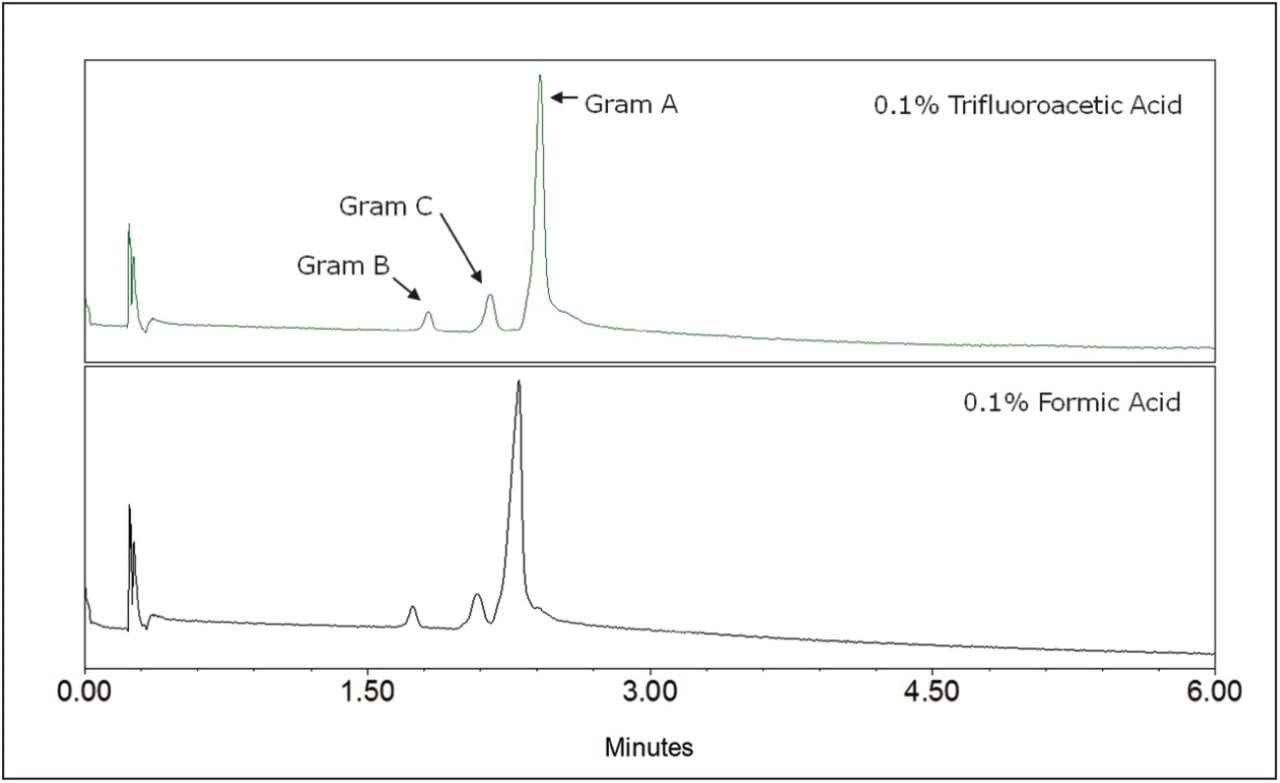
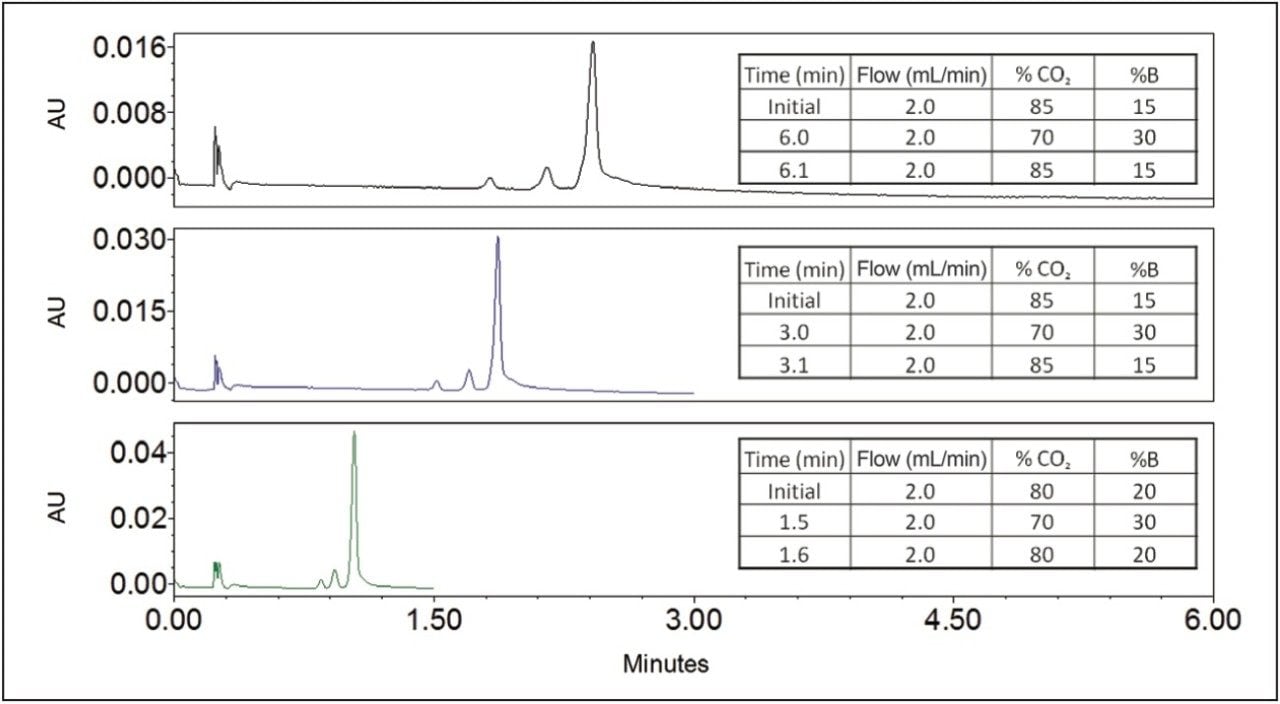
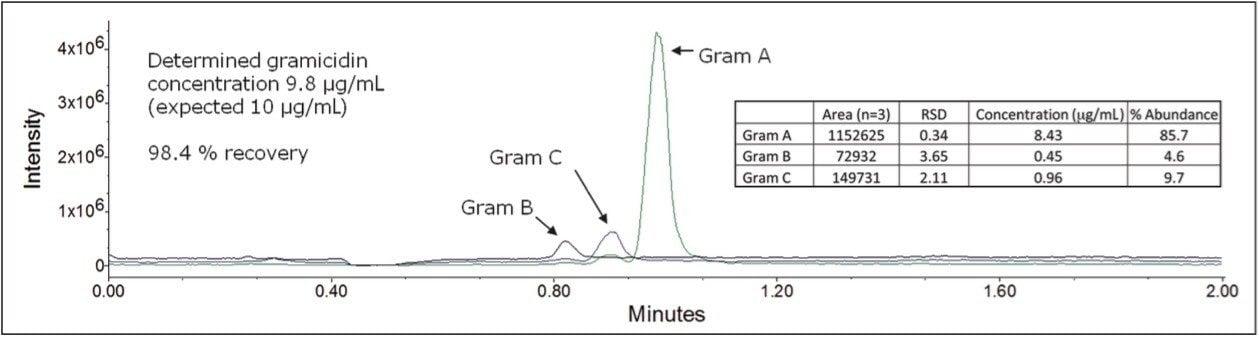
We investigated the impact of column chemistry, mobile phase modifier, and gradient slope for the separation of gramicidin. We applied the optimized method to the separation of a commercially available, over-the-counter (OTC) product to compare the determined gramicidin concentration with the label claim. The gramicidin concentration was measured with a mass spectrometer, using selected ion chromatograms for each species. Using the ACQUITY UPC2 System with our method, linear, and reproducible results showed a determined concentration of 98.4% of the label claim for an OTC preparation.

Experimental

Method conditions

Below are optimized conditions for the final method that apply to all chromatograms unless otherwise specified.

UPC2 Conditions

UPC2 System:

ACQUITY UPC2

Detection:

PDA and ACQUITY SQD PDA 280 nm @ 6 nm resolution (compensated 400 to 500 nm)

Column:

ACQUITY UPC2 CSH Fluoro-Phenyl, 3.0 x 100 mm, 1.7 μm

Column temp.:

50 °C

Sample temp.:

15 °C

UPC2 Sample Manager:

1885 psi

Injection vol.:

1 μL

Flow rate:

2.0 mL/min

Mobile phase A:

CO2

Mobile phase B:

MeOH with 0.1% TFA (unless otherwise specified)

Gradient:

20% to 30% B in 1.5 min

SQD Conditions

Polarity:

ES+

Cone:

20 V

Capillary:

3.7 kV

Source temp.:

150 °C

Desolvation temp.:

500 °C

Desolvation gas:

400 L/hr

Cone gas:

25 L/hr

SIR:

922.6, 930.3, 941.9

Data Management

Empower 3 Software

Sample description

Gramicidin from Bacillus aneurinolyticus (Bacillus brevis) was purchased from Sigma Aldrich. The sample was dissolved in methanol to a concentration of 0.5 mg/mL and diluted, as necessary, in methanol.

An OTC ointment containing gramicidin was purchased from a local pharmacy. Gramicidin was extracted from the ointment by dissolving 0.2 g of ointment in 10 mL of hexanes, and extracted with 5 mL of MeOH. The MeOH layer was removed and filtered through a 0.2-μm sintered glass disk, and injected directly onto the ACQUITY UPC2 System.

Results and Discussion

We systematically screened four column chemistries to determine which provided the best separation, as shown in Figure 1. Column screening was rapid, taking less than one hour to complete. The BEH 2-EP and BEH columns showed no peaks for the analyte under our screening conditions. The reason for their non-elution was not further investigated, as other chemistries exhibited acceptable chromatographic performance. The ACQUITY UPC2 CSH Fluoro-Phenyl column provided the best peak shape of the columns tested and was selected for further studies.

Figure 1. A variety of column chemistries were screened for chromatographic peak shape and retention of a gramicidin standard. All columns contained sub-2-μm particles packed in 3.0 x 100 mm hardware. All separation conditions were MP A: CO2 , MP B, 0.1% FA in MeOH, 2 mL/min, 3% to 25% B in 5 min.

The impact of the acid modifier was investigated for the separation of gramicidin species. Results demonstrated that trifluoroacetic acid (TFA) provided slightly better peak shape, resulting in increased resolution between gramicidins A and C, as shown in Figure 2. It is known that TFA suppresses mass spectrometric ionization; however, sufficient signal was found for each of the species to allow for quantification in a therapeutic preparation, which will be discussed later. For applications requiring greater sensitivity, it may be necessary to reduce the TFA concentration or to utilize formic acid to reach the desired detection limit.

Figure 2. Effect of acid modifier on separation of gramicidin.

After suitable chromatographic conditions were obtained, the separation was optimized by reducing the gradient time, as shown in Figure 3. We were able to obtain resolution of 1.4 or greater of each gramicidin species in 1.5 minutes. Gradient slope was increased by reducing run time at the same flow rate. Efficient separation was maintained, while signal to noise increased from 336 to 605 for gramicidin A.

Figure 3. UV 280-nm traces for optimization of gramicidin A, B, and C separations.

We tested our optimized separation conditions for the ability to detect each of the species with a single quadrupole mass spectrometer (SQD). Figure 4 shows each of the species well-resolved and detected by mass spectrometry. In addition, each gramicidin species exhibits a dominant mass corresponding to the M+2H ion. These values were used in subsequent studies for selected ion monitoring.

Figure 4. Total Ion Chromatogram, panel A, and summed spectra, panels B-D, for each gramicidin species. Most intense ions were selected to access gramicidin levels in commercially available antibacterial preparations. For peptide sequences, residues in red are L isomers, and residues in black are D isomers.

To evaluate the applicability of our method for quantification of gramicidin in a commercial OTC product, we used selected ion monitoring on an ACQUITY SQD, as shown in Figure 5A. We plotted concentration against integrated peak area to generate calibration curves for each of the species. A linear response was found for each component over the tested range, as shown in Figures 5B-D. The calibration curves were used to determine the concentration of each gramicidin species in the OTC product.

Figure 5. Panel A. Overlay of selected ion chromatograms for gramicidin species present in standards prepared at 25.0, 12.5, 1.25, and 0.625 mg/mL. Panels B, C, and D. Linearity fits for integrated MS peak area for each gramicidin A, B, and C, respectively.

The developed method was utilized to assess the concentration and relative abundance of gramicidin species in an OTC product. Each gramicidin species was detected with low % RSD for replicate analyses, and the calculated concentration was in agreement with the expected recovery claim on the label, as shown in Figure 6. We also found that the relative abundance of the gramicidin species were in good agreement with literature reported abundances.1

Figure 6. Overlay of selected ion chromatograms for gramicidin A, B, and C extracted from antibacterial ointment. Calculated RSD values for replicate analyses (N = 3) are within acceptable values. Calculated abundances are in good agreement with literature reported values.1

Conclusion

As demonstrated in this application note, the ACQUITY UPC2 System, when used with ACQUITY UPC2 Column chemistries, provides a simple, accurate, and reproducible method for the analysis of gramicidin. This work demonstrates that the ACQUITY UPC2 System may be suitable for the analysis of hydrophobic peptides and potentially hydrophobic proteins, such as membrane proteins.

References

  1. The Merck Index and Encyclopedia of Chemicals, Drugs, and Biologicals. 13th ed. Whitehouse Station, NJ : Merck Research Laboratories; 2001.

720004443, August 2012

Back To Top Back To Top