• Application Note

Increasing the Spatial Resolution of MALDI Images by Oversampling

Increasing the Spatial Resolution of MALDI Images by Oversampling

  • Emmanuelle Claude
  • Marten F. Snel
  • Therese McKenna
  • James I. Langridge
  • Waters Corporation

For research use only. Not for use in diagnostic procedures.

Abstract

In this application note, we demonstrate how spatial resolution can be optimized on a MALDI SYNAPT HDMS System to obtain pixel spacings that are smaller than the laser beam diameter. This enhanced resolution can be achieved without altering the laser focus and, therefore, does not compromise instrument performance when the instrument is used for non-imaging experiments.

Introduction

Matrix-assisted laser desorption/ionization (MALDI) imaging mass spectrometry (MSI) can be used to determine the spatial distribution of drugs or other components and their relative abundance in tissue sections, without the need for immunochemical or radiolabeled reagents.1 The key factor in determining distribution is the quality of an image, which is determined by the spatial resolution of a pixel. Although it may be desirable to obtain spatial resolution down to cellular level, this is currently not practical with commercial MALDI instrumentation. Contrary to popular belief, the laser spot-size is not the limiting factor for the spatial resolution in MALDI imaging experiments (lasers can be focused to less than 1 μm).1 At very small laser spot-sizes, instrument sensitivity is not sufficient to detect anything but the most abundant species in tissue. For this reason, most imaging laboratories operate with resolutions between 50 μm and 500 μm depending on the experiment.

Effective matrix deposition can be achieved using an aerosol spray, which can provide a range of droplet sizes. However, as the whole tissue section is covered by the matrix, as in the case shown here, then the spot size of the laser will determine the quality of the image when reconstituted from the relative intensity of a particular ion.

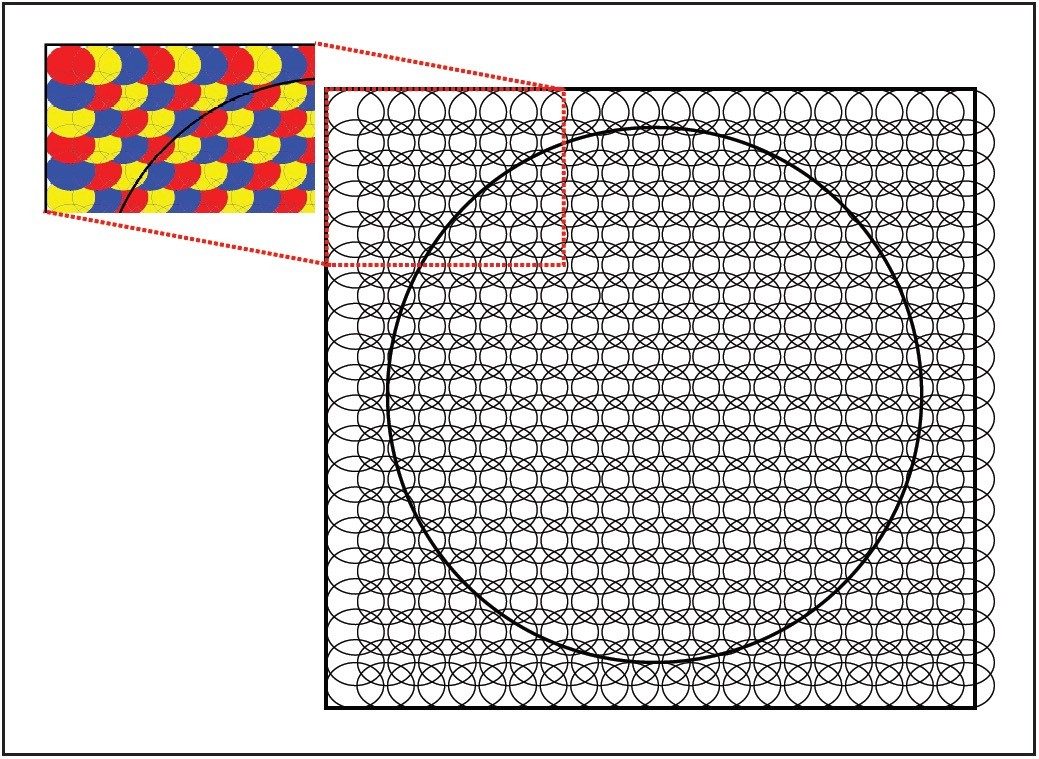
On Waters MALDI oa-TOF mass spectrometers, the laser spot size is around 175 μm. However, because the laser can completely ablate the sample and matrix in one position, the technique of over-sampling can be used to obtain a highly resolved image. This is achieved by using a raster increment smaller than the width of the laser beam (see Figure 1).

Figure 1. Representation of over-sampling when the laser beam is bigger than the raster increment.

In this application note, we demonstrate how spatial resolution can be optimized on a MALDI SYNAPT HDMS System to obtain pixel spacings that are smaller than the laser beam diameter.

This enhanced resolution can be achieved without altering the laser focus and, therefore, does not compromise instrument performance when the instrument is used for non-imaging experiments. In order to exclude the influences of sample preparation of a tissue section on the resolution of the image, we use a simple spot of peptide mixed with matrix. The laser is fired and rastered across the spot with different increments between each position.

MALDI SYNAPT HDMS

Experimental

Sample preparation

[Glu1]-Fibrinopeptide B (GFP, [MH]+ = 1570.6774 Da) was mixed 1:1 with matrix alpha cyano-4-hydroxy cinnamic acid (3.6 mg/mL in aqueous solution with 50% acetonitrile, 0.1% trifluoroacetic acid). 50 fmol of GFP were spotted onto a MALDI target.

Mass spectrometry

All MS experiments were carried out in an automated mode on a SYNAPT HDMS System, in positive ion V-mode. The mass range was 1,000 - 2,000 Da.

The first position to be imaged was the top-left corner of the desire region. The sample stage was then moved from left to right (x-axis), in small increments (= the spatial resolution of the image) under a stationary laser beam. When the row was complete, the sample stage was moved back to the left most position of the area of interest and offset by one increment in the (y-axis) up-down direction. Each position received 400 laser shots and a mass spectrum was collected at each position. Four spatial resolutions were used: 300 μm, 150 μm, 75 μm, and 45 μm (a square raster was designed for four different tests). The area analyzed remained constant for each spatial resolution setting, resulting in the following grid patterns: for 300 μm a grid of 8 x 8 (64 pixels), 150 μm a grid of 16 x 16 (256 pixels), 75 μm a grid of 32 x 32 (1024 pixels), and for 45 μm a grid of 53 x 53 (2809 pixels).

Results and Discussion

Data processing

Raw data were visualized in “BioMap” (www.maldi-msi.org). Intensity distribution maps were visualized by selecting a mass range around the 1570.67 peak of GFP. Photographic images of individual spots were taken prior to MALDI MS acquisition and using BioMap. These were overlaid on the reconstituted ion image of the compound of interest. For each spatial increment size the reconstituted GFP ion image was displayed alone and overlaid on the photographic image from the camera (Figure 2).

Figure 2. Reconstituted GFP ion image alone (left) and overlaid on the photographic image (right) for each spatial resolution.

As expected, the quality of the image increased as the spatial resolution increased, i.e. as the raster increment decreased. At 300 μm, each pixel within the spot gave an ion peak. However, at 150 μm areas where there was no matrix, crystals on the target could be observed. The image quality at 45 μm spatial resolution allows clear identification of regions where there was no matrix. A comparison of the mass spectra obtained from the most intense pixels from each spot is shown in Figure 3. A reduction in signal intensity was observed as the increment decreases due to the analysis of a smaller area. This should be considered during the experiment setup procedures when sensitivity may be crucial in drug distribution studies in tissue.

Figure 3. MS spectra of GFP for the most intense pixel at each spatial resolution.

Conclusion

  • This work describes the technique of over-sampling with complete sample ablation on a SYNAPT HDMS System to produce a highly resolved image without the need of modifying the optics of the mass spectrometer.
  • Increases in image quality are produced when using raster increments below 50 μm. Finer details can be visualized at this level of spatial resolution, like sub-regions of the brain.
  • When the size of a pixel is decreased, the signal intensity also decreases. Balance between image quality and sensitivity is a consideration to take into account when the mass spectrometric experiment is set-up.

References

  1. MALDI-MS imaging of features smaller than the size of the laser beam, JASMS, Vol 15, 2005, 1654-1659.

720002630, May 2008

Back To Top Back To Top