In this application note, we illustrate how the combination of Waters' UltraPerformance Liquid Chromatography (UPLC) system for high-resolution separations, ACQUITY UPLC Photodiode Array (PDA), eλ Detector, and accurate mass Xevo G2 QTof MS, with the appropriate chemometric software tools, allow easy and rapid differentiation between authentic and adulterated pomegranate juice samples.
The verification of food sources and authenticity is an activity that has increased in importance over the last decade. The adulteration of food and beverages has emerged as a growing problem that can pose potential threats to the health of consumers and to the integrity of the industry1. Economic adulteration and other types of counterfeiting in the food and consumer products industries are estimated to cost between $10 and $15 billion USD per year.2
There are different types of adulteration that can occur, as illustrated in Figure 1. While some types can be harmful to health3 (melamine is a good example of this); others can be very misleading to the consumer – especially if they believe the product is beneficial for certain health conditions. To date, reported cases of fruit juice adulteration primarily include the addition of highfructose corn syrup (HFCS) or blending with other fruit juices.
Consumer demand for some fruit juices, such as pomegranate juice, has increased significantly in recent years as clinical studies indicate that there may be positive health benefits associated with the consumption of the fruit and the juice form. These health benefits include the prevention against cancer and cardiovascular disease.4-7 For this reason, pomegranate juice has gained a reputation for being a super fruit – with demand often exceeding supply. As a result, the practice of adulterating pomegrantite juice with lower quality juices has become prevalent.8
One of the issues the fruit juice industry faces is in the research and development of new and exotic juice varieties. While many of the common fruit juices that have been in the marketplace for many years are analytically well documented and studied, this is not always the case for the newer juices that are now available. For these types of products, there is a need for sophisticated testing methods to help authenticate ingredients and finished products.
In this application note, we illustrate how the combination of Waters Ultra Performance Liquid Chromatography (UPLC) System for high-resolution separations, ACQUITY UPLC Photodiode Array (PDA), eλ Detector, and accurate mass Xevo G2 QTof MS, with the appropriate chemometric software tools, allow easy and rapid differentiation between authentic and adulterated pomegranate juice samples.
A description of the pomegranate samples is provided in Table 1.
Three pomegranate juice concentrate samples were obtained from a collaborator: one authentic (S2) and two adulterated (S1 and S3). Commercially available pomegranate juice samples were also included in the experiment (S4-S6). Consultation with industry experts confirm that the sample labeled S4 is believed to be 100% authenticpomegranate juice.
The juice concentrates were made up to single dose (160 Brix). One degree Brix is one-gram of fruit soluble solids in 100 grams of solution, and thus represented the strength of the solution as a percentage by weight (% w/w). All samples were centrifuged, filtered, and diluted before analysis.
Whole fruit pomegranates were dissected into three components: arils, pulp, and skin. Each component was homogenized, centrifuged, and filtered before analysis.
LC system: |
ACQUITY UPLC |
Column: |
ACQUITY HSS T3, 2.1 x 100 mm, 1.8 μm |
Column temp: |
45 ˚C |
Flow rate: |
0.4 mL/ min |
Mobile phase A: |
10 mM Ammonium acetate in water |
Mobile phase B: |
Acetonitrile |
Detector: |
ACQUITY UPLC PDA Detector |
Range: |
210 to 500 nm |
Sampling rate: |
20 pts/s |
Filter constant: |
0.1 |
MS System: |
Xevo G2 QTof |
Ionization mode: |
ESI negative (ESI-) |
Analyzer mode: |
Resolution |
Capillary voltage: |
2.0 kV |
Cone voltage: |
25 V |
Desolvation temp.: |
450 ˚C |
Desolvation gas: |
900 L/Hr |
Source temp.: |
130 ˚C |
MSE Low energy CE: |
4 eV |
MSE High energy CE: |
15 to 45 eV |
Acquisition range: |
50 to 1200 m/z |
Scan time: |
0.1 sec |
Lock mass reference: |
Leucine enkephalin |
Data analysis and trending were performed using MarkerLynx XS Application Manager, which enables the user to perform multivariate analysis (MVA). Spectral interpretation used EleComp, ChemSpider, and MassFragment Software to help identify the structures of unknown marker compounds.
All samples were analyzed using UPLC, PDA, and QTof MS. Typical chromatograms are shown in Figure 2. Replicate injections of the pomegranate samples (in random sequence order) were used to ensure that any experimental trends observed were directly associated to the sample.
Data from the Xevo G2 QTof MS provided simultaneous accurate mass information, for both the precursor and fragment ions in a single injection. Two separate functions from the MS were produced. It is this spectral information that enables potential structural identification of unknown marker compounds.
The low collision energy chromatogram shown in Figure 2C provided the exact mass precursor ion information, and the high collision energy, shown in Figure 2B gave the exact mass fragment ion data. The ability to cycle between low and high collision energy to obtain both precursor and fragment ion information within one analysis is a unique feature of the Waters QTof MS systems – this capability is called MSE.
The MS data were interpreted using a Multivariate Approach (MVA) using the MarkerLynx XS Application Manager. The software performs automatic data integration and alignment to generate Exact Mass Retention Time (EMRT) pairs.
These EMRT pairs can then be used for multivariate statistical analysis to enable visualization and interpretation of complex MS data sets.9 The complete software workflow used in these experiments is described in Figure 3.
Figure 4 shows the six juice samples interpreted using Principal Component Analysis (PCA). The scores plot helps to visualize the patterns, trends, and similarities between samples. Each point in the scores plot represents a single injection. The repeat injections of each sample set are very close, indicating good repeatability.
To explain the relationship between the potential markers (EMRTs) and relate these to the score plots, one approach (when looking at multiple samples) is to use a loadings plot, as shown in Figure 5. It is then possible to highlight EMRT’s in the loadings plot and track their abundance using a variable trend plot.
Using both the loadings plot and the variable trend plot, it can be seen that two EMRTs, with m/z 353.0868 at retention times (Rts) 3.18 and 4.34 min are absent in the known authentic samples (S2 and S4), and S5 (a sample of unverified authenticity), as shown in Figure 6.
The presence of these two EMRT pairs at Rts 3.18 and 4.34 min was clearly evident in the deliberately adulterated juice samples and the juice blend. The elemental composition for both components was determined to be C16H17O9. Searching the formula in ChemSpider (an online database) proposed chlorogenic acid as the top hit. Following the workflow described in Figure 3, MassFragment Software was used to determine whether the fragments seen in the MSE data matched possible fragments for this compound. The results indicated that chlorogenic acid matched well.
To confirm the identity of this potential marker, a standard of chlorogenic acid was analyzed and this standard eluted at a retention time of 3.18 min, shown in Figure 7A, which was the same retention time as one of the peaks in the samples, shown in Figure 7B.
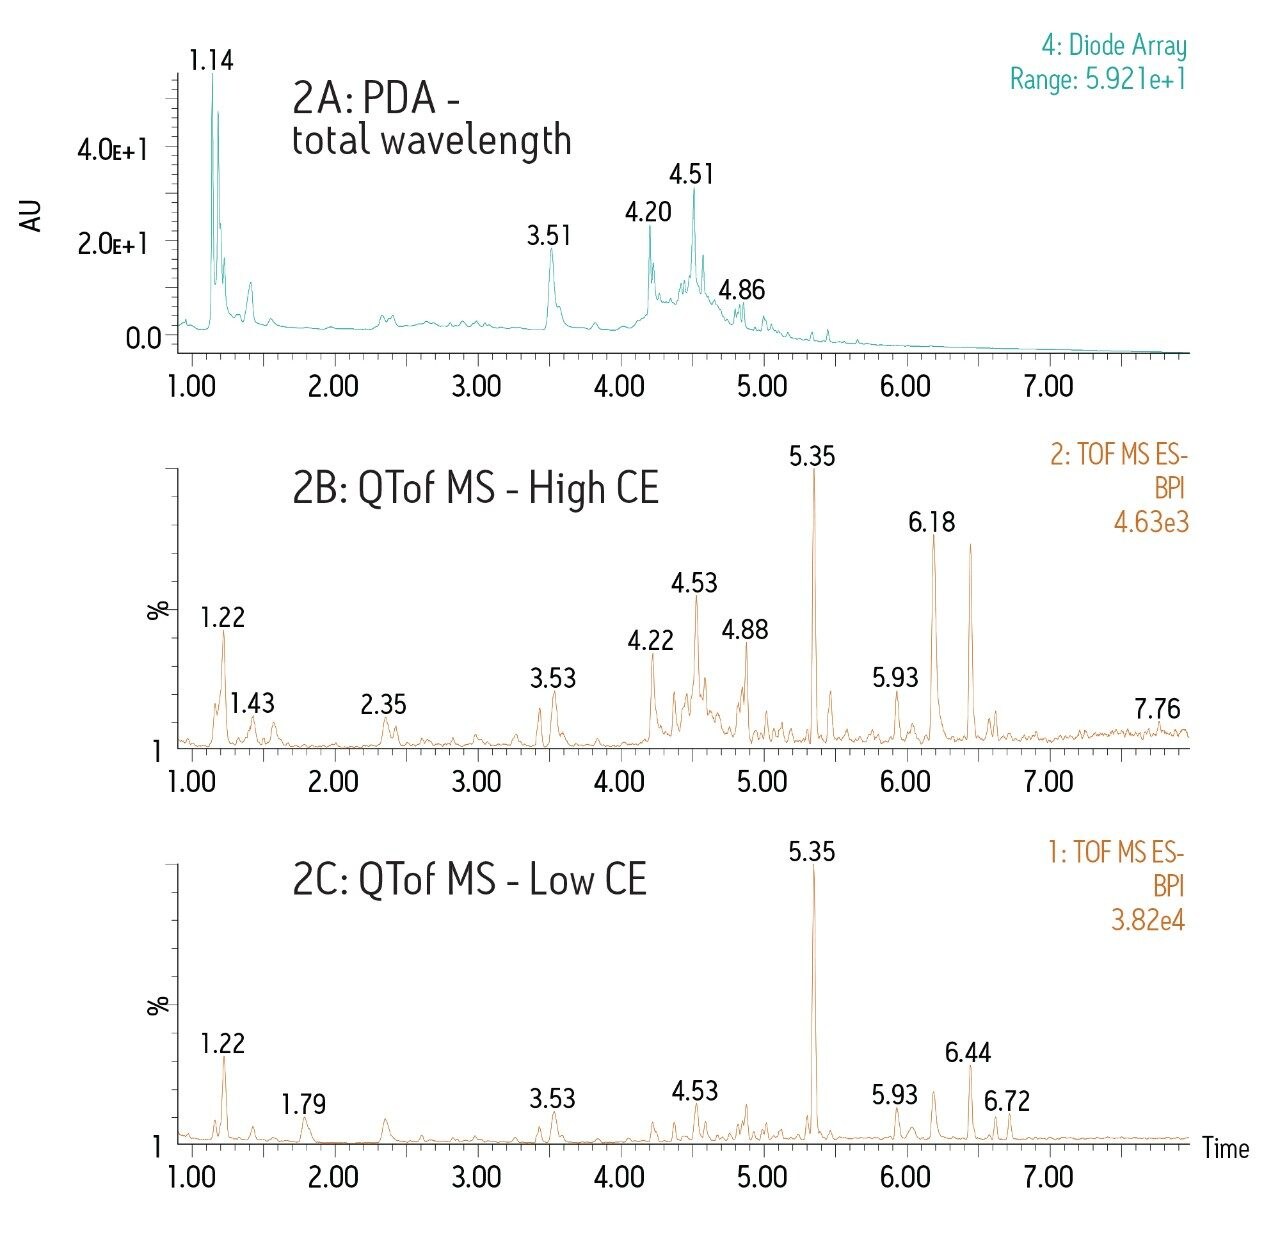
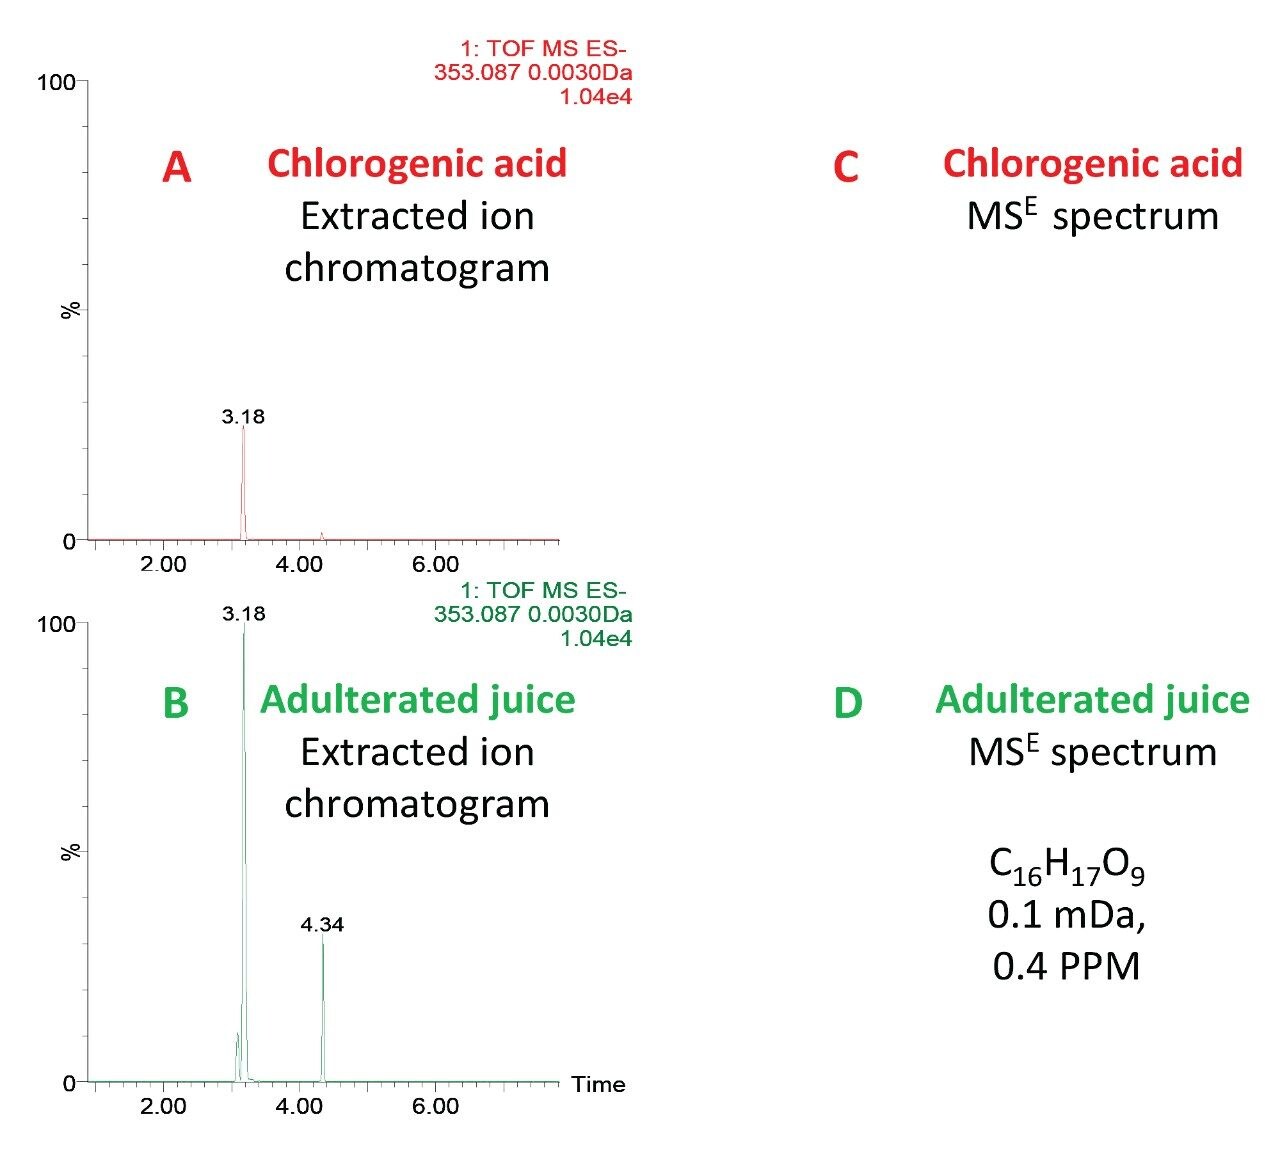
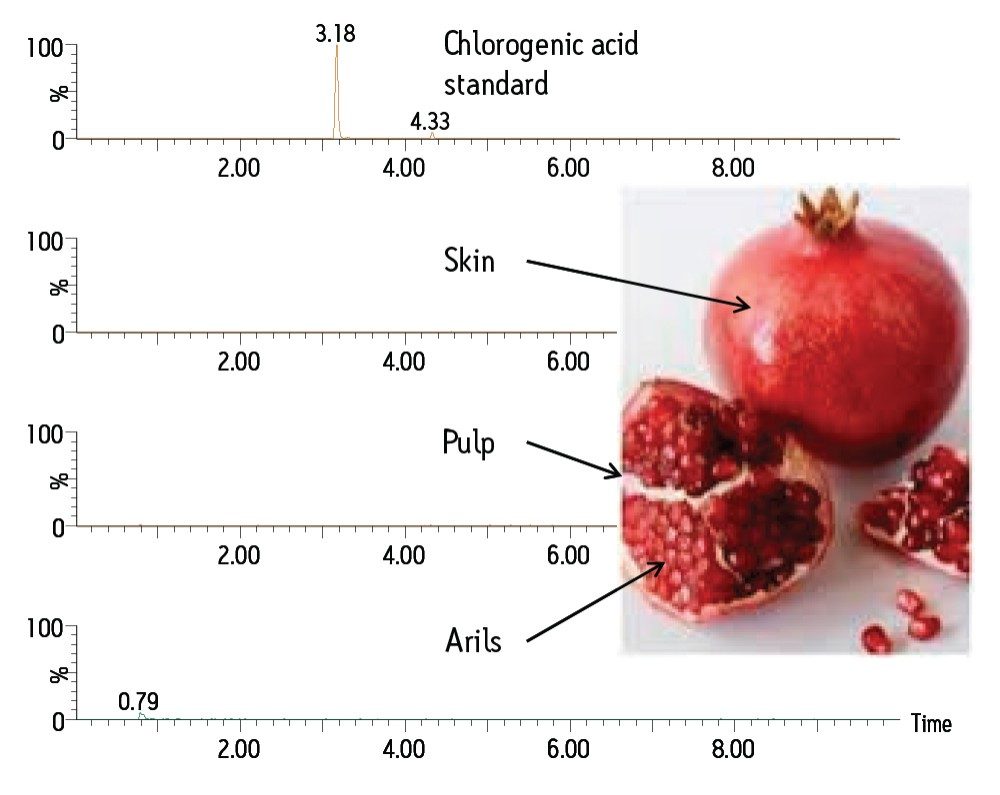
The UV spectra of the standard chlorogenic acid and the peak in the sample were compared. The UV spectra taken across the entire peak width was inconclusive due to co-elution of other compounds in the samples. The MS data was then investigated and the low energy precursor ions and high energy fragment exact mass ions provided excellent confirmation that the component at Rt 3.18 min was chlorogenic acid, as shown in Figures 7C and 7D.
The MSE data for the component at Rt 4.34 min revealed that while it shared some common fragments with chlorogenic acid, it also showed additional fragments. This suggests that this component may be a possible isomer of chlorogenic acid (data not shown).
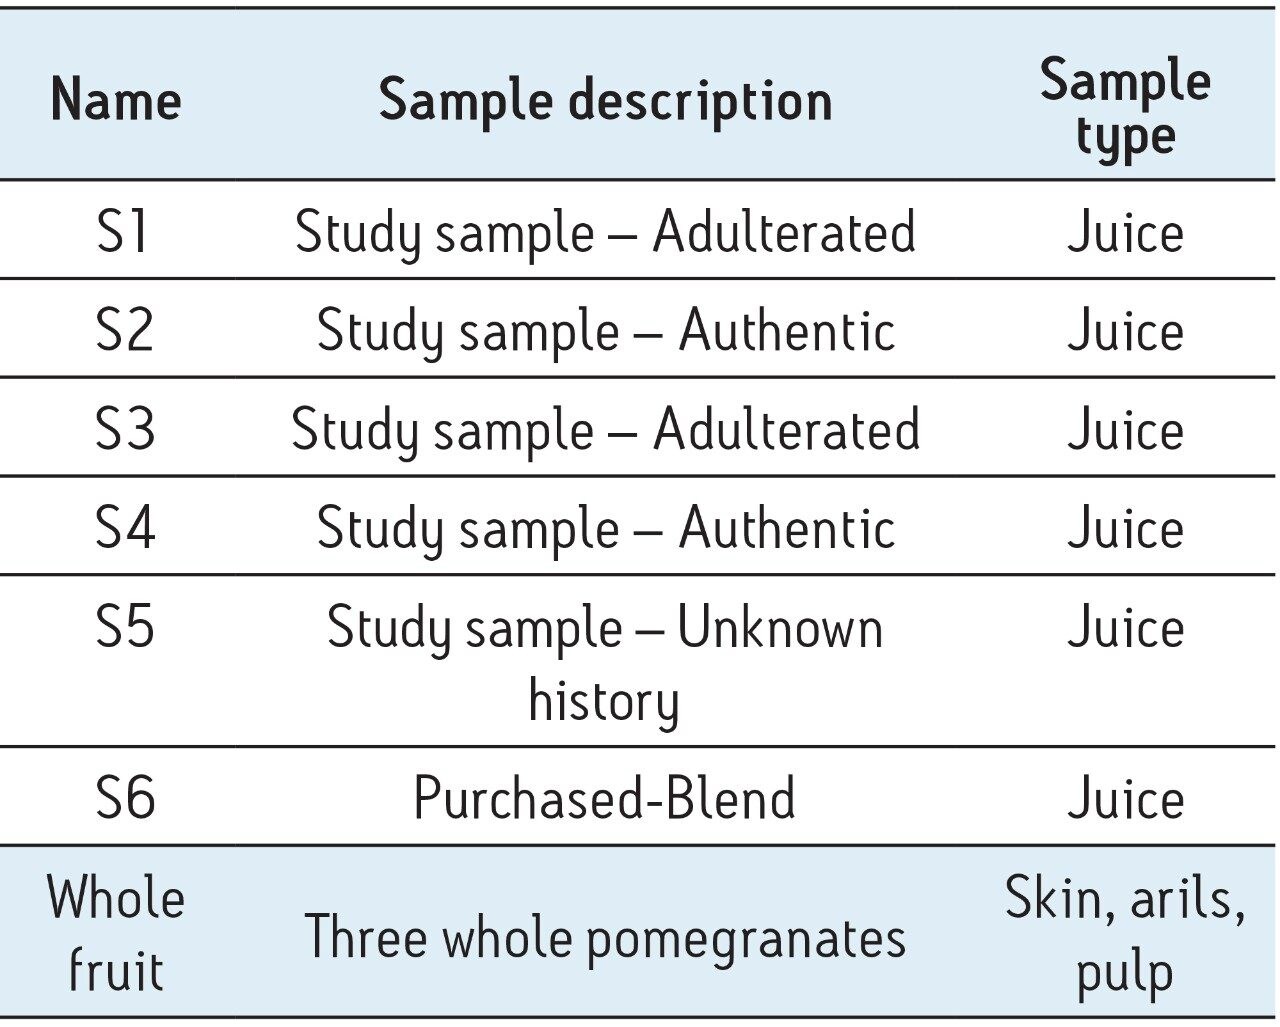
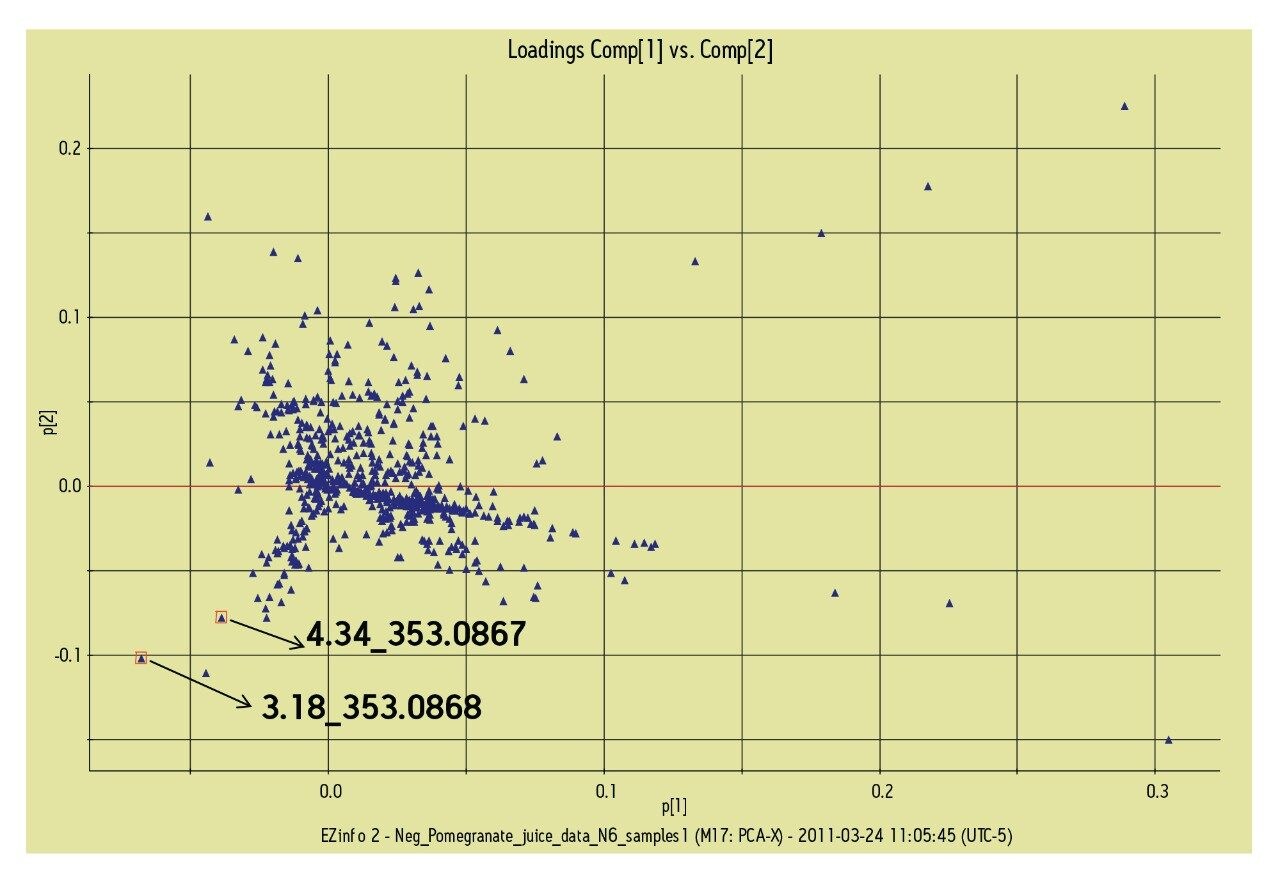
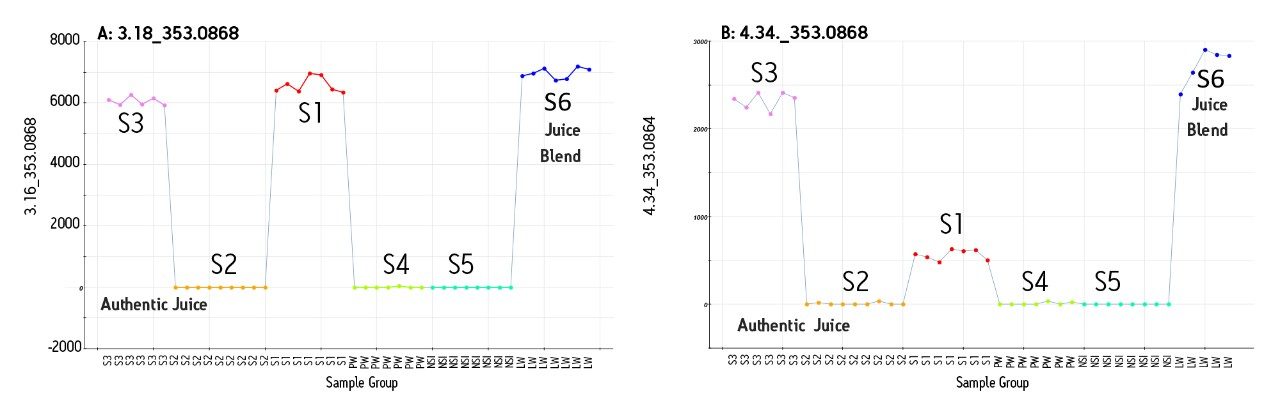
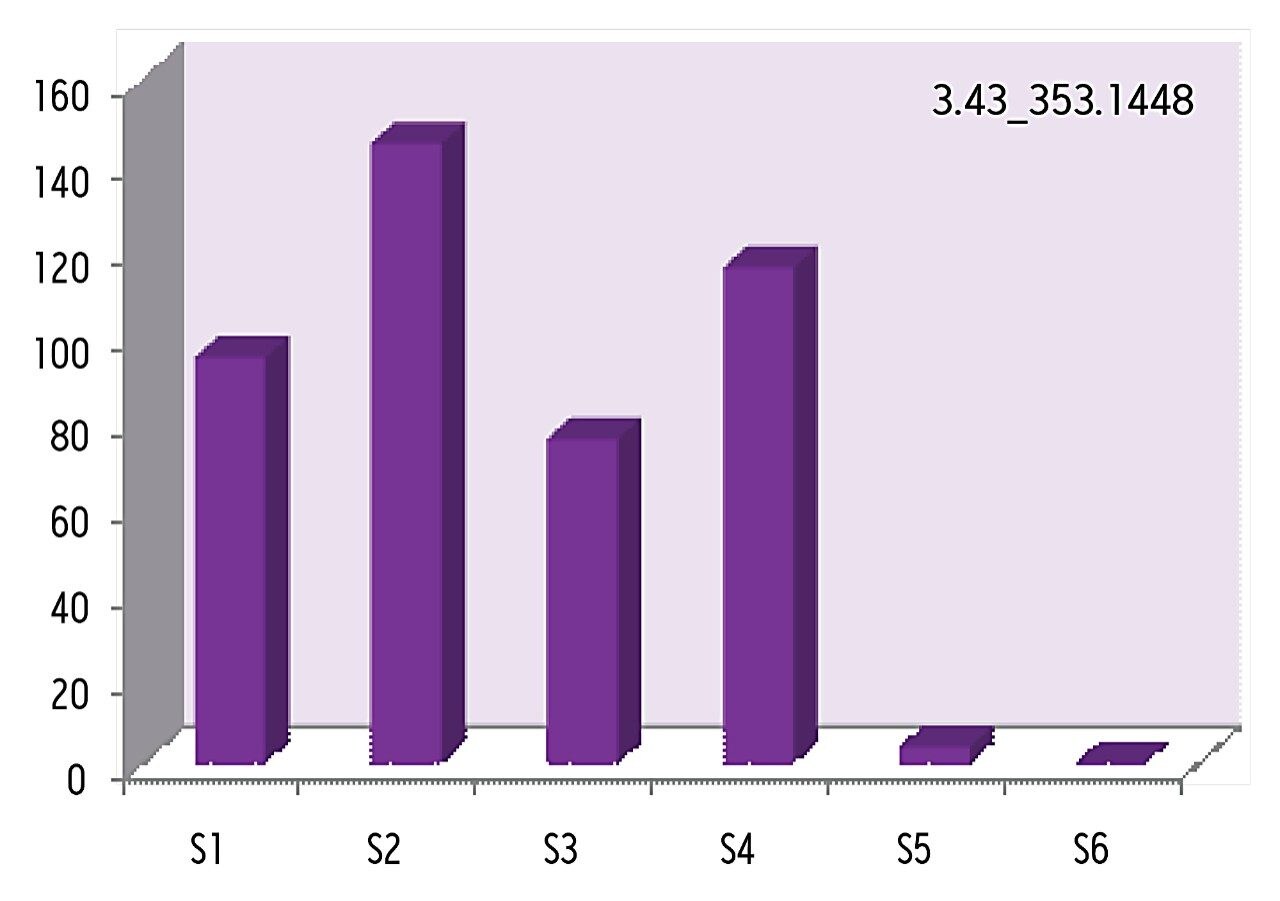
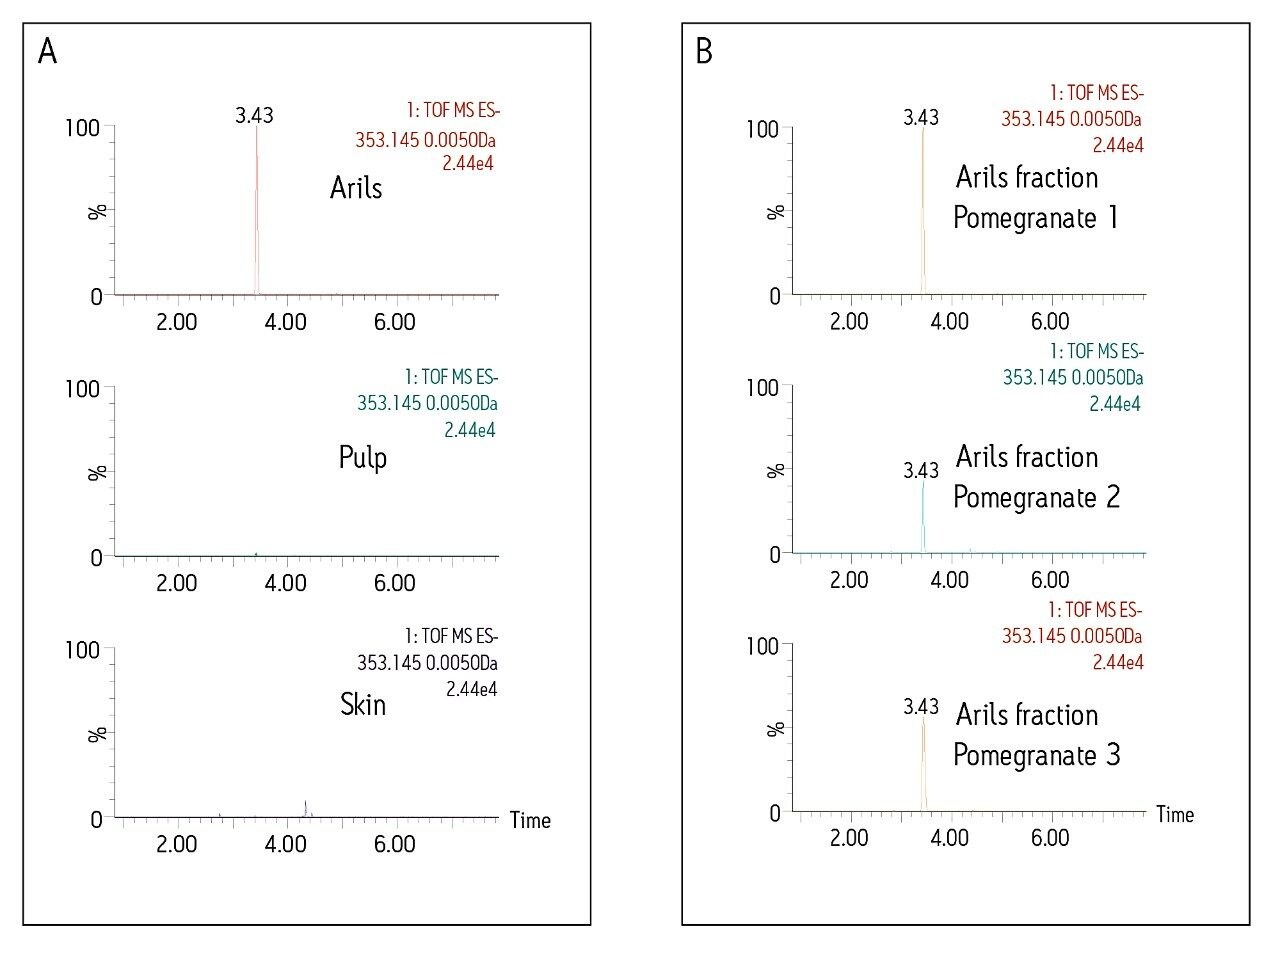
A closer look at the adulterated samples (S3 and S1) and the juice blend (S6), show that they all contain chlorogenic acid (m/z 353.0873 at 3.18 min) and possible isomers at 4.34 min and 3.09 min.
Analysis of other fruit juices showed that chlorogenic acid was also identified in authentic peach, cranberry, and blueberry juice samples (data not shown).
Eleven additional pomegranate juice samples, all claiming to be made from 100% authentic pomegranate juice or juice concentrate were purchased and analyzed. The LC-MSE data revealed the presence of chlorogenic acid in five of the samples tested. Two of those five samples were made from imported juice and juice concentrate from Turkey. Poyrazoglu et.al have reported the presence of chlorogenic acid in 13 different pomegranate varieties from four growing regions in Turkey using LC/UV.10
Experiments were then performed on whole fruit samples to determine whether chlorogenic acid is present in pomegranate. Three whole fruit pomegranates (all believed to be grown in North America) were purchased and dissected into three components: arils, pulp, and skin. The pomegranate segments were extracted and analyzed.
Using the same analytical conditions as for the juice, chlorogenic acid could not be found in any part of the pomegranates, as shown in the extracted ion chromatograms in Figure 8.
These additional experiments suggest that North American pomegranates (grown and harvested during this time) do not contain any detectable amount of chlorogenic acid. It also suggests that the presence of chlorogenic acid in North American pomegranate juice may indicate the blending of other juices. To further understand the detection of chlorogenic acid in pomegranate varieties from different regions, a much broader mass spectrometric study is warranted.
Another EMRT of interest, 3.43_353.1448 was also investigated using the same workflow as described previously. The elemental composition was determined to be C14H26O10. The extracted ion chromatograms of this m/z from the juice samples used in the study revealed it to be present in all pomegranate samples but at varying concentrations. For the juice blend (S6), it was present at a low level, as shown in Figure 9. However for the authentic juices, the levels were higher with the highest levels found in the authentic pomegranate juice (S2).
Extracted ion chromatograms of m/z 353.1448 in the whole fruit extracts (arils, pulp, and skin) shown in Figure 10A, revealed that this marker was only present in the arils, and that it was present in the arils of all three pomegranates, shown in Figure 10B.
Figure 10A. Extracted ion chromatograms for marker 3.43_353.1448 in the arils, pulp and skin of a whole pomegranate.
Figure 10B. The marker was found in the arils of all pomegranates used in the study.
The uniqueness of this compound to pomegranate, and only within the arils of pomegranate suggests that it could be a valuable marker for the quality of pomegranate juice. However, additional experiments are required to identify this compound and study the seasonal, varietal, and geographical variations of the compound.
Chlorogenic acid was absent in the authentic pomegranate juices analyzed in this study. Similarly it was not found in three whole fruit pomegranates. The adulterated samples used in this study, chlorogenic acid and two possible isomers were found to be present. This compound could, therefore be a potential marker compound for determining pomegranate juice authenticity.
Economic adulteration of food and beverage products is a problem that has increased in magnitude because it has a lucrative outcome for unscrupulous members of the food manufacturing chains.
720004010, August 2011