• Application Note

Discrimination of Different Unifloral Honeys Using an Untargeted High-Definition Mass Spectrometry Metabolomic Workflow

Discrimination of Different Unifloral Honeys Using an Untargeted High-Definition Mass Spectrometry Metabolomic Workflow

  • Antonietta Wallace
  • Joanne Connolly
  • Sara Stead
  • Simon Hird
  • Waters Corporation

Abstract

Honey is a high value food commodity frequently subjected to fraudulent mislabeling and adulteration. The metabolomics workflow is emerging as a powerful approach for the discovery of biomarkers to tackle food fraud. The Progenesis QI workflow provides an easy-to-use, scalable system for analysis of food metabolomic data including accurate peak alignment and peak picking, classification of samples using multivariate statistical analysis, quantification of relative abundance of markers for each class and identification of markers from database searches supported by structural elucidation tools.

Benefits

  • Differentiation of honeys of different botanical origin.
  • Verification of the selection of markers for different botanical origin in honey by UPLC-MS/MS.

Introduction

Food fraud is a collective term which describes a substitution, addition, alteration; or a misrepresentation, deliberate and intentional of food ingredients or of food packaging; or false or misleading statements formulated concerning a product for economic gain.1 Recent scandals have highlighted that food fraud can also result in major food safety issues.

Honey is a high value food commodity frequently subjected to fraudulent mislabeling and adulteration. The non-compliances detected during the European Commission (EC) 2015 coordinated control plan were mostly related to adulteration with sugar (6%), and to the declaration of the botanical source (7%). Non-compliances related to the declaration of the geographical origin were less frequent (2%), but were considered more difficult to detect.2 Analytical methods used in the quality control of honey have recently been reviewed.3

The nutraceutical properties of honey arise from specific chemical compositions, which vary according to botanical origin. These properties also confer distinct sensory profiles to various types of unifloral honeys. For these reasons, the price of unifloral honeys is higher than that of polyfloral honey. Adulteration in terms of the dilution of honeys of high value floral origin with those of lower value has increased in recent years. For example, the great commercial relevance attributed to Manuka honey, due to the promotion of its perceived increased antibacterial activity and health benefits, as well as its limited availability, has led to a high frequency of fraud. Guidance on labeling requirements and defining the characteristics of Manuka honey has been established.4

Identification of the floral origin of honey is typically achieved by melissopalynological analysis based on pollen characterization, complemented by sensory and physico-chemical analysis. However pollen identification requires a high degree of skill, in some cases gives erroneous results and can fail to detect closely related species (e.g. Manuka and Kanuka). The simultaneous detection of multiple components using spectroscopic and spectrometric techniques, coupled with statistical analysis, is a promising approach to achieve botanical discrimination.5 LC-HRMS is one technique that has been used extensively for metabolic profiling in the food and beverage industry6,7,8 including for the analysis of honey.9    

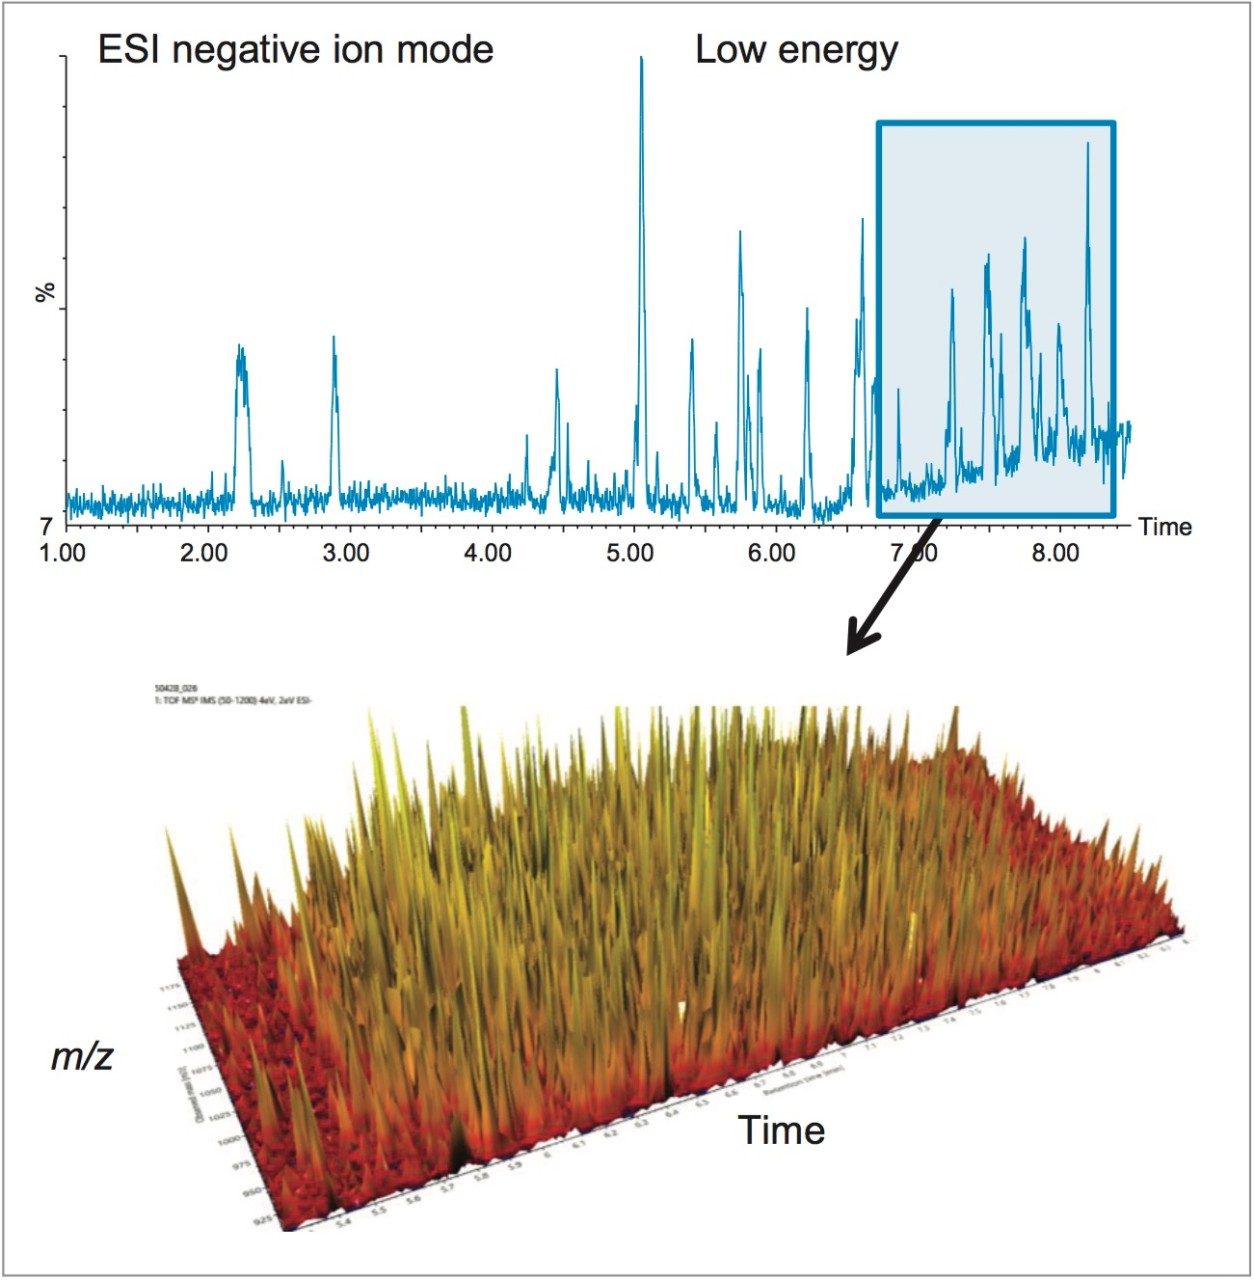
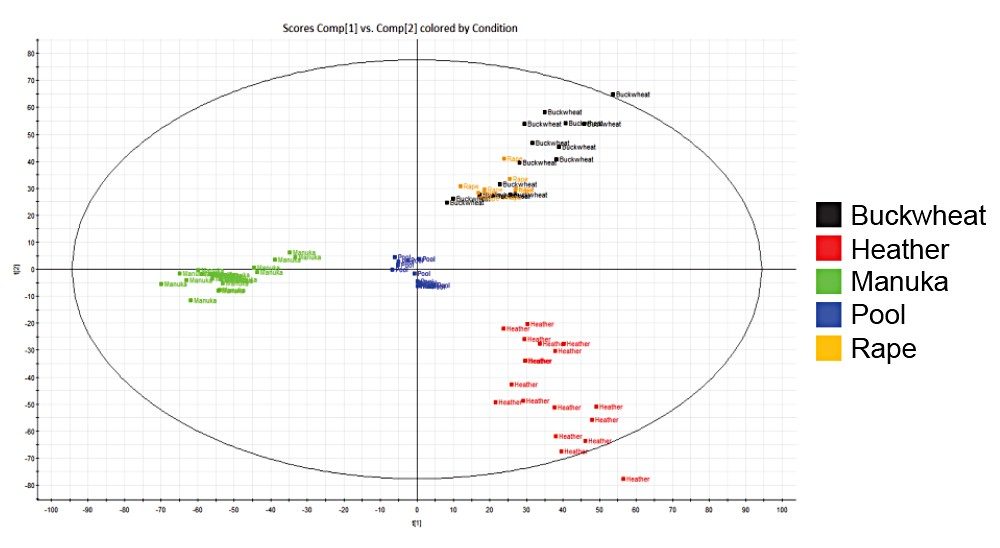
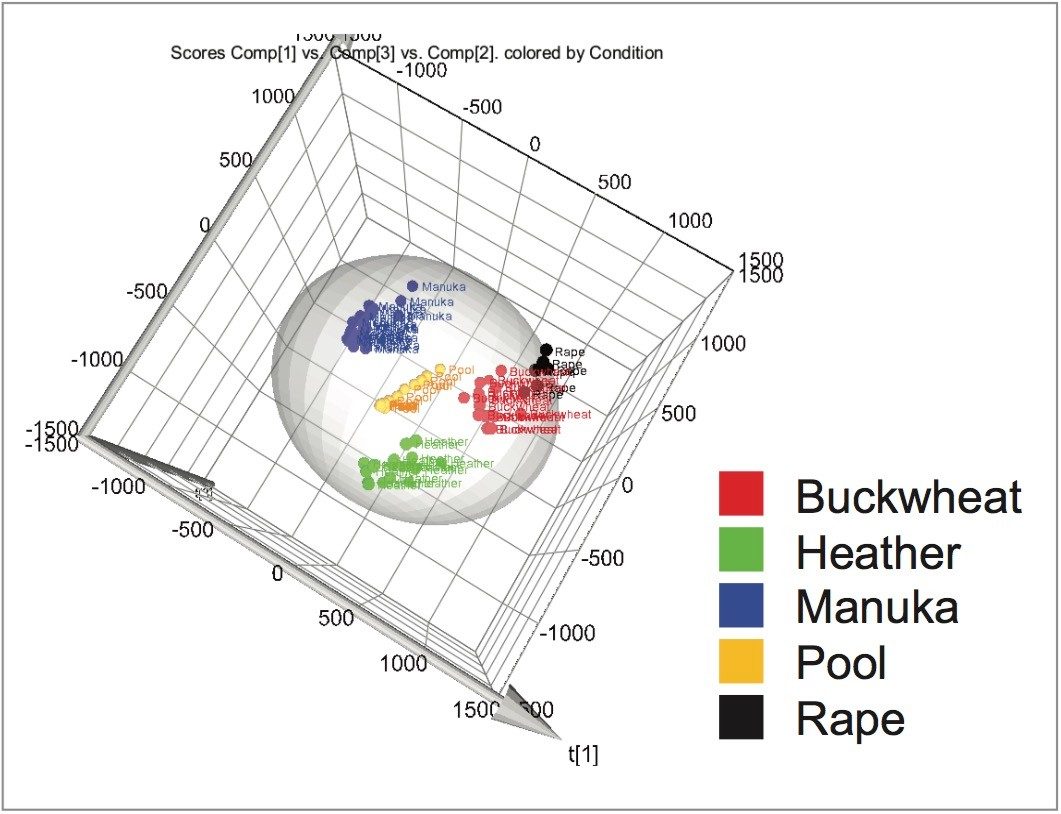
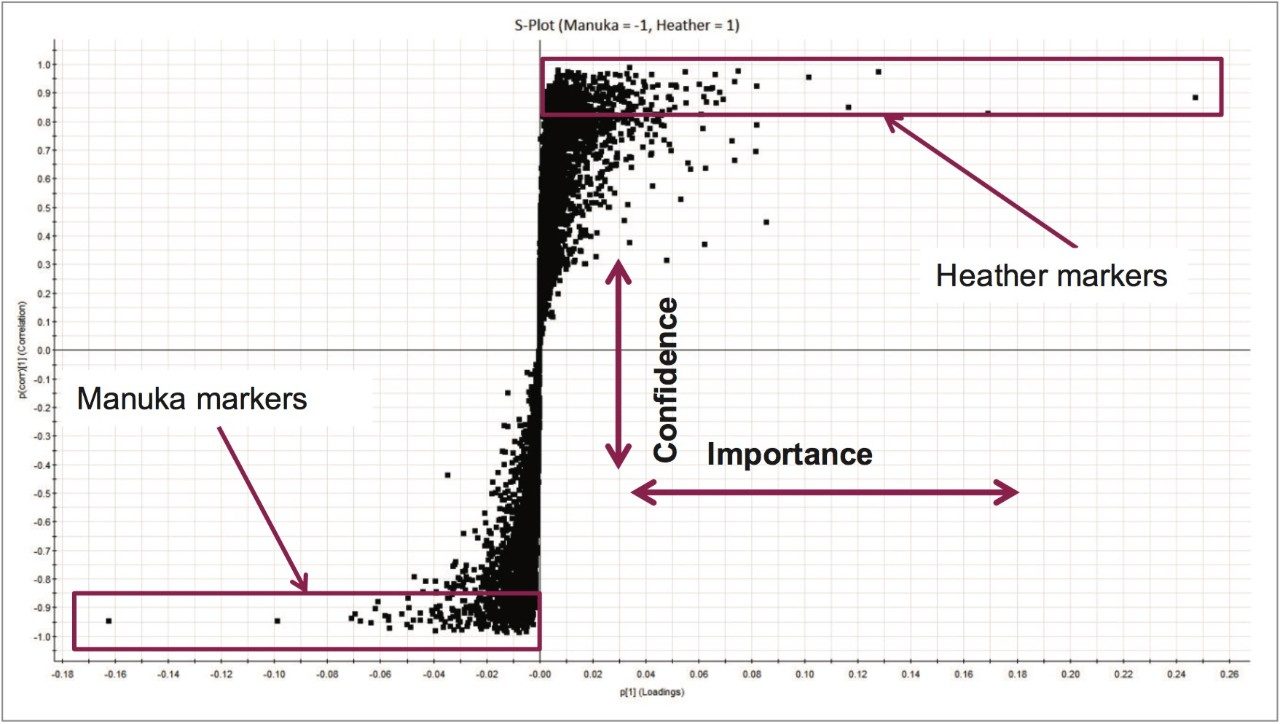
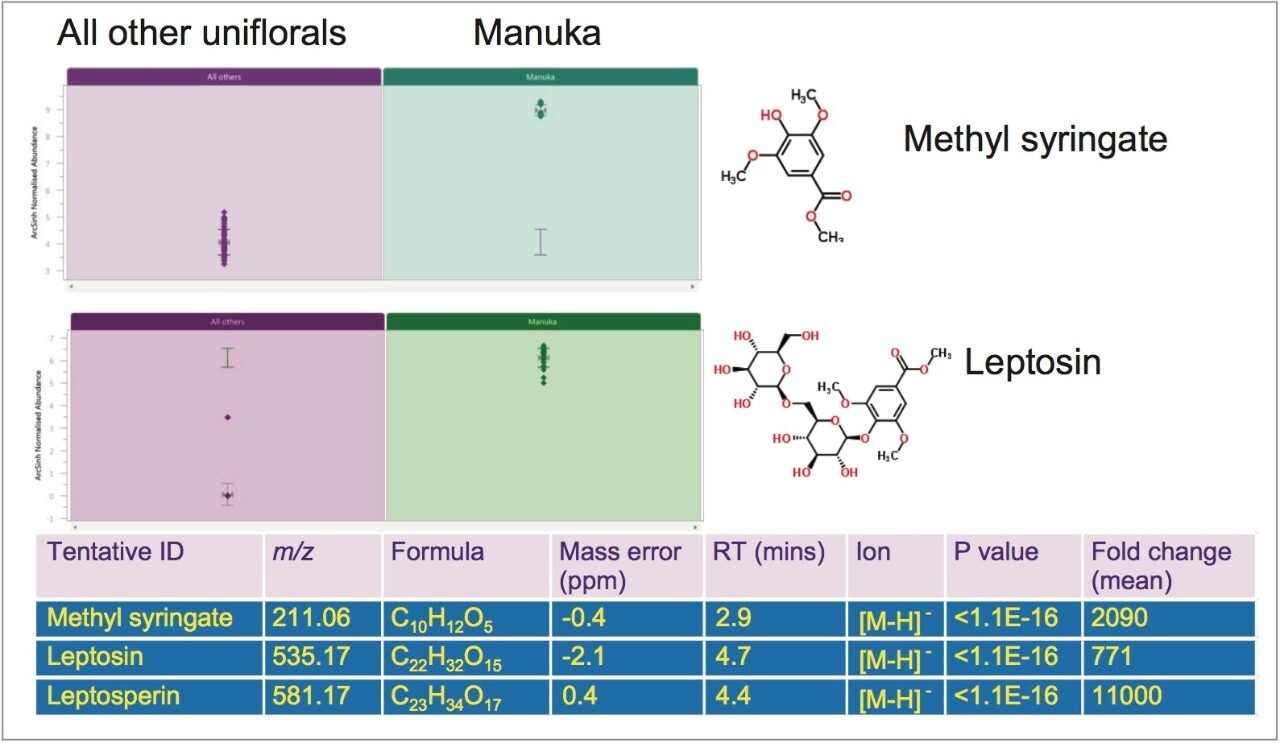
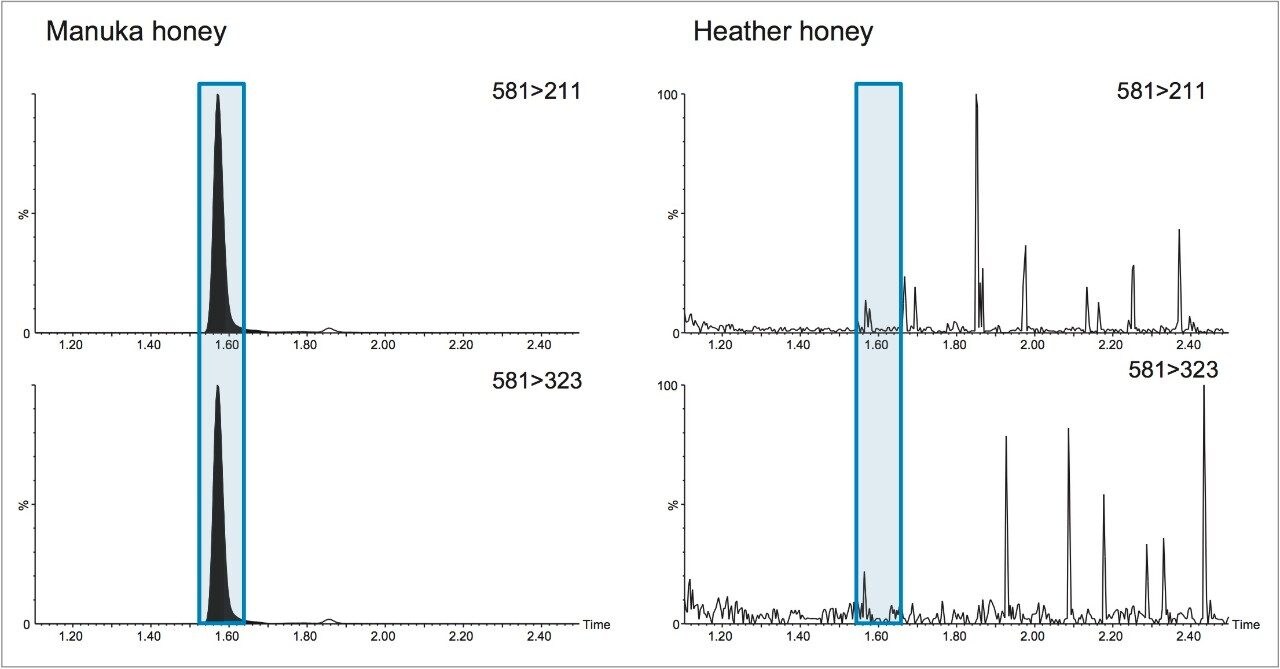
In this study we investigated whether untargeted metabolomics, using Waters UltraPerformance Liquid Chromatography (UPLC) coupled with High Definition Mass Spectrometry (HDMS) and multivariate statistics, could differentiate honeys of different botanical origin. HDMS combines ion mobility spectrometry with high resolution mass spectrometry to allow researchers to analyze ions differentiated by size, shape, and charge, as well as mass. The selection of markers of different botanical origin was verified using a targeted method based upon UPLC coupled with tandem quadrupole (TQ) mass spectrometry.

Experimental

Authentic samples of rape (3), heather (9), buckwheat (5), and Manuka (8) unifloral honeys were obtained from indisputable sources. Each floral class contained separate samples from different countries (Norway, Denmark, Lithuania, Poland, and New Zealand) and different years of collection giving multiple biological replicates per floral class. Honey samples were subjected to minimal sample preparation: honey (0.5 g) was diluted (10 mL methanol/1% formic acid in water, 50:50 v/v), shaken, sonicated (20 min) and centrifuged. Samples were analyzed in a randomized order including interspersed pooled honey samples for QC purposes.

Part 1: UPLC-HDMS

Samples were analyzed in triplicate by HDMSE acquisition on a SYNAPT G2-Si Mass Spectrometer using electrospray in positive and negative ion modes. HDMSE data independent analysis provides accurate mass measurements of all detectable ions; both precursors and fragments. Chromatographic and drift time alignment of precursor and fragment ion data aids assignment of fragment ions to parent ions of similar mass or retention time.

UPLC conditions

UPLC system:

ACQUITY UPLC I-Class with FTN autosampler

Column:

ACQUITY UPLC BEH C18, 1.7 μm, 2.1 × 100 mm

Mobile phase A:

10 mM Ammonium acetate (aq.)

Mobile phase B:

Acetonitrile

Flow rate:

0.5 mL/min

Injection volume:

5 and 9 μL

Column temp.:

45 °C

Sample temp.:

5 °C

Run time:

12 min

Gradient

Time(min)

%A

%B

Curve

0.00

99

1

-

0.75

99

1

6

2.00

95

5

6

3.00

95

5

6

6.50

45

55

6

8.50

10

90

6

9.00

10

90

6

9.10

99

1

6

MS conditions

MS system:

SYNAPT G2-Si HDMS

Acquisition mode:

ESI+, ESI-; resolution mode; HDMSE

Acquisition mass range:

50 to 1200 m/z

Scan time:

0.1 s

Lockmass:

m/z 556.2766 (Leucine enkephalin)

Collision energy ramp:

15 to 55 eV

Capillary voltage:

3.1 kV

Desolvation temp.:

600 °C

Desolvation gas flow:

800 L/Hr

Source temp.:

130 °C

Cone voltage:

30 V

Cone gas flow:

35 L/Hr

Nebulizer gas pressure:

5 Bar

Drift gas:

N2

IMS wave velocity range:

650 m/s

IMS wave height:

40 V+

IMS gas flow:

90 mL/min

Acquisition software:

MassLynx v4.1

Bioinformatics software:

Progenesis QI (2.2) with EZinfo (MKS Data Analytics Solutions, Sweden)and access to various databases: HMDB, Metlin, and MassBank

Part 2: UPLC-MS/MS

UPLC conditions

UPLC system:

ACQUITY UPLC I-Class with FTN autosampler

Column:

ACQUITY UPLC CSH Phenylhexyl 1.7 μm, 2.1×100 mm

Mobile phase A:

0.1 % formic acid (aq.)

Mobile phase B:

acetonitrile

Flow rate:

0.4 mL/min

Injection volume:

5 μL

Column temp.:

40 °C

Sample temp.:

15 °C

Run time:

9 min

Time(min)

%A

%B

Curve

0.00

90

10

-

3.00

60

40

6

5.00

10

90

6

7.00

10

90

6

7.10

90

10

6

MS conditions

MS system:

Xevo TQ-S

Acquisition mode:

ESI+

Capillary voltage:

2.0 kV

Desolvation temp.:

500 °C

Desolvation gas flow:

1000 L/Hr

Source temp.:

150 °C

Cone gas flow:

150 L/Hr

Collision gas flow:

0.15 mL/min

Nebuliser gas pressure:

7 Bar

MRM transitions for leptosperin:

581>211 and 581>323[from Kato et al. (2014)]

Cone voltage:

34 V

Collision energy:

16 and 22eV, respectively (optimized using a Manuka honey sample)

Dwell times:

35 ms

Acquisition software:

MassLynx v.4.1

Processing software:

TargetLynx XS Application Manager

Results and Discussion

PART 1: UPLC-HDMS

Although the base peak intensity chromatogram (BPI) chromatogram of the pooled QC honey sample from the negative ion, low energy, HDMSE experiment (Figure 1) shows a number of peaks, it fails to illustrate the complexity of the honey sample extracts. The inset shows the co-elution of numerous metabolites, which hinders their identification. A more in-depth assessment of the data is required.

Figure 1. Typical base peak intensity (BPI) chromatogram from the analysis of the pooled QC honey sample by UPLC-MS (ESI negative ion, low energy, HDMSE data) and the 3D view of a subset of the data.

The two data sets acquired in ESI positive and in ESI negative modes were imported into Progenesis QI Data Analysis Software to search for and identify unique markers of botanical origin. With this software, significant differences between different unifloral honeys were observed by comparing multiple samples, employing a user-friendly workflow approach.

After alignment, peak detection and deconvolution in Progenesis QI, principal component analysis (PCA) was used for initial exploration of the 9000 compounds extracted from the ESI negative ion HDMSE data in order to determine whether there were any outliers in the data, and also see how well the samples were grouped. No attempt is made to apply any classification of the data into different unifloral honeys at this point; PCA enables variances within the dataset to be assessed to see whether sample-to- sample variation is higher than any differences between the classes. After export into EZInfo, PCA was carried out after Pareto scaling. Scaling means shrinking or stretching variance of individual variables to ensure the score values are not so small compared to the loadings that they are not visible in a plot. Pareto scaling is commonly used to reduce the influence of intense peaks while emphasizing weaker peaks that may have more significance. The corresponding loadings of intense signals will be reduced and loadings from weak signals will be increased due to Pareto scaling. The PCA scores plot generated in EZInfo from the ESI negative ion HDMSE data for unifloral honeys showed separation into distinctive clusters of pooled QC, buckwheat, heather, rape, and Manuka (Figure 2). All pooled QC samples were found to be tightly located within the center of the PCA scores plot which indicates good reproducibility of the method and the absence of any bias introduced during the processing of the data.

Figure 2. Principal component analysis (PCA) scores plot from EZInfo (ESI negative ion HDMSE data).

In order to help better understand the separation between types of unifloral honey and to identify potential characteristic markers for each unifloral honey, supervised multivariate analysis was performed using orthogonal projection to latent structures discriminant analysis (OPLS-DA). OPLS-DA is a supervised technique where the compound ions are classified into the available groups using regression and prediction methods. The advantage of OPLS-DA is that it shows which variables responsible for class discrimination and so is easier to interpret the results. The OPLS-DA scores plots generated from the ESI negative ion HDMSE data for the unifloral honeys (Figure 3) shows the classification of the compound ions into the honey groups; pooled QC, buckwheat, heather, rape, and Manuka.

Figure 3. OPLS-DA scores plot from EZInfo (ESI negative ion HDMSE data).

An S-plot can also be created, as shown in Figure 4, to quickly highlight those features responsible for the difference between pairs of unifloral honeys with the highest confidence and contribution (area highlighted by red line in Figure 4). Selected features from the S-plot can then be imported back into Progenesis QI and tagged, allowing them to be filtered and viewed independently. Figure 4 shows the S-plot for Manuka and heather honeys from the ESI negative ion HDMSE data. It is also possible to compare a group of interest (e.g. Manuka) with all other honey samples by creating a new group of all other unifloral honeys. The most significant markers from the S-plot were tagged and the data imported data back into Progenesis QI for verification and further evaluation (e.g. identification).

Figure 4. S-plot from EZInfo showing a comparison of Manuka and heather honeys (ESI negative ion HDMSE data).

After importing the data for the tagged markers from EZinfo back into Progenesis QI, the data was filtered to verify the selection of markers prior to their identification. Markers were selected for further investigation that showed a significant difference (Anova p-value <0.0001) and a 5 fold or greater increase in abundance for one of the types of unifloral honeys. Using the Progenesis QI search engine, Progenesis MetaScope, queries were made of publicly available databases (Figure 5).

Figure 5. An example of a tentative identification of a marker compound from the database search.

Search parameters were customized to maximize all aspects of the data acquired to the database being searched. Possible identifications for each marker were ranked on an overall score based on: mass error, isotope similarity (calculated from the comparison of the measured isotope distribution for the compound versus the theoretical based on the compound formula), and fragmentation score. To improve confidence in the compound identification, theoretical fragmentation of the candidate list of compounds was performed, and the resulting in silico fragmentation matched against the measured/observed fragments for a compound. High spectral specificity (spectral cleanup) was observed due to the ability of the data analysis software to time align and drift align spectra from the four dimensional HDMSE data.

Some of the metabolites identified were highlighted as being able to differentiate the Manuka honey samples, which have been reported as Manuka markers previously.10 The standardized abundance profiles for three of these marker compounds are represented graphically in Figure 6. This provides information about how the compound abundances are changing across the different types of unifloral honey and information about the reliability of the changes seen. Identifications assigned, along with statistical values, are shown in the accompanying table.

Figure 6. Review of standardized abundance profiles and assignment of identity for three markers of Manuka honey as displayed in Progenesis QI Software.

PART 2: UPLC-MS/MS

Independent verification of one of the markers of Manuka honey, leptosperin, which was identified from the UPLC-HDMS data, was afforded by targeted UPLC-MS/MS in MRM mode. Figure 7 shows MRM chromatograms illustrating the detection of leptosperin in a sample of Manuka honey that is absent from the sample of heather honey.

Figure 7. MRM chromatograms from the determination of leptosperin in samples of Manuka and heather honeys.

Conclusion

The metabolomics workflow is emerging as a powerful approach for the discovery of biomarkers to tackle food fraud. UPLC provides high efficiency separations and comprehensive, unbiased HDMSE acquisition provides information-rich data including accurate mass and isotope distribution for precursor and fragment ions. The addition of ion mobility offers increased peak capacity, separation of isomers and spectral cleanup. The Progenesis QI workflow provides an easy-to-use, scalable system for analysis of food metabolomic data including accurate peak alignment and peak picking, classification of samples using multivariate statistical analysis, quantification of relative abundance of markers for each class and identification of markers from database searches supported by structural elucidation tools.

References

  1. Spink and Moyer. Defining the public health threat of food fraud. J Food Sci. 76 (9): R157–R163, 2011.
  2. https://ec.europa.eu/food/sites/food/files/safety/docs/official-controls_food-fraud_honey_controlplan-results.pdf
  3. Pita-Calvo et al. Analytical methods used in the quality control of honey. J Agric. Food Chem. 65: 690−703, 2017.
  4. https://www.mpi.govt.nz/growing-and-producing/bees-and-other-insects/manuka-honey/
  5. Spiteri et al. Combination of 1H NMR and chemometrics to discriminate manuka honey from other floral honey types from Oceania. Food Chem. 217: 766–772, 2017.
  6. Jandric et al. Assessment of fruit juice authenticity using UPLC–QToF MS: A metabolomics approach. Food Chem. 148: 7–17, 2014.
  7. Dai et al. Nontargeted analysis using ultraperformance liquid chromatographyquadrupole time-of-flight mass spectrometry uncovers the effects of harvest season on the metabolites and taste quality of tea (Camellia sinensis L.). J Agric. Food Chem. 63: 9869–9878, 2015.
  8. Black et al. A comprehensive strategy to detect the fraudulent adulteration of herbs: The oregano approach. Food Chem. 210: 551–557, 2016.
  9. Jandric et al. An investigative study on discrimination of honey of various floral and geographical origins using UPLC-QToF MS and multivariate data analysis. Food Control. 72: 189–97, 2017.
  10. Kato Y et al. (2014). Plausible authentication of manuka honey and related products by measuring leptosperin with methyl syringate. J Agric. Food Chem. 62(27): 6400–7, 2014.

Acknowledgements

Waters kindly acknowledges Fera Science Ltd for analysis on the Xevo TQ-S.

720005963, April 2017

Back To Top Back To Top