The comprehensive characterization of biopolymers as drug candidates is a requirement for safety and regulatory agencies. Challenges include the high molecular weight of biopolymers and the heterogeneous nature of protein drugs, which require extensive characterization to achieve regulatory approval. Comparability during manufacturing changes must be demonstrated, or to provide intellectual property (IP) protection against biosimilars. The analyses described here show how different analyses can be performed to provide comprehensive information more quickly to meet these business objectives. All of these analyses can be done by non-specialists on the same platform.
The combination of liquid chromatography and electrospray mass spectrometry (LC-MS) provides enabling technology for well-characterized and comparable biotherapeutics. LC-MS analysis of proteins and peptides provides high levels of detail to aid characterization. However, the ability to routinely generate and interpret LC-MS data in a timely manner has been challenging in the past because involvement of an expert was required. Additionally, a major hindrance has been, until now, the lack of automated tools to complete the analysis. In order to increase laboratory productivity, high-performance mass spectrometers need to be made more accessible.
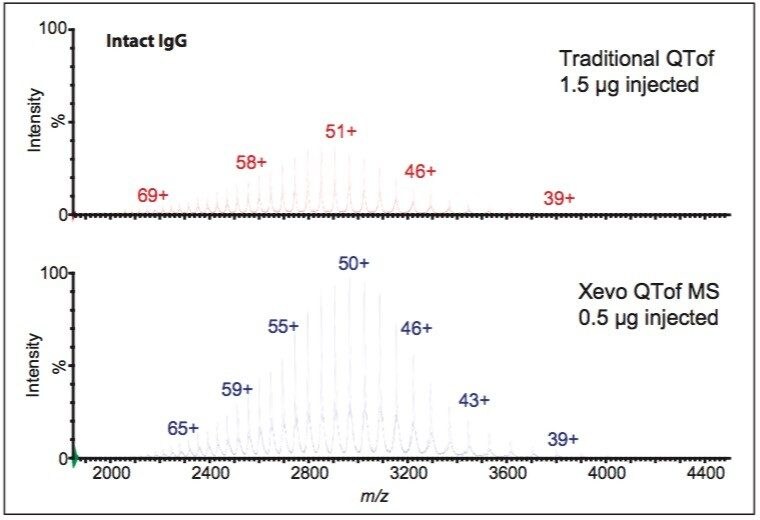
The Waters Xevo QTof MS System is a benchtop instrument designed to provide organizations with easy access to the most sensitive, high-performance, accurate mass MS, MSE, and MS/MS analysis available. The system incorporates Waters’ design philosophy of Engineered Simplicity and features tools for automated calibration and system monitoring, allowing organizations to obtain the very best MS performance in routine analyses.
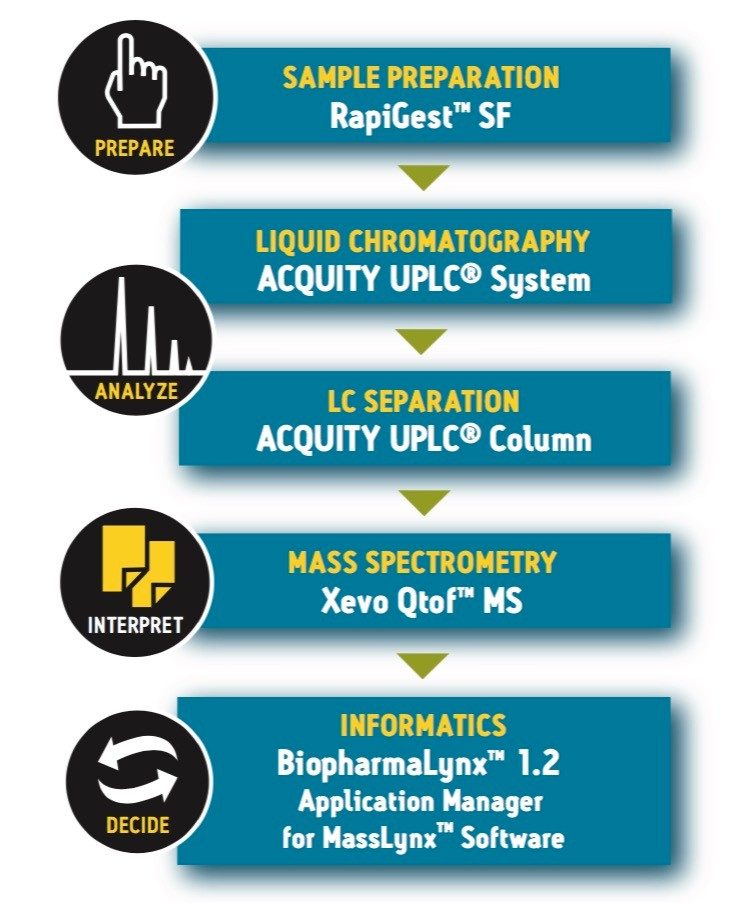
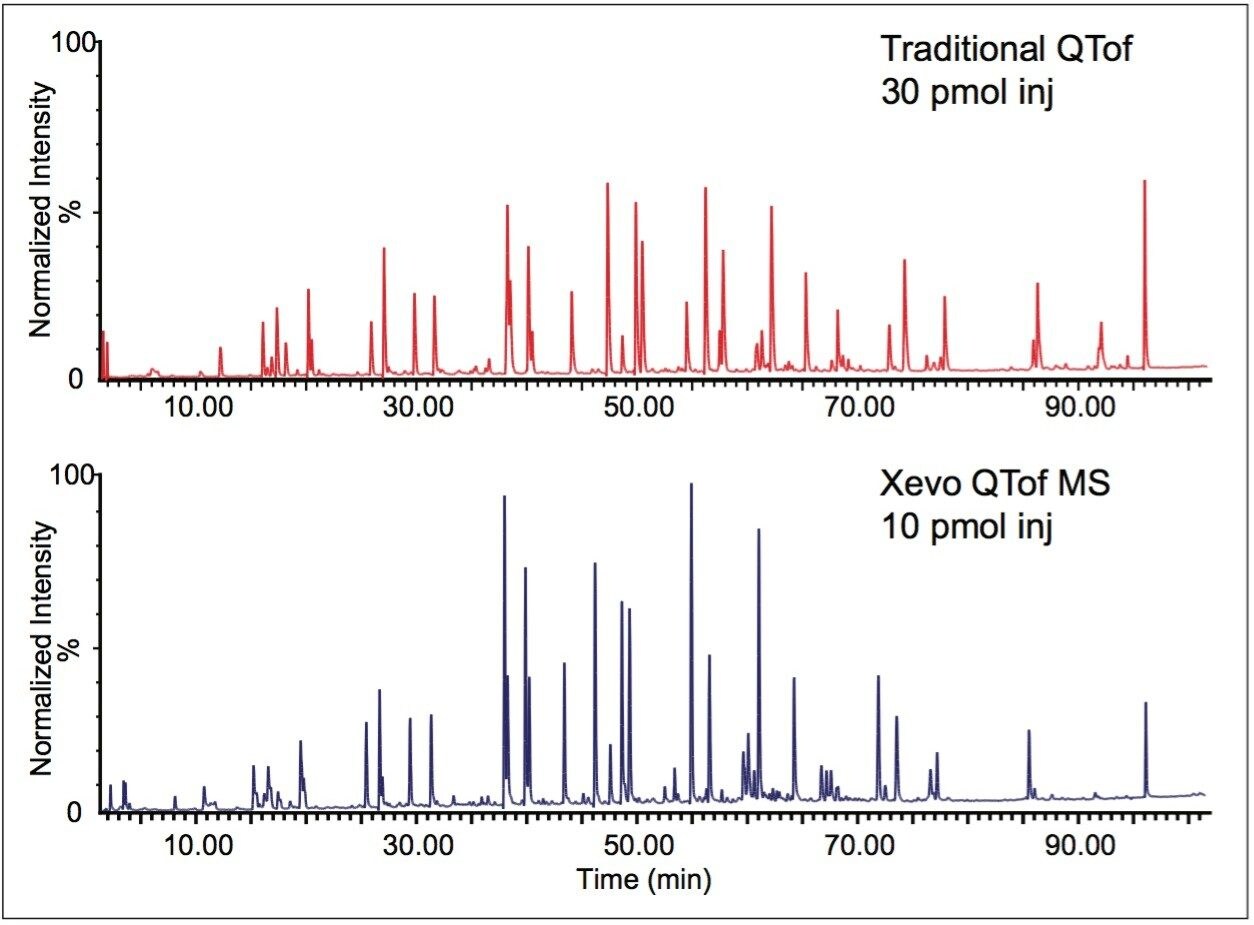
This application note focuses on intact protein measurement and peptide mapping for biotherapeutics. We demonstrate a system solution that integrates ACQUITY UPLC separations, application-specific column chemistries, Xevo QTof MS mass detection, and industry-leading biopharmaceutical informatics to deliver improvements in laboratory productivity. Tasks that took two weeks to complete, such as peptide mapping, can now be accomplished in a day.
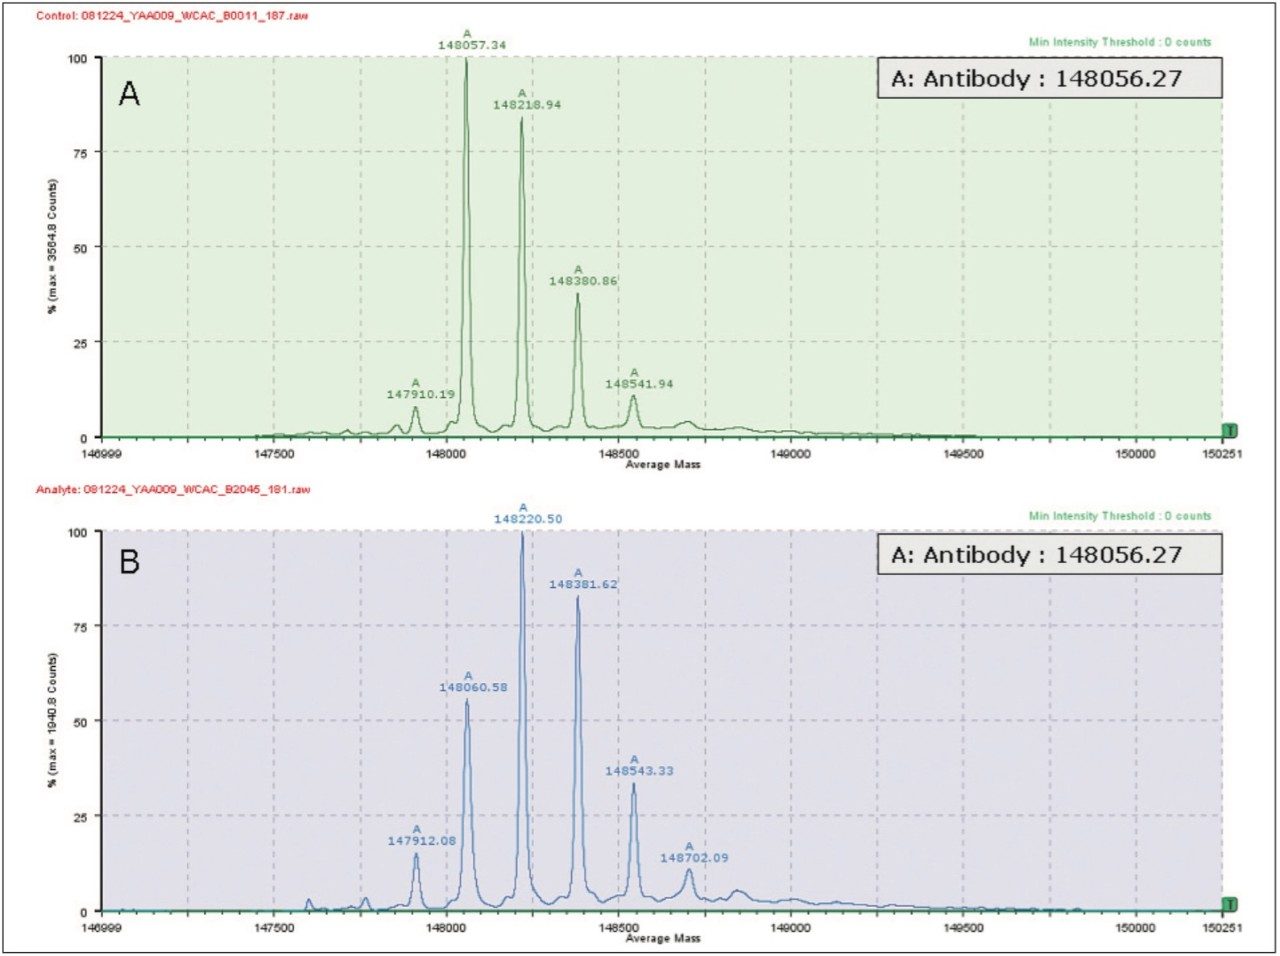
There are good reasons to determine the intact mass of a monoclonal antibody (mAb): in addition to providing an accurate mass of the protein, intact mass analysis provides an overall view of the heterogeneity of the protein, showing relative amounts of the various forms. Minimal sample preparation and chromatographic separation is required, so intact mass analysis provides results in minutes. Furthermore, generic methods can be used for rapid analysis of many different sample types.
In an organization where there is a large increase in the number of biopharmaceutical candidates advancing through the pipeline, such an approach provides results rapidly without having to request additional headcount.
For example, if there is a need to quickly confirm that the correct protein has been made, samples may be submitted to the analytical characterization group by biochemists or biologists who are not experts in mass spectrometry. An accurate molecular weight of the protein would ensure that the overall mass matches the expected mass. Without this confirmation, the wrong protein may be tested in several expensive bioassays, increasing time and costs for the organization.