• Nota de aplicación

Advances in Size Exclusion Chromatography for the Analysis of Macromolecular Proteins

Advances in Size Exclusion Chromatography for the Analysis of Macromolecular Proteins

  • Stephan M. Koza
  • Kenneth J. Fountain
  • Waters Corporation

Abstract

This application note highlights the performance characteristics of sub-3-μm 450 Å BEH SE-UPLC column with respect to column-to-column reproducibility and column stability. By combining 450 Å sub-3-μm packing materials with a low dispersion ACQUITY UPLC H-Class System, separations with improved resolution and highthroughput of SE-UPLC can be realized for macromolecular proteins and highly aggregated proteins with molecular weights of up to approximately 2000 KDa.

Benefits

  • Improved resolution of macromolecular proteins by SE-UPLC
  • Outstanding column stability and reliable column-to-column reproducibility
  • Increased size separation range when the new 450 Å BEH450 SEC, 2.5 μm column is used in series with the Waters ACQUITY UPLC BEH200, 1.7 μm, SEC column

Introduction

The separation of macromolecular proteins by size-exclusion chromatography has been an area of significant interest since the introduction of cross linked dextran based soft-gels by Porath and Flodin in 1959.1 This mode of separation was further improved by the introduction of particles comprised of cross-linked polystyrene (µ-Styragel) and ultimately porous-silica particles. With that perspective, the newly introduced sub-3-µm 450 Å BEH SE-UPLC particle presented in this note represents the latest step in the technological evolution of the size-based separation of biological macromolecules. This note will highlight the performance characteristics of this column with respect to column-to-column reproducibility and column stability. Additionally, the distinct advantages that sub-3-µm packing material offers over a larger (8-µm) particle size for the separation of large proteins will also be shown. Finally, we will demonstrate where the size-separation range of this 450 Å pore-size SE-UPLC column complements that of the 200 Å ACQUITY BEH200 SEC column and how the two columns can be used together to increase the molecular weight range of a protein separa

Experimental

Sample Description

All samples were diluted in mobile phase unless otherwise noted. Proteins were purchased as individual standards or as mixtures (Waters and Sigma-Aldrich). Sample concentrations were 1.0 mg/mL (nominal) unless noted otherwise.

Method conditions (unless noted otherwise)

LC conditions

System:

Waters ACQUITY UPLC H-Class Bio System with 30-cm Column Heater

Detection:

ACQUITY UPLC TUV with 5-mm titanium flow cell Wyatt miniDAWN TREOS light scattering detector

Wavelength:

280 or 214 nm

Columns:

Waters ACQUITY UPLC BEH450 SEC Column, 450 Å, 2.5 μm, 4.6 x 150 mm (p/n 176002996) and 4.6 x 300 mm (p/n 176002997) Waters ACQUITY UPLC BEH200 SEC Column, 200 Å, 1.7 μm, 4.6 x 150 mm (p/n 186005225) and 4.6 x 300 mm (p/n 186005226)

HPLC Column:

450 Å, 8 μm, 7.8 x 300 mm

Column temp.:

Ambient

Sample temp.:

10 °C

Injection volume:

5 μL

Flow rate:

0.35 mL/min

Mobile phases:

25 mM sodium phosphate, 250 mm sodium chloride, pH 6.8 (prepared using Auto•Blend Plus Technology)

Gradient:

Isocratic

Standard:

BEH450 SEC Protein Standard Mix (p/n 186006842)

Sample vials:

Deactivated Clear Glass 12 x 32 mm Screw Neck Total Recovery Vial, with Cap and Preslit PTFE/Silicone Septa, 1 mL (p/n 186000385DV)

Data management

Chromatography software:

Waters Empower Pro (v2, FR 5)

Waters UNIFI (v1.6)

Wyatt Astra (v5.3.4.16)

Results and Discussion

ACQUITY UPLC BEH450 column reproducibility and stability

In addition to analyte resolution and sensitivity, the two major concerns that an analyst has when selecting an SEC column for method development are column to-column reproducibility and column lifetime. An overlay of the chromatograms for a series of molecular weight standards is shown in Figure 1. These chromatograms demonstrate the reproducibility of five 300-mm length ACQUITY BEH450 SEC columns packed from three different production lots of packing material. For these standards at a flow rate of 0.35 mL/min, the retention time standard deviation ranged from a minimum of 0.005 min for the earliest eluting component (IgM pentadimer) to 0.022 min for the total permeation component (uracil) with an average standard deviation of 0.017 min for all components labeled in Figure 1.

The stability of the ACQUITY BEH450 SEC column (300 m) was evaluated by injecting a series of standards over the course of over 800 total injections. The retention time stability for the largest protein evaluated in this study (thyroglobulin), which is used to probe the chemical stability of the particle surface, is shown in Figure 2. The peak asymmetry of the uracil standard is also shown in Figure 2. This compound, which elutes in the total permeation volume, is used to test the mechanical integrity of the column. These data demonstrate that the ACQUITY BEH450 SEC column can provide the reproducibility and stability needed to develop reliable assays for use in a quality control environment.

Effect of particle size

The benefits of smaller particles for size-exclusion chromatography have been well documented with improvements in efficiency and resolution.4 A set of proteins was analyzed individually on a 450 Å pore-size UPLC-based BEH SEC column (2.5 μm) and a 450 Å pore-size HPLC-based silica SEC column (8 μm) using the same ACQUITY UPLC H-Class Bio System and aqueous mobile phase  conditions, shown in Figure 3. The flow rates and injection volumes used were proportional to the size of the column tested. Improved sensitivity and narrower peak widths were observed on the 2.5 μm packing material across the separation range. USP resolution values (half-height measurement) calculated for the separation between the apoferritin monomer (MW=443 KDa) and dimer (MW=886 KDa) forms, shown in Figure 4, were base-line resolved with a resolution of 2.49. This resolution is 1.8 times greater than that observed using the 8-μm particle-sized column (Rs=1.42).

Expanding molecular weight range: combination with ACQUITY BEH200 SEC (200 Å)

Comparisons were made between the 450 Å and 200 Å pore-size particles for the separation of proteins. Additionally, both columns used in the series were evaluated. The comparison of the separation achieved on the 200 Å and 450 Å SE-UPLC columns (300-mm length) and the 150-mm length version of both columns connected in series (BEH200 followed by BEH450) for the Waters BEH200 SEC Protein Standard Mix (p/n 186006518) is shown in Figure 5. For this standard mix, it is clear that the resolution of the separation for the standard components with molecular weights up to that of the IgG standard (150 KDa) is  higher with the 200 Å column as noted by the separation between IgG and BSA (66 KDa). For higher molecular weight components like thyroglobulin (667 KDa) and its dimeric form (1340 KDa or IgM pentamer (900 KDa) and IgM dipentamer (1800 KDa), however, the 450 Å can provide improved separations, as shown in Figure 4. This higher molecular weight range may be of use when analyzing multimeric protein aggregates or proteins conjugated to compounds that have relatively large Rh values, such as long chain polyethylene glycols.

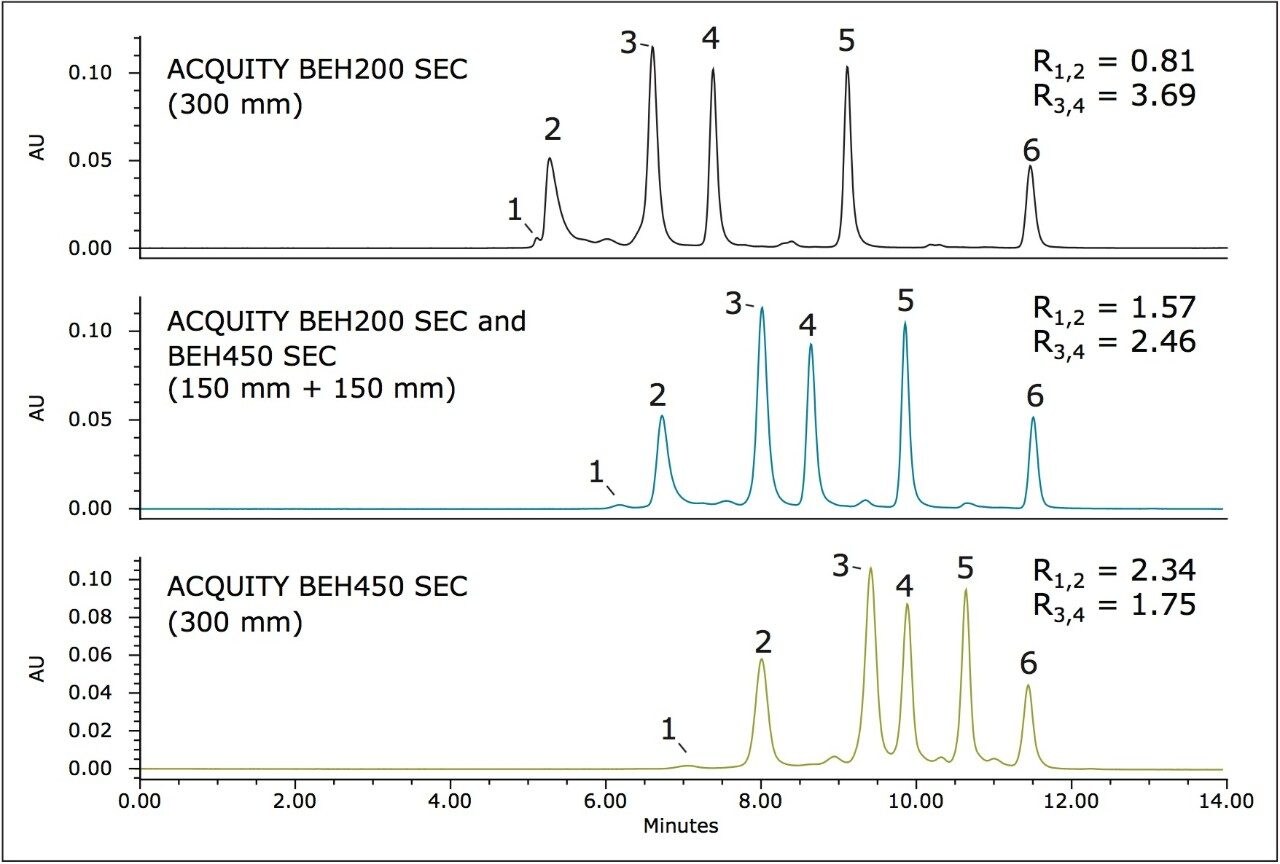
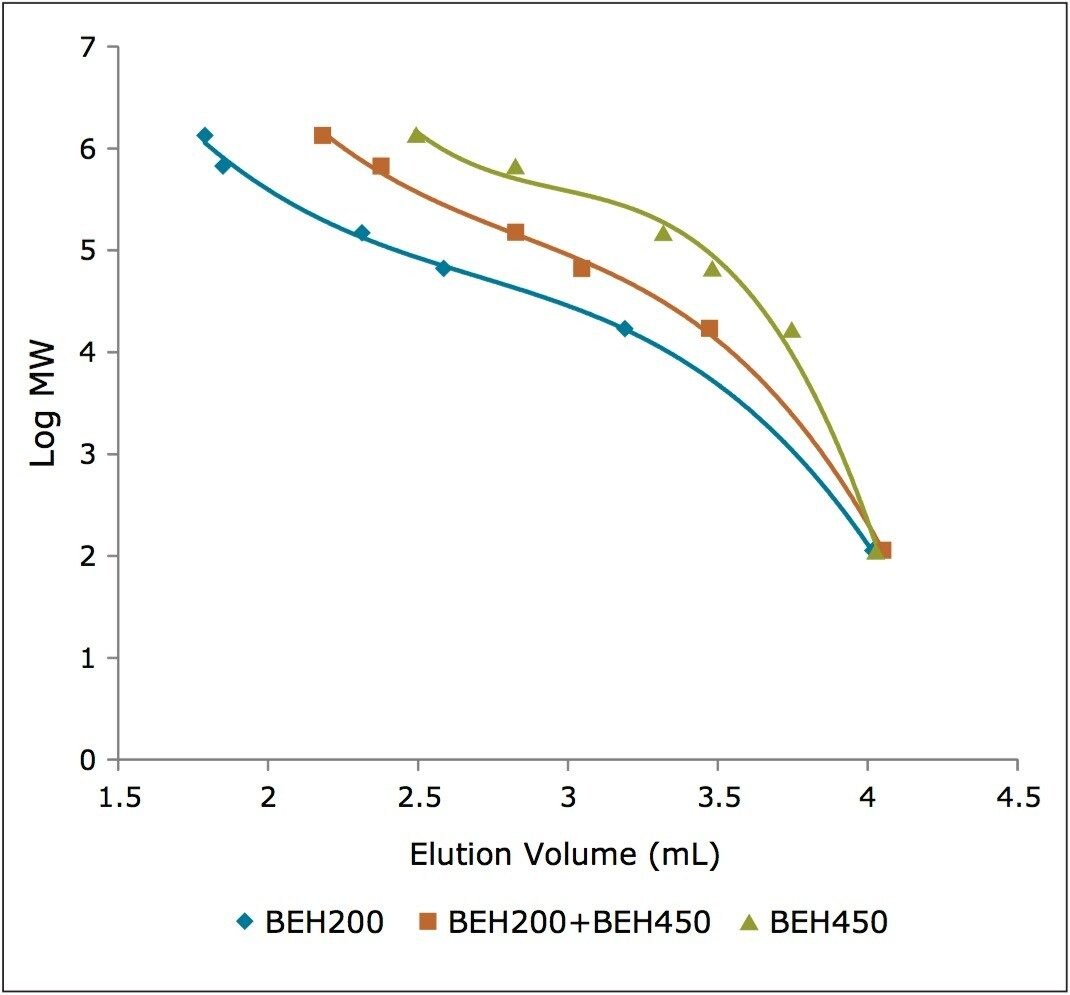
A third option available to the analyst in need of analyzing a sample containing both low molecular weight and multimeric high molecular weight forms in a sample, is to use the two columns in series. As the back pressure generated by the 200 Å column is greater than that of the 450 Å column due to the smaller particle size of 200 Å column, the 200 Å column was placed first in the series for this study. The result of this two-column configuration is shown in the center panel of Figure 5. By using both columns, the functional upper molecular weight range of the separation is increased as noted by the improved separation of thyroglobulin and its dimer compared to that same separation using the 200 Å column alone. Additionally, for the lower molecular weight forms, there is an improvement in resolution compared to the use of the 450 Å column alone, as evidenced by the improved separation between IgG and BSA. These observations can be confirmed by evaluating the elution volumes of these components in the calibration curves generated from these data, as shown in Figure 6. The calibration curve for the ACQUITY UPLC BEH200 SEC column showed greater linearity, and elution volume differences up to at least the IgG (150 KDa) standard compared to the ACQUITY UPLC BEH450 SEC column. Conversely, using the same criteria, the BEH450 column is better suited for proteins with a molecular weight of near that of thyroglobulin (667 KDa) andgreater. The BEH200 and BEH450 columns in series produced an intermediate calibration curve with the broadest pseudo-linear range. The compromise of this two-column configuration is that the resolutions achieved for proteins within the optimal range of each individual column are diminished, however.

Conclusion

Size-exclusion chromatography has been the preferred method for the analyses of proteins based on size. By combining 450 Å sub-3-μm packing materials with a low dispersion ACQUITY UPLC H-Class System, separations with improved resolution and highthroughput of SE-UPLC can be realized for macromolecular proteins and highly aggregated proteins with molecular weights of up to approximately 2000 KDa. Additionally, the use of the BEH450 and BEH200 columns in series can provide a broader molecular weight range than can be obtained by using the columns individually. The ACQUITY UPLC BEH450, 2.5 μm SEC column in combination with the ACQUITY UPLC H-Class Bio System provides the following benefits:

  • Outstanding column-to-column reproducibility and stability
  • Nearly a two-fold increase in resolution compared to traditional SE-HPLC packing materials
  • Improved resolution for large proteins and aggregates with molecular weights above the linear separation range of the smaller pore-size SE-UPLC columns
  • Expanded molecular weight range when used in series with a UPLC BEH200, 1.7 μm SEC column

References

  1. Porath J, Flodin P. Gel filtration: a method for desalting and group separation. Nature. 1959; 183:1657-9.
  2. Fountain KJ, Hong P, Serpa S, Bouvier ESP. Morrison D. Analysis of Biomolecules by Size-Exclusion UltraPerformance Liquid Chromatography. Waters Application Note WA64226. 2010 April.
  3. Hong P, Koza S, Fountain KJ. Advances in Size-Exclusion Chromatography for the Analysis of Small Proteins and Peptides: Evaluation of Calibration Curves for Molecular Weight Estimation Waters Application Note 720004412en. 2012 June.
  4. Hong P, Fountain KJ. Method Development for Size-Exclusion Chromatography of Monoclonal Antibodies and Higher Order Aggregates. Waters Application Note 720004076en. 2011 Oct.

720004618, February 2013

Volver arriba Volver arriba