• Nota de aplicación

Development of a Hybrid Immunoaffinity-LC-MS/MS Method for the Quantification of Active Biotherapeutics Targeting TNF-α in Serum

Development of a Hybrid Immunoaffinity-LC-MS/MS Method for the Quantification of Active Biotherapeutics Targeting TNF-α in Serum

  • Caitlin Dunning
  • Mary E. Lame
  • Waters Corporation

For research use only. Not for use in diagnostic procedures.

Abstract

This application note presents a highly sensitive and selective sample preparation strategy for the LC-MS/MS quantification of free/active biotherapeutic from human serum for the TNF-α targeting biotherapeutics: infliximab, adalimumab, and etanercept.

Benefits

  • High analytical sensitivity LC-MS/MS quantification of TNF-α targeting biotherapeutics
  • Speed and reproducibility of a generic kit-based approach for protein quantification
  • Xevo TQ-XS Mass Spectrometer for high sensitivity quantification
  • Achieving 10–50 ng/mL LLOQs from 2.5 μL human serum

Introduction

Tumor Necrosis Factor (TNF) is a vital protein that plays a key role in the regulation of immune response. Therefore, biotherapeutic TNF inhibitors have been used to great effect in the treatment of inflammation diseases such as Crohn’s disease, psoriasis, and rheumatoid arthritis (RA).1 Infliximab (REMICADE), Adalimumab (HUMIRA), and Etanercept (ENBREL) are three key protein therapeutics, monoclonal antibody or fusion proteins, targeting TNF with reported global sales of almost 30 billion collectively.2 With their broad applicability and impending patent expiry,3 development of bioanalytical methods to accurately measure these biotherapeutics in support of drug development activities is increasing.

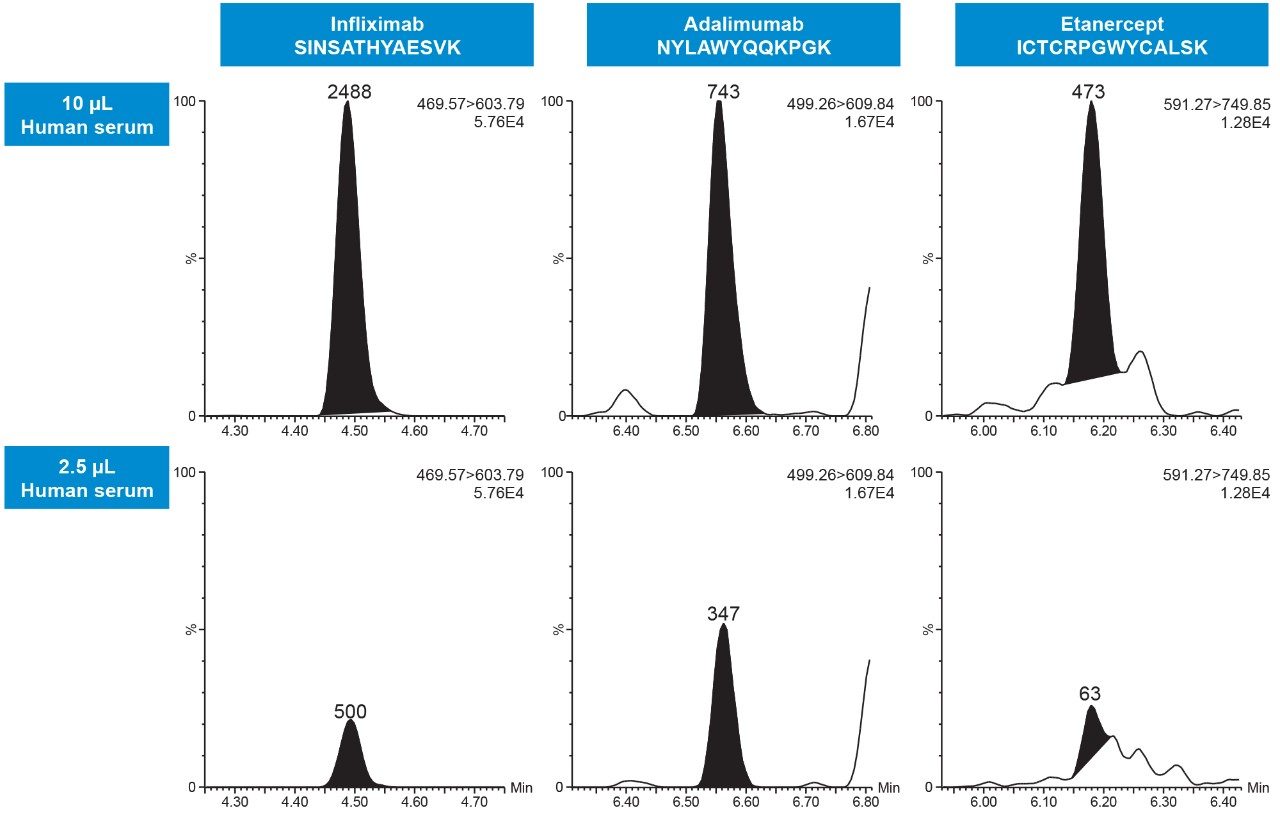
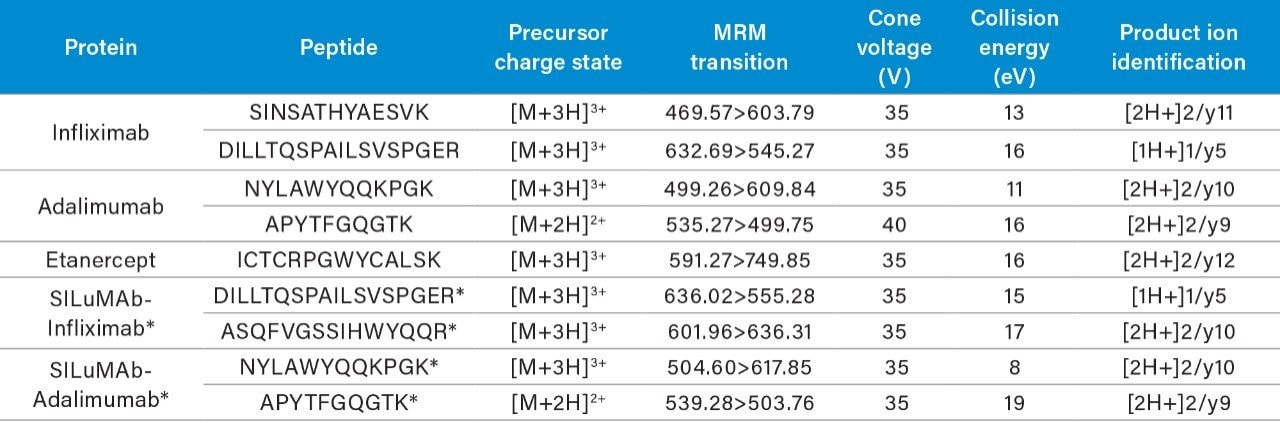
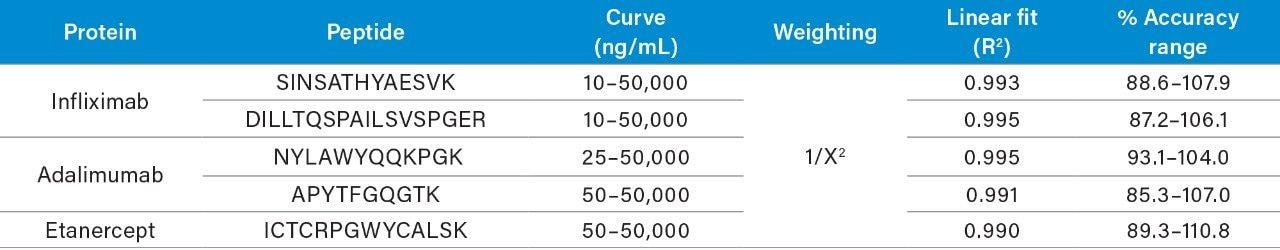
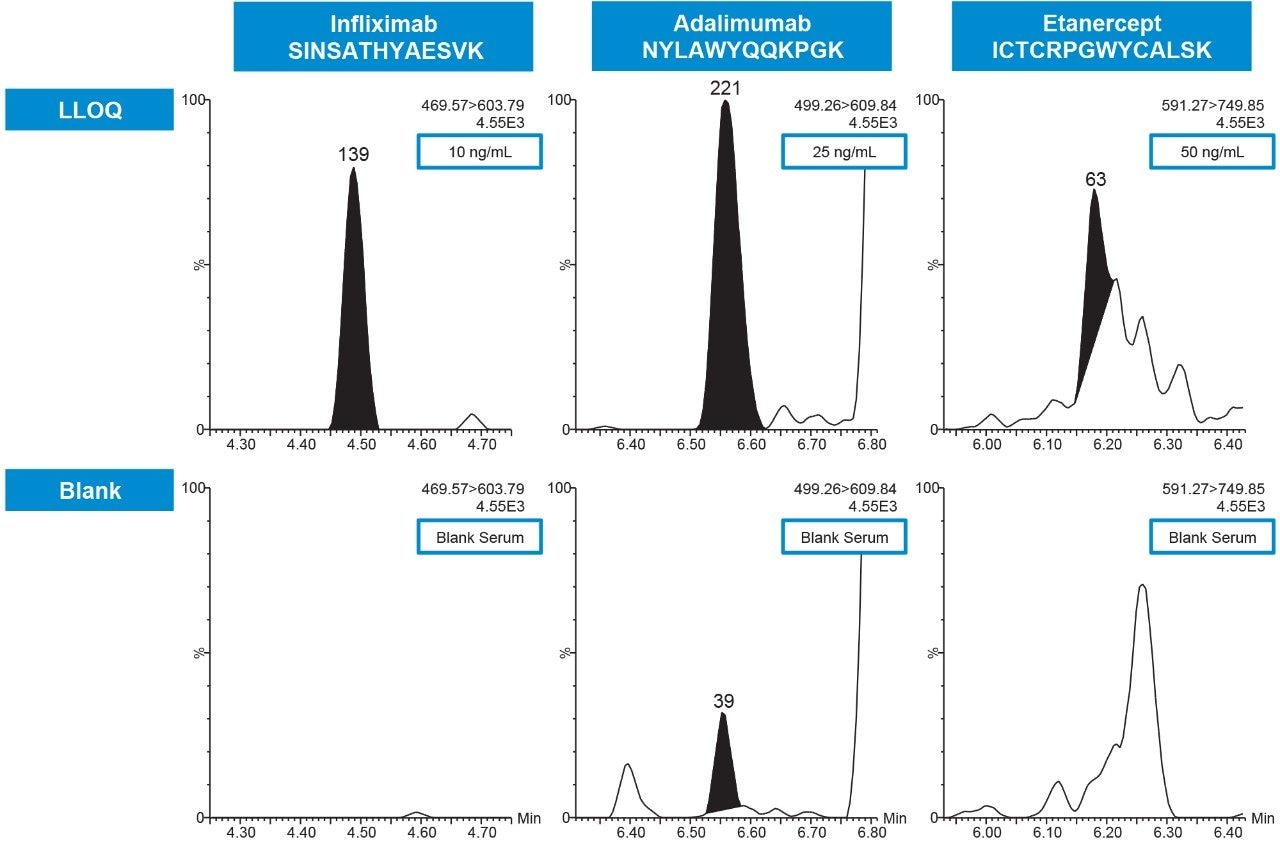
Biotherapeutics have traditionally been quantified via immunoaffinity methods such as ELISA, but these assays can suffer from cross-reactivity and a lack of specificity. However, when the immunoaffinity capture method is coupled to a high specificity detection method, such as LC-MS/MS, the sensitivity and selectivity of the assay can be greatly improved. The most common strategy to prepare proteins for quantitative MS analysis is the surrogate peptide or bottom-up approach, employing enzymatic digestion and subsequent analysis of the resulting peptides. The method described here uses specific immunoaffinity enrichment with target tumor necrosis factor-alpha (TNF-α) followed by a standardized, kit-based approach to protein digestion, and LC-MS/MS detection to quantify ‘free/active mAb’ from ≤10 μL of human serum, achieving lower limits of quantification (LLOQs) of 10–50 ng/mL.

Experimental

Sample preparation

Preparation of samples, calibration standards, and QC samples

Calibration curve standards and quality control (QC) samples of infliximab, adalimumab, and etanercept were prepared at various concentration levels (10–50,000 ng/mL) in commercially available human serum. Stable isotope labeled (15N13C) monoclonal antibodies, SILu MAb-Infliximab and SILuMAb-Adalimumab (Sigma P/Ns MSQC9 and MSQC11), were used as internal standards (ISTD). SILuMAb-Infliximab was used as the ISTD for infliximab and etanercept samples, while SILuMAb-Adalimumab was used for adalimumab samples. All calibration curve standards, QC levels, and blank (non-spiked) serum samples were prepared in triplicate. 

Immunopurification

Immunoaffinity extraction of the serum sample was performed with biotinylated TNF-α (b-TNF-α) bound to streptavidin coated magnetic beads (Promega Corporation P/N V7820). TNF-α was obtained from ProSpec (P/N CYT-223) and biotinylated using an EZ-Link Micro Sulfo-NHS-Biotinylation Kit and supplied protocol (Thermo Scientific P/N 21326). A 10-fold molar excess of NHS-Biotin was combined with TNF-α, diluted in 100 mM phosphate buffered saline, and mixed (1700 rpm) for 30 minutes at temperature. The resulting b-TNF-α was desalted using a Zeba Desalt spin column (Thermo Scientific) and then diluted to 13.6 μg/mL in Tris-buffered saline (TBS, 25 mM Tris, 150 mM NaCl, pH 7.2). 25 μL of bead slurry was aliquoted, washed, and equilibrated with TBS prior to overnight mixing (1200 rpm) with 100 μL of b-TNF-α at room temperature (30-fold molar excess TNF-α to infliximab/adalimumab). On the following day, beads were washed and equilibrated with TBS. Immunoaffinity capture of the free/active infliximab, adalimumab, and etanercept was performed by combining 2.5 μL of the human serum samples, 2.5 μL of ISTD, and 95 μL of TBS buffer with the b-TNF-α charged streptavidin beads. Samples were then mixed (1200 rpm) for 2 hours at room temperature, washed 2 times with TBS, and then washed 2 times with water. The purified biotherapeutics were eluted from the beads with a 0.1% formic acid solution (90 μL), which was mixed for 15 minutes. Eluates were transferred to a clean plate and then neutralized to pH 8.0 with 500 mM ammonium bicarbonate (10 μL). 

Digestion

Following affinity purification, samples were digested using the ProteinWorks eXpress Digest Kit (p/n: 176003689). Specifically, 100 μL of affinity purified sample was diluted to 120 μL with ProteinWorks digestion buffer, and subsequently digested for 2 hours using the supplied 5-step protocol. Resulting samples were then injected (15 μL) for LC-MS analysis.

LC-MS method conditions

LC system:

ACQUITY I-Class UPLC (Fixed Loop)

Detection:

Xevo TQ-XS Mass Spectrometer, ESI+

Column:

ACQUITY UPLC Peptide BEH C18, 1.7 μm, 2.1 × 150 mm (p/n: 186003687)

Column temp.:

55 °C

Sample temp.:

15 °C

Injection volume:

15 μL

Mobile phases: A:

A: 0.1% Formic acid in H2O

B: 0.1% Formic acid in ACN

Infliximab LC gradient

Time

(min)

Flow rate

(mL/min)

%A

%B

Curve

Initial

0.3

95

5

6

1.5

0.3

95

5

6

9.5

0.3

65

50

6

10.0

0.3

10

90

6

11.0

0.3

10

90

6

11.5

0.3

95

5

6

13.5

0.3

95

5

6

Adalimumab LC gradient

Time

(min)

Flow rate

(mL/min)

%A

%B

Curve

Initial

0.3

95

5

6

1.5

0.3

95

5

6

9.5

0.3

65

35

6

10.0

0.3

10

90

6

11.0

0.3

10

90

6

11.5

0.3

95

5

6

13.5

0.3

95

5

6

Etanercept LC gradient

Time

(min)

Flow rate

(mL/min)

%A

%B

Curve

Initial

0.3

98

2

6

1.5

0.3

98

2

6

8.5

0.3

60

40

6

9.0

0.3

10

90

6

10.0

0.3

10

90

6

10.5

0.3

98

2

6

12.5

0.3

98

2

6

MS conditions

MS system:

Xevo TQ-XS

Ionization mode:

ESI+

Capillary:

2.9 kV

Cone:

32 V

Source offset:

30 V

Source temp.:

150 °C

Desolvation temp.:

600 °C

Cone gas flow:

150 L/Hr

Desolvation gas flow:

1000 L/Hr

Collision gas flow:

0.15 mL/Min

Nebulizer gas flow:

7 Bar

Data management:

MassLynx (v4.2)

Quantification

software:

TargetLynx

Results and Discussion

As the bioanalytical industry moves towards faster and more robust methodologies, using small sample volumes to decrease costs, the demand for highly sensitive and selective assays still remains. As a result, more specific LC-MS based assays incorporating immunoaffinity enrichment are often needed to reach the desired limits of detection of protein biotherapeutics in biological matrices, such as serum.4 In addition, there is particular concern to know precisely what is being quantified, free or total therapeutic, which requires the quantification assay to have a high level of specificity. Like small molecule therapeutics, the biological availability of a therapeutic determines its ability to elicit a pharmacological response; in mAb therapeutics, this is classified as “free or active mAb” which is either unbound or partially bound to its target ligand.5 In this application note, we utilize the specificity of the biotherapeutic/target ligand interaction between TNF-α and the biotherapeutics infliximab, adalimumab, and etanercept. In this assay, biotinylated TNF-α is conjugated to high capacity streptavidin coated magnetic beads and this TNF-α/magnetic bead complex (Figure 1) is then used to quickly extract the proteins of interest from serum. Using this highly selective immunoaffinity extraction procedure and a standardized, kit-based approach to protein digestion with ProteinWorks eXpress Digest Kits, biotherapeutics can be extracted, digested to peptides, and injected for LC-MS analysis on the same day.

Figure 1. Tumor necrosis factor alpha (TNF-α) binds to the variable regions of infliximab and adalimumab, and to the TNFR-p75 region of etanercept. Biotinylated TNF-α is conjugated to a slurry of streptavidin coated magnetic beads. This target ligand/bead complex can then be used to extract infliximab, adalimumab, and/or etanercept from complex matrices.6

Sample preparation

Sensitive, selective, and robust quantification of biotherapeutics from serum/plasma can be difficult to achieve due to the high endogenous complexity of these matrices, the complexity of the therapeutic, and the broad range of sensitivity desired (low ng/mL–μg/mL). This is further compounded by the desire to use smaller sample volumes, especially in the context of preclinical species. In order to achieve the low limits of detection desired by pharmacokinetic (PK) assays while using microsampling volumes, a high level of specificity is needed from immunoaffinity enrichment techniques. Utilizing the biotherapeutic to target ligand interaction of the TNF-α targeting biotherapeutics, immunoenrichment and subsequent digestion with ProteinWorks digest kits, LLOQs of ≤50 ng/mL, were easily achieved for 3 TNF-α targeting biotherapeutics from ≤10 μL of human serum (Figure 2). While sensitive, accurate, and reproducible quantification of all three biotherapeutics is possible using microsampling volumes (2.5 μL), when ultimate sensitivity is desired, this method is scalable to extract therapeutics from larger sample volumes (10 μL). The benefits of using this larger serum volume for immunoaffinity enrichment are demonstrated in Figure 2. At 50 ng/mL of each therapeutic peak area counts, peak shape, and overall intensity were greatly improved for the tryptic peptides of infliximab, adalimumab, and etanercept.

Figure 2. Representative chromatograms demonstrating improved sensitivity and peak shape of 50 ng/mL infliximab, adalimumab, and etanercept signature peptides extracted from 2.5 and 10 μL of human serum.

Chromatography

Chromatographic separation of infliximab, adalimumab, etanercept, SILuMAb-Infliximab (ISTD), and SILuMAb-Adalimumab (ISTD) tryptic peptides was achieved using an ACQUITY UPLC Peptide BEH C18, 300 Å, 1.7 μm, 2.1 × 150 mm Column (p/n: 186003687). Representative chromatograms of infliximab, adalimumab, and etanercept, and respective SILuMAb ISTD signature peptides used for quantification are highlighted in Figure 3. The LC gradients used for the quantification of each protein were highly optimized for the specific protein of interest and can be found in the experimental section. A standard LC gradient of 5% to 50% mobile phase B (MPB) over 8 minutes easily separated infliximab signature peptides and ensured minimal carryover between samples. Adalimumab however, required a shallow LC gradient of 5% to 35% MPB over 8 minutes to adequately separate its signature peptides from endogenous interferences, and fully elute its hydrophobic peptides from the column. Lastly, for etanercept peptides, the benefits of an LC gradient of 2% to 40% MPB over 7 minutes were two-fold: the high aqueous loading conditions ensured solubility of the polar peptides and provided retention on the column, while the shallow gradient ensured that larger, and more hydrophobic peptides, were adequately eluted from the column, thereby reducing sample carryover.

Figure 3. Representative chromatograms of infliximab, adalimumab, and etanercept signature peptides and their SILuMAb ISTD counterparts (5,000 ng/mL) extracted from human serum. Chromatographic separation was achieved using an ACQUITY UPLC Peptide BEH C18 , 1.7 μm, 2.1 × 150 mm Column.

Mass spectrometry

LC-MS/MS quantification of the biotherapeutics infliximab, adalimumab, and etanercept was performed using a Xevo TQ-XS Triple Quadrupole MS (TQ-XS MS). Signature tryptic peptides of each biotherapeutic were identified using Skyline (MacCoss Labs, University of Washington),7 an open-access software, which can be used to perform in-silico tryptic digestions of proteins with known sequences. In addition, Skyline was used to predict tryptic peptide sequences, charge states, fragment ions, and collision energies for MRM transitions. The resulting tryptic peptide sequences were then compared to the human plasma proteome (NCBI BLAST)8 to exclude peptides which were not unique to the specific protein of interest. Following unique signature peptide identification, development and optimization of the MRM methods were experimentally determined using a Skyline/MassLynx workflow performed on the Xevo TQ-XS MS using a tryptic digest of the protein of interest in buffer and in plasma matrix. For example, etanercept is a highly glycosylated protein with very few unique signature peptides available. With the help of Skyline, the ICTCRPGWYCALSK peptide was chosen for the quantification of etanercept due to its high signal intensity and low predicted levels of glycosylation. For all biotherapeutics, tryptic peptides used for quantification were ultimately chosen on the basis of their signal intensity, selectivity in matrix, and chromatographic performance. Optimized MS conditions and MRM transitions used for the quantification of infliximab, adalimumab, etanercept, SILuMAb-Infliximab (ISTD), and SILuMAb-Adalimumab (ISTD) tryptic peptides are listed in Table 1.

Table 1. Final MS conditions for infliximab, adalimumab, etanercept, SILuMAb-Infliximab, and SILuMAb-Adalimumab tryptic peptides, including precursor and fragment ions. *SILuMAb proteins incorporate 15N13C stable isotope labeled lysine and arginine residues.

Linearity, Precision and Accuracy

For all three biotherapeutics monitored, accurate, linear, and precise quantification was achieved. Calibration curves from infliximab, adalimumab, and etanercept signature peptides were linear over a range of 3.0 to 3.7 orders of magnitude with R2 values >0.99 using 1/x2 weighted regressions. Mean accuracies for all standard curves ranged from 85.3–110.8%. A summary of standard curve performance for all tryptic peptides is listed in Table 2. Using only 2.5 μL of human serum, quantification limits of 10–50 ng/mL were achieved. Representative chromatograms of blank human serum and LLOQs for each biotherapeutic are highlighted in Figure 4. QC performance for infliximab and adalimumab is highlighted in Table 3, while QC chromatographic performance for the SINSATHYAESVK infliximab tryptic peptide is demonstrated in Figure 5. QC accuracy and precision performance for infliximab and adalimumab met recommended bioanalytical method validation guidelines9,10 with mean %RSDs <15% and % QC accuracy ranges of 92.7–108.8 (infliximab), and 90.6–104.2 (adalimumab).

Table 2. Linear dynamic range and standard curve statistics for infliximab, adalimumab, and etanercept signature peptides extracted from 2.5 μL of human serum.
Figure 4. Representative chromatograms of infliximab, adalimumab, and etanercept signature peptides extracted from 2.5 μL of human serum. Chromatograms demonstrate excellent sensitivity and selectivity of the assay, comparing extracted blank serum and the lower limits of quantification (LLOQ) for each biotherapeutic.
Table 3. QC sample statistics for infliximab and adalimumab signature peptides demonstrating excellent accuracy and reproducibility of the assay extracted from 2.5 μL of human serum.
Figure 5. Representative QC chromatograms for the infliximab peptide SINSATHYAESVK which was extracted from 2.5 μL of human serum.

Conclusion

This application note presents a highly sensitive and selective sample preparation strategy for the LC-MS/MS quantification of free/active biotherapeutic from human serum for the TNF-α targeting biotherapeutics: infliximab, adalimumab, and etanercept. Using a typical set of standard curve and QC samples, and very low volumes of serum (≤10 μL), limits of quantification of 10–50 ng/mL were achieved. Using selective immunoaffinity enrichment and a standardized, kit-based approach to protein digestion combined with fast UPLC analysis and a highly sensitive mass spectrometer, excellent linearity and precision for all standards and QC samples were achieved with %RSDs <15%. With the appropriate immunoaffinity capture reagents, this technique can be applied to other targets and biotherapeutics, demonstrating its broad applicability for high sensitivity, quantitative bioanalysis of large molecules from complex matrices.

References

  1. Drug indications for Infliximab, Adalimumab, and Etanercept. Retrieved 28 Mar 2018 from https://www.drugbank.ca/drugs/DB00065, https://www.drugbank.ca/ drugs/DB00051, and https://www.drugbank.ca/drugs/DB00005
  2. Tumor Necrosis Factor Inhibitors Drug Market, 2024 – HUMIRA and REMICADE Have Made it to the List of Blockbuster Drugs of 2017 with Global Sales of US$ 17.6 Billion. Retrieved 30 Apr 2018 from https://www.prnewswire.com/news-releases/tumor-necrosis-factor-inhibitors-drug-market-2024---humira-and-remicadehave-made-it-to-the-list-of-blockbuster-drugs-of-2017-with-global-sales-of-us-176-billion-300615283.html
  3. GaBI Journal Editor. Patent Expiry Dates for Biologicals: 2016 Update. GaBI Journal. 2017;6.1:27–30.
  4. El Amrani, M, van den Broek, MP, Gobel, C, van Maarseveen, EM. Quantification of Active Infliximab in Human Serum with Liquid Chromatography-Tandem Mass Spectrometry Using a Tumor Necrosis Factor Alpha-based Pre-analytical Sample Purification and a Stable Isotopic Labeled Infliximab Bio-similar as Internal Standard: A Target-based, Sensitive and Cost-effective Method. J. Chromatogr. A. 2016;1454:42–48..
  5. Lee, JW; Kelley, M; King, LE; Yang, J; Salimi-Moosavi, H; Tang, MT; Lu, JF; Kamerud, J; Ahene, A; Myler, H; Rogers, C. Bioanalytical Approaches to Quantify “Total” and “Free” Therapeutic Antibodies and Their Targets: Technical Challenges and PK/PD Applications Over the Course of Drug Development. AAPS J. 2011;13(1):99–110.
  6. Scallon, B; Cai, A; Solowski, N; Rosenberg, A; Song, XY; Shealy, D; Wagner, C. Binding and Functional Comparisons of Two Types of Tumor Necrosis Factor Antagonists. J Pharmacol Exp Ther. 2002;301(2):418–426.
  7. Skyline Targeted Mass Spec Environment (2017). Downloaded July 2017 from https://skyline.ms/project/home/software/Skyline/begin.view.
  8. National Center for Biotechnology Information, Basic Local Alignment Search Tool. Blastp Suite. Accessed July 2017. https://blast.ncbi.nlm.nih.gov/Blast.cgi.
  9. FDA Guidance for Industry for Bioanalytical Method Validation, CDER.
  10. EMA Guideline on Bioanalytical Method Validation. (2011) Rev. 1 Corr. 2, CHMP.

720006317, June 2018

Volver arriba Volver arriba