• Nota de aplicación

Development of Monoclonal Antibody Charge Variant Analysis Methods Using a BioResolve SCX mAb Column

Development of Monoclonal Antibody Charge Variant Analysis Methods Using a BioResolve SCX mAb Column

  • Hua Yang
  • William J. Warren
  • Stephan M. Koza
  • Waters Corporation

Abstract

This application note highlights the factors that need to be considered to successfully develop a fixed-pH salt gradient method for cation-exchange chromatography (CEX).

Introduction

Charge heterogeneity in therapeutic proteins including monoclonal  antibodies (mAbs) needs to be characterized and monitored, since it can potentially affect biological activity and safety of the biotheraputics.1 Ion-exchange chromatography (IEX) has been widely used for the purification, characterization, and routine monitoring of protein charge variants. In selecting between cation-exchange or anion-exchange separations, cation-exchange chromatography (CEX) is the most suitable mode for mAb charge variant characterization, due to the comparatively high isoelectric point (pI) of mAbs. In this application note, we show the factors that need to be considered to successfully develop a fixed-pH salt gradient method for CEX. Additional information related to use of pH gradients are available  in a separate Waters application note.2  

Using a Waters high-resolution, strong, cation-exchange column (i.e., BioResolve SCX mAb), and Waters AutoBlend Plus Technology, salt gradient method development can be efficiently performed to generate a reproducible and robust separation.

Experimental

Sample description

Trastuzumab, adalimumab, and bevacizumab were diluted in water to 5 mg/mL. Cetuximab was diluted in water to 1 mg/mL. Drug products were analyzed post expiry. 

LC Conditions

System:

ACQUITY UPLC H-Class Bio

Sample temp.:

10 °C

Analytical column temp.:

30 °C

Flow rate:

0.8 mL/min, unless specifically noted

Injection volume:

1–2 µL for 4.6 mm I.D. column; 0.2 µL for 2.1 mm I.D. column

Column:

BioResolve SCX mAb, 3 µm, 4.6 × 50 mm (p/n: 186009058)

BioResolve SCX mAb, 3 µm, 4.6 × 100 mm (p/n: 186009060)

BioResolve SCX mAb, 3 µm, 2.1 × 50 mm (p/n: 186009054)

Detection:

ACQUITY UPLC TUV Detector with 5 mm titanium flow cell, 280 nm

Sample collection/vials:

LCGC certified clear glass 12 × 32 mm screw neck total recovery with cap and preslit PTFE/Silicone Septa, 1 mL volume, 100/pk (p/n: 186000385C)

Mobile phase A:

100 mM MES monohydrate*

Mobile phase B:

100 mM MES sodium salt*

Mobile phase C:

1 M NaCl

Mobile phase D:

Water

Typrical gradient for 4.6 x 50 mm column (Auto Blend Plus method)

The system is pre-defined to deliver 20 mM MES buffer.

Time

Flow rate (mL/min)

pH **

Salt

Salt curve

0

0.8

6.7

0

1

0.8

6.7

0

11

2

0.8

6.7

50**

6

4

0.8

6.7

50**

6

9

0.8

6.7

85**

6

10

0.8

6.7

700

6

10.1

0.8

6.7

0

11

25

0

6.7

0

11

* MES: 2-(N-morpholino)ethanesulfonic acid

** pH as well as starting and ending salt concentration vary with different mAbs. A typical optimized gradient has changes in salt concentration of 35–40 mM in 5 minutes.

Data management: Empower 3 Software

Results and Discussion

Method development tools

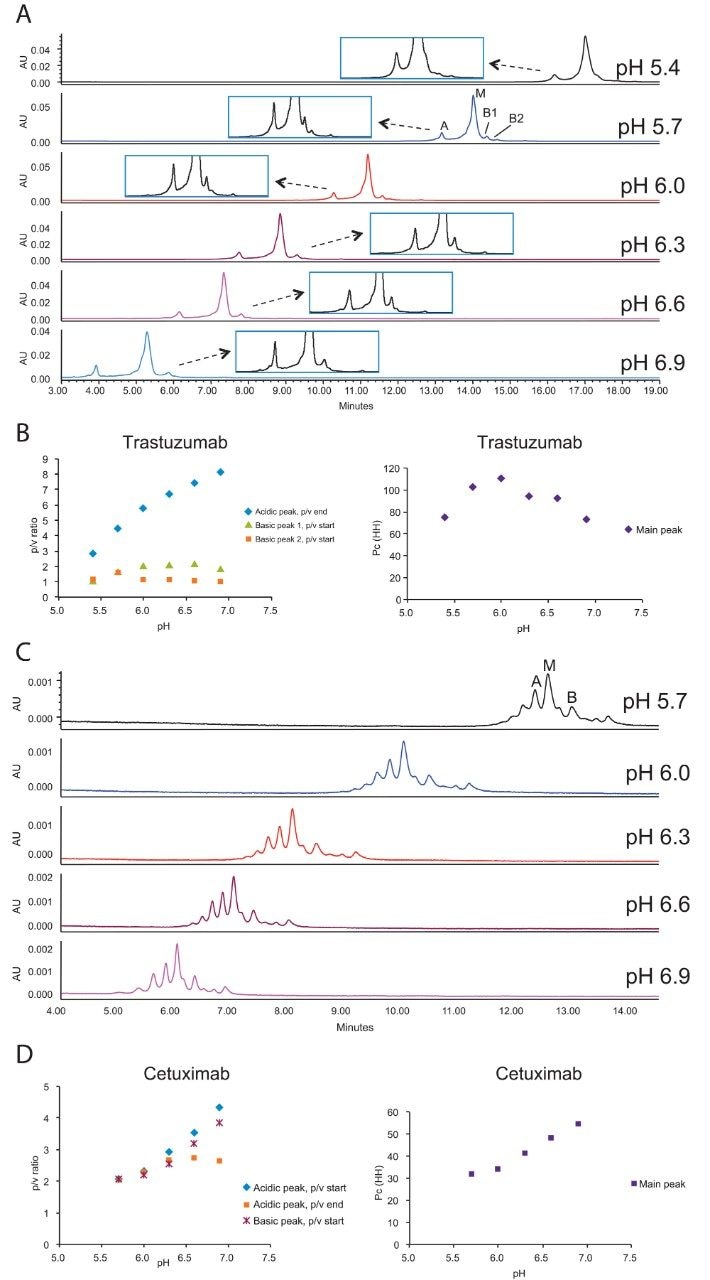
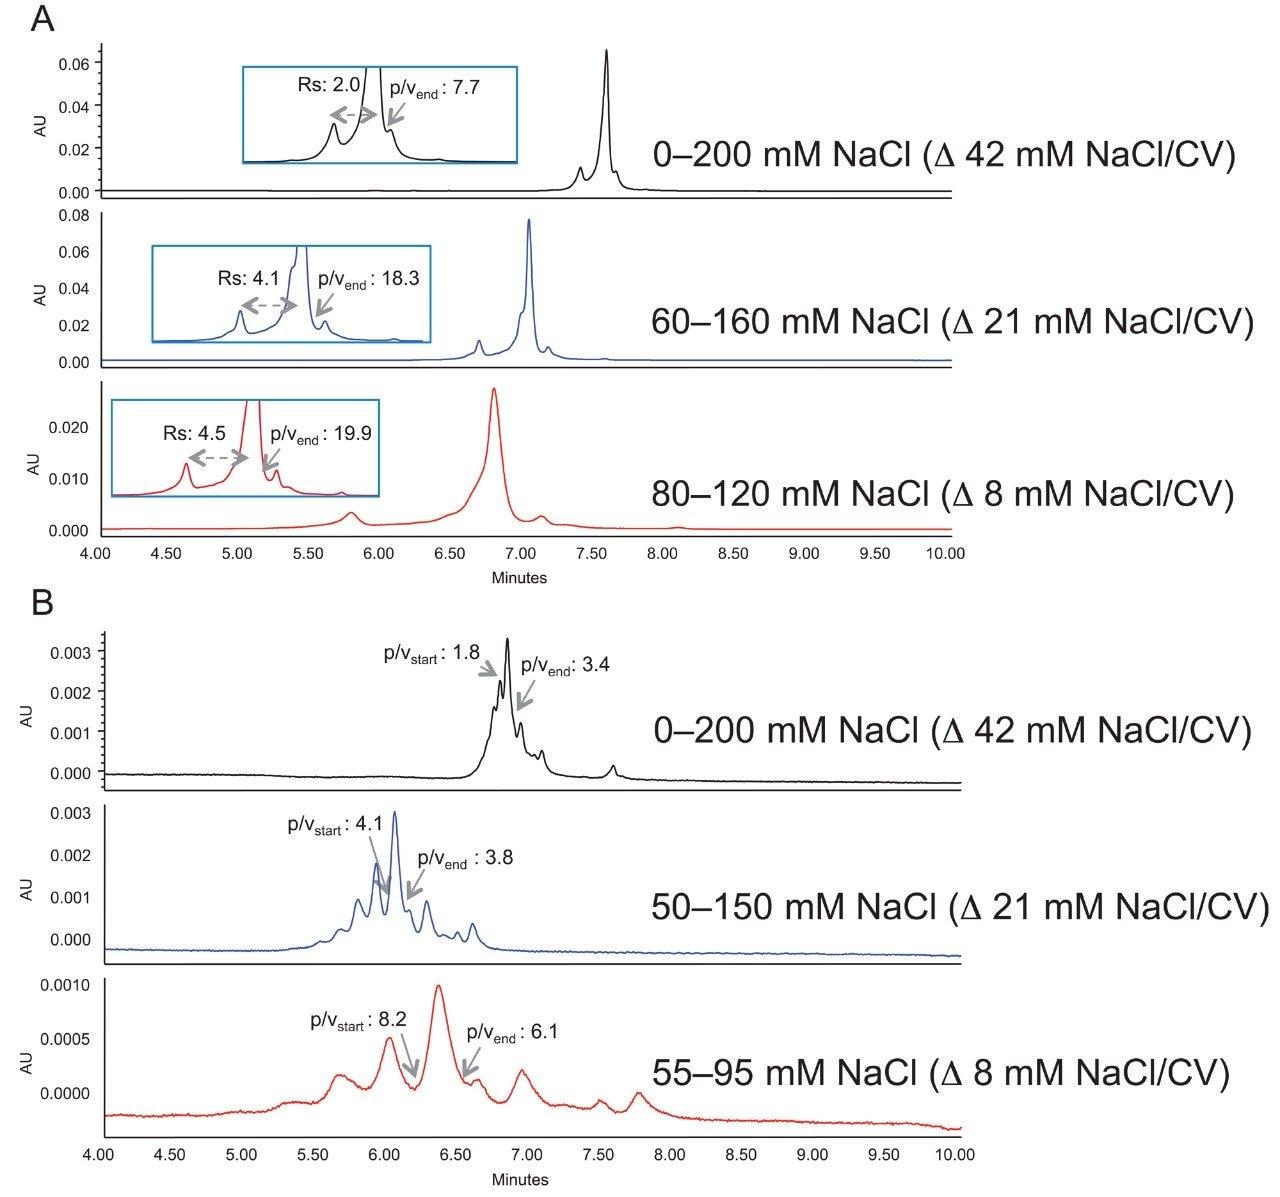
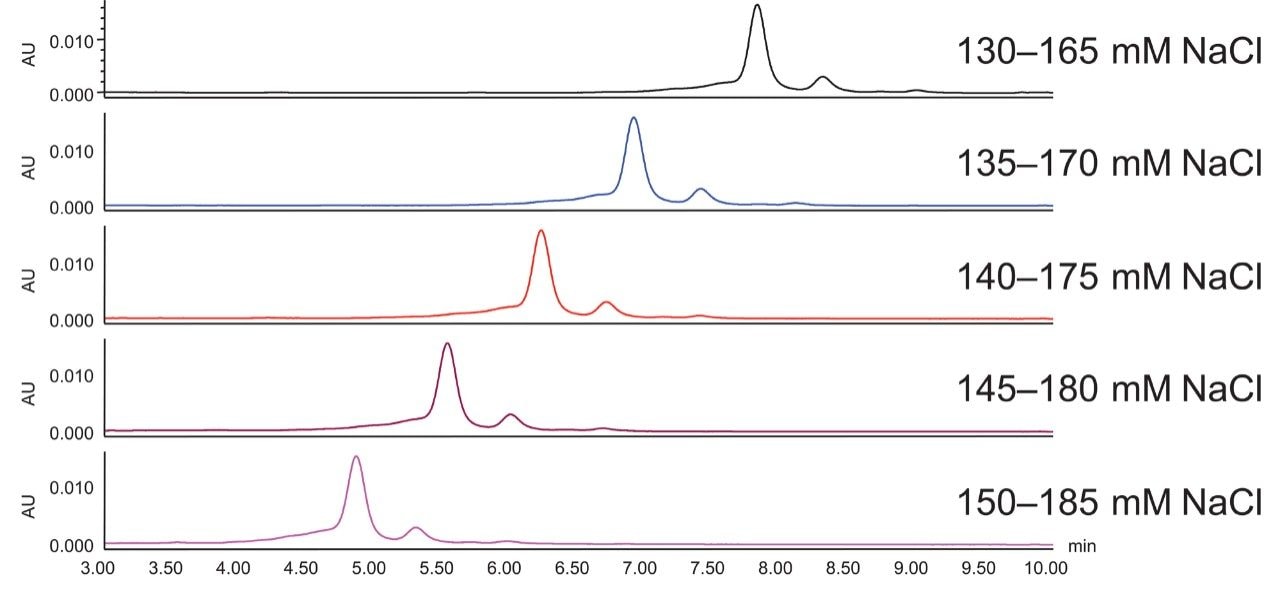
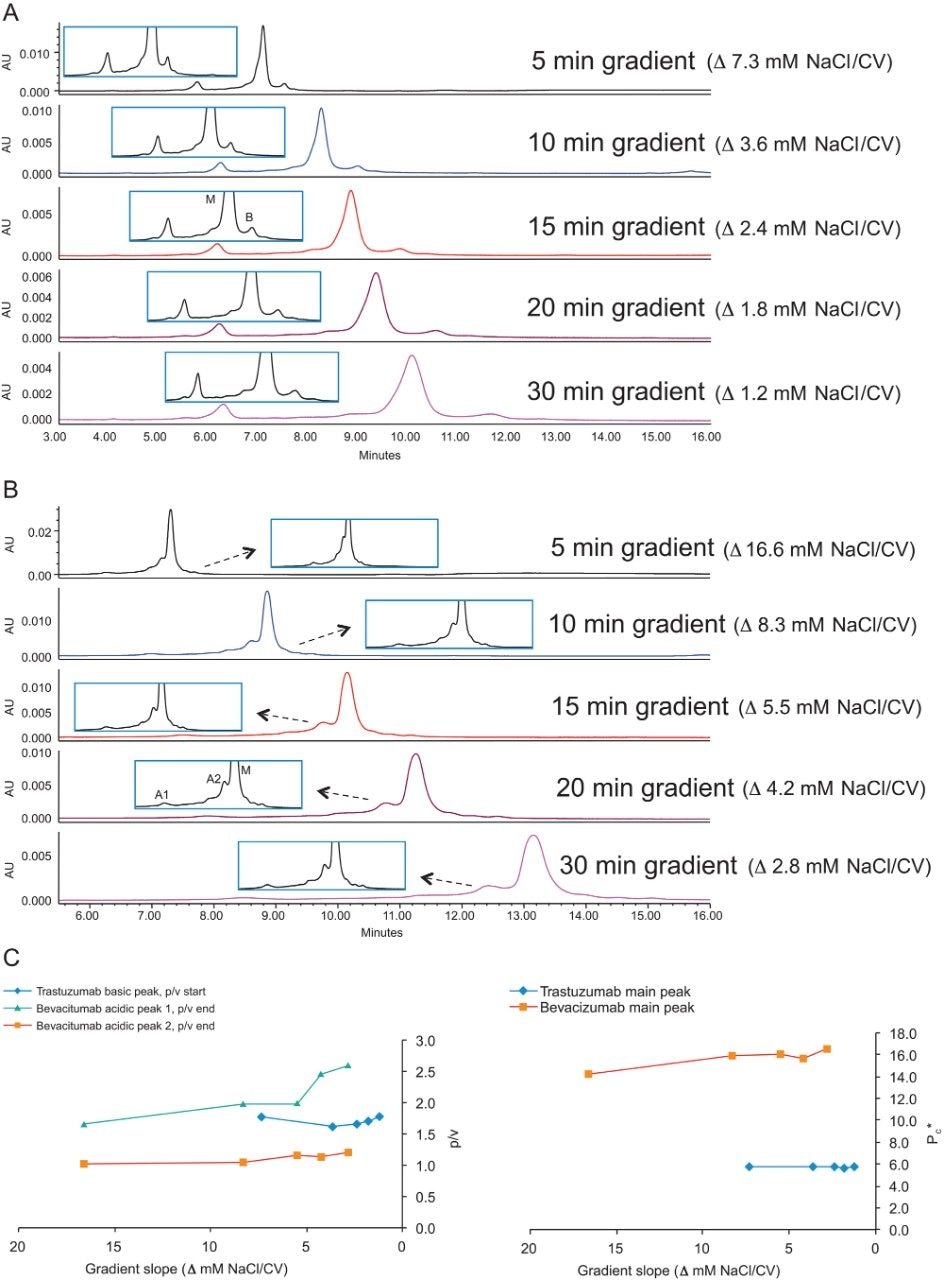
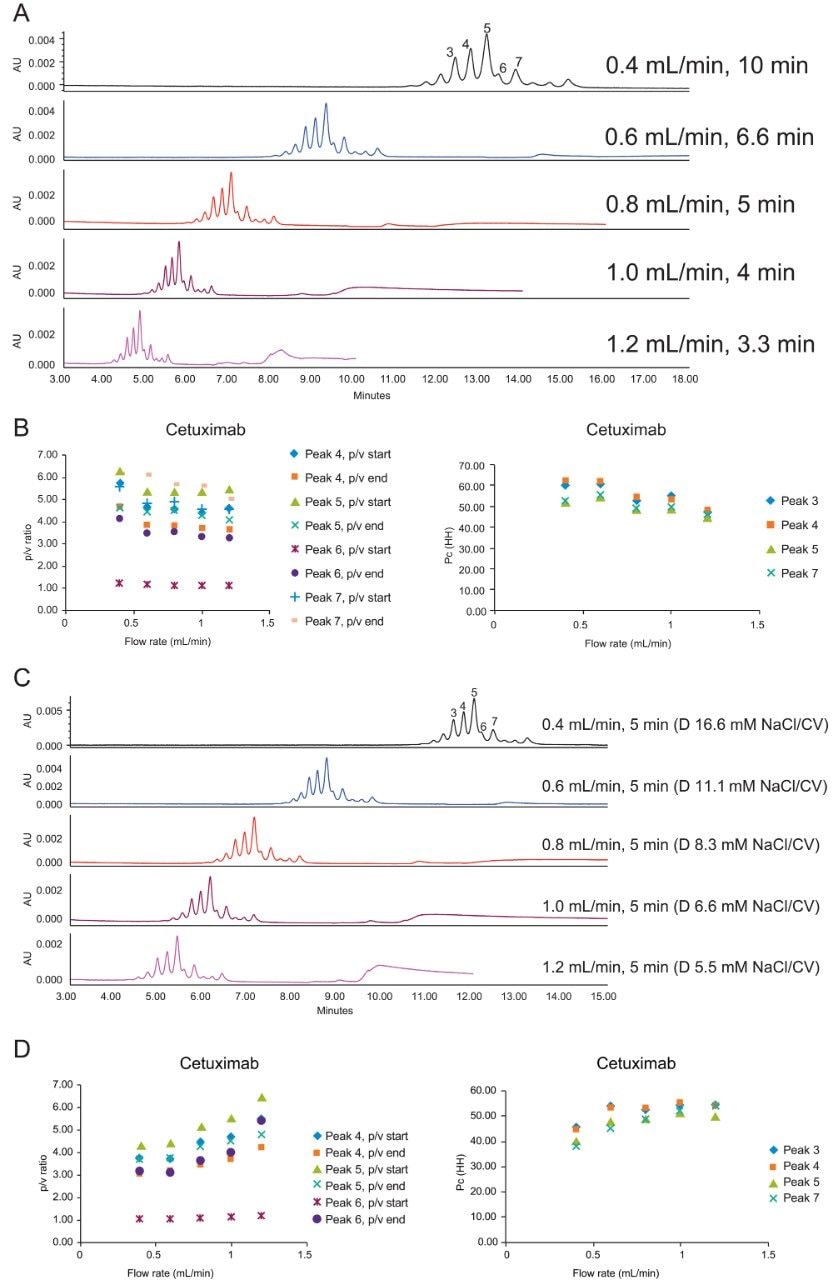
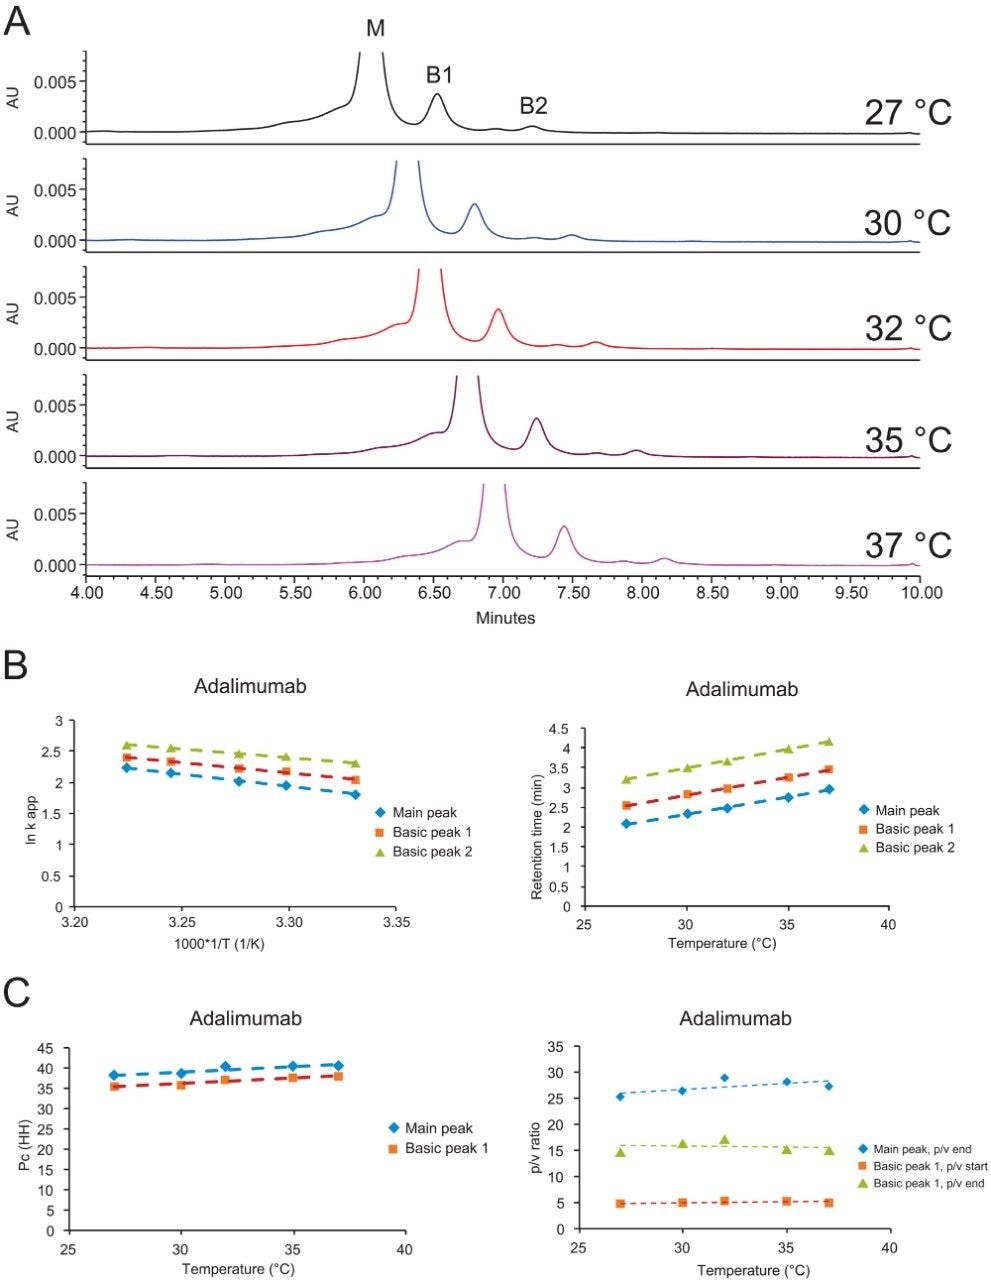
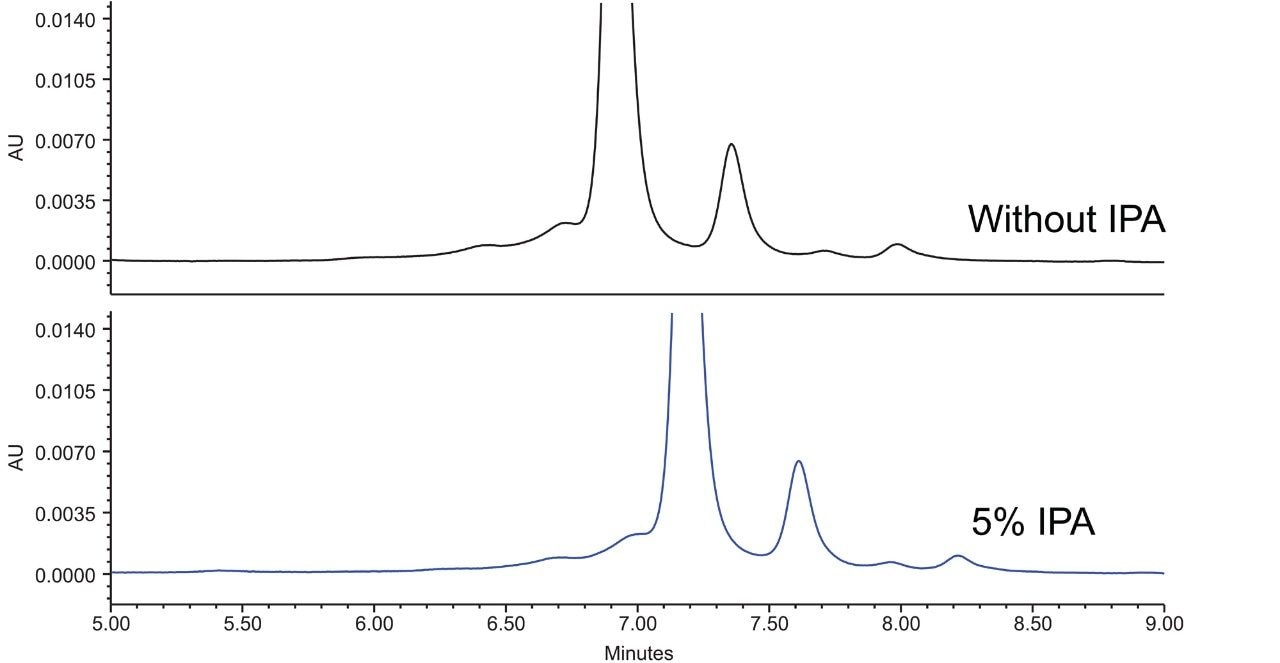
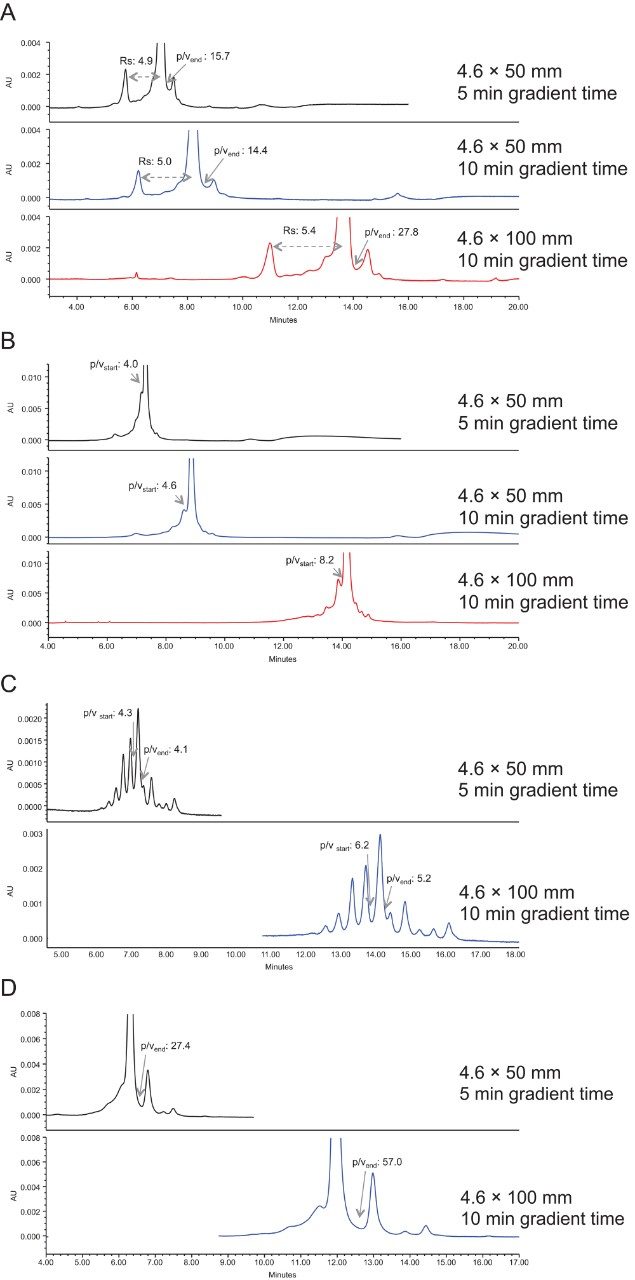
Cation-exchange chromatography (CEX) using a salt gradient is a standard method for mAb charge heterogeneity characterization. The method parameters that are often optimized for individual mAbs include pH, salt concentration, gradient time, flow rate, organic modifiers, and temperature, among others.  In addition, variations in commercially available columns such as particle characteristics, packing efficiency and stability, as well as ligand type and density, can also play a major role in successful method development. Due to these differences, however, it is generally beneficial to optimize conditions for each column being evaluated. Parameters may be optimized simultaneously using a factorial design or by linearly optimizing a single variable at a time. We have elected the latter approach in order to better demonstrate the impact of each parameter.

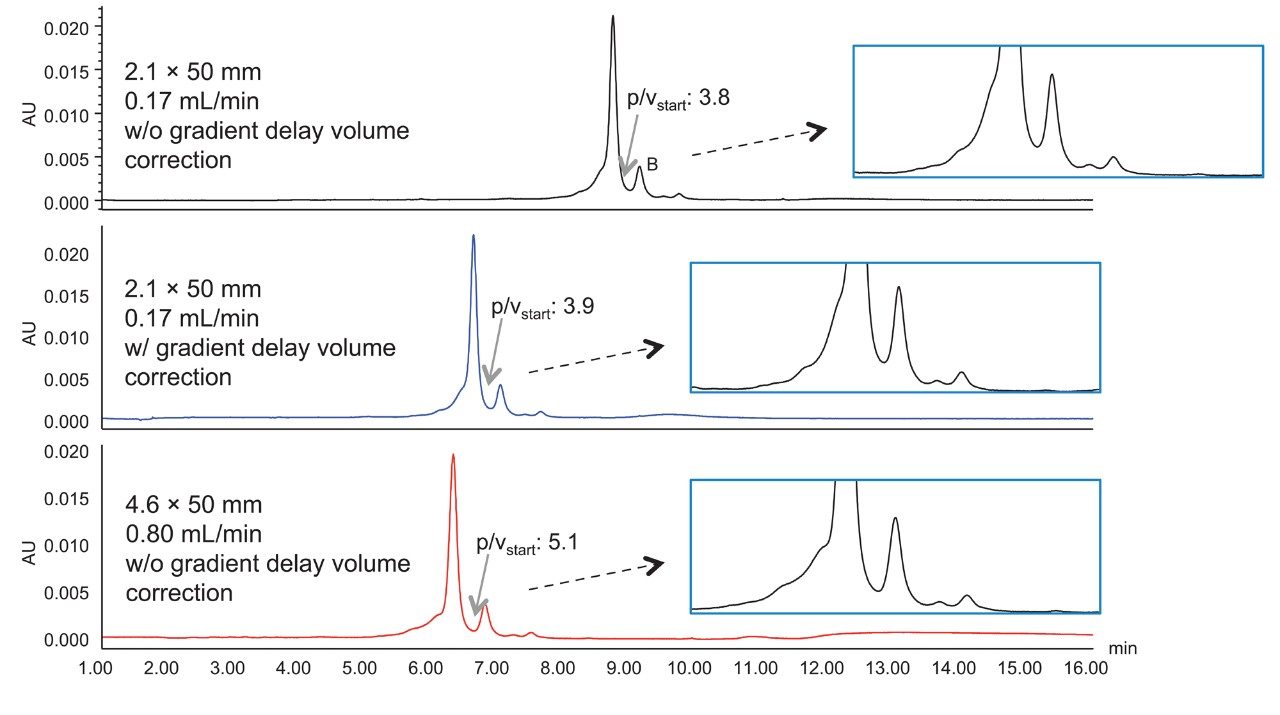
The results of the experiments are evaluated qualitatively and quantitatively. The two quantitative performance characteristics discussed include effective peak capacity (Pc*) and peak-to-valley ratio (p/v).

The Pc* is calculated as following:

Effective peak capacity = 1+ (Retention time of the last peak – retention time of the first peak)/Peak width

As can be seen from the calculation, the Pc* equation uses the period of time where the  peaks are eluted.  

The p/v is defined as the ratio of the height of the peak from the baseline to the height of the valley from the baseline where the valley is either preceding the peak (p/vstart) or following the peak (p/vend).

Mobile phase pH

Mobile phase pH is the most critical and generally the first parameter to be optimized in the method development process, because  pH can alter the selectivity significantly. Figures 1A – 1D show the impact of mobile phase pH on the CEX separations of trastuzumab and cetuximab. In CEX, retention decreases as pH increases (Figure 1A and 1C).  

Figure 1. Effect of pH on mAb charge variant separations. A and B: Trastuzumab, 20 mM MES, 50–155 mM NaCl in 15 minutes. C and D: Cetuximab, 20 mM MES buffer, 25–110 mM NaCl in 10 minutes. The arrows point to the rescaled figures that show details of low abundance  peak separation.

This is because higher pH reduces the positive charge on the analytes, weakening the ionic interaction between the positively charged analyte and negatively charged stationary phase.

There is a compromise that must be generally made between acidic peak resolution and basic peak resolution when the pH is varied. For both trastuzumab and cetuximab, as the pH increases, the p/v ratios increase for the acidic peaks and decrease for the basic peaks. The impact of pH on these separations is sample dependent and due to the balance between the resolution for the acidic and basic peaks that is observed, one must often consider multiple factors including selectivity differences, integration reproducibility, and even the criticality of the charge variants being quantified when choosing a robust operating pH.  

Salt gradient slope

Salt concentration

The slope of the salt gradient is another critical parameter in CEX separations. As can be seen in Figures 2A and 2B, a wide starting and ending salt concentration is first run to gain a rough idea on where the analyte will be eluted during the gradient. This will result in a steep gradient slope. As the starting and ending salt concentration is narrowed down further, the gradient slope becomes shallower without impacting analysis time, and the separation of the charge variants can improve, as indicated in resolution (Rs) and peak to valley (p/v) ratio.

The gradient slope is indicated as Δ mM salt per column volume (CV). The calculation is shown below:

Column I.D. = 4.6 mm

Column length = 50 mm

Flow rate = 0.8 mL/min

Gradient time = 5 min

Column volume = 3.14 * (4.6 mm/2)2 * 50 mm * 10-3 = 0.83 mL

Gradient Slope = Ending salt conc.–Starting salt conc. / # of column volume = (200–0)mM NaCl / (0.8 mL / min) *5 min/ 0.83 mL = 42 mM NaCl/CV  

Figure 2. Effect of salt concentration on mAb charge variant separation. A: Trastuzumab; B: Cetuximab; 20 mM MES, pH 6.0, gradient time = 5 minutes.

Figure 3 shows the impact of starting salt concentration. As predicted, higher starting  salt concentration results in shorter retention time of adalimumab charge variants. Note that because the gradient slope is kept constant in this example, the retention time differences do not appreciably change.

Figure 3. Effect of stating salt concentration on adalimumab charge variant separation; 20 mM MES, pH 5.7, gradient time = 5 minutes.

Gradient time

Varying gradient time will also change the gradient slope in terms of column volumes. Figures 4A–C show the effect of longer gradient times on the charge variant separation of trastuzumab and bevacizumab. In the case of trastuzumab, the noted Pc* ratio did not change significantly as the gradient time increases. For bevacizumab, there was a slight increase in p/v and Pc* with the increase of gradient time (Figure 4C).  

These results indicate that there is indeed a practical limit to decreasing gradient slope in order to increase the resolution of these separations. It is worth considering some of the reasons for this. In general, it is important to recognize that there may be low-abundance charge variants that are not well separated from the major and minor observed peaks. These low-abundance forms may be other less common variants and multiply modified forms. Additionally, minor variations of protein secondary structure which cannot be fully resolved can also add to the broadness of the observed peaks. These conformational variants may be inherent to the formulated protein or may conceivably be introduced by the chromatographic method.3 A third cause of band broadening may also be due to the orientation of the protein relative to the ligands on the surface of the particle which can be impacted by the loading conditions of the separation.4 

It is worth noting that irrespective of whether significant increases in the extent of peak separation are obtained, there may be value in running longer gradients to improve the reliability of peak integration and provide more robust and readily transferred methods.

Figure 4. Effect of gradient time on mAb charge variant separation. A: Trastuzumab, 20 mM MES, pH 5.7, 50–85 mM NaCl. B: Bevacizumab, 20 mM MES, pH 5.4, 120–200 mM NaCl. The arrows point to the rescaled figures where detailed separation of low abundance peak was shown. C: Effect of gradient time on p/v and Pc*. Because the longer the gradient time, the shallower  the gradient slope, the x-axis is in reverse order to show the effect of increasing gradient time. 

Flow rate

Gradient slope can also be altered by varying flow rates. Figures 5A–D show two cases of varying flow rates.

In one case, both the flow rate and gradient time are varied so that the total gradient volume is kept constant (Figures 5A and B). As a result,  the gradient slope is kept constant. Since the BioResolve SCX mAb Column contains  non-porous particles, and there is no diffusion (mass transfer) into the particle, it is predicted that the p/v ratio and Pc* should not be significantly impacted by flow rate. Indeed, as shown in Figure 5B, the p/v ratio and Pc showed only a slight decrease at higher flow rates. This may be the result of increased post column dispersion at higher flow rates or minor changes of the protein conformation due to the higher hydrostatic pressures imposed.5

In the second case, the flow rate is varied while the gradient time is kept constant (Figures 5C and D). It is predicted that higher flow rate result in better separation, because the gradient slope is shallower with higher flow rate. Consistent with the prediction, the p/v ratio increases for most of the peaks with the increase of flow rate. However, similarly to the observations made for increasing the gradient length, the Pc increases to some extent and reaches a plateau for the more  shallow gradients generated by higher flow  rates (Figure 5D).

Figure 5. Effect of flow rate on cetuximab charge variant separation. A and B: The gradient volume is kept constant, gradient slope = Δ 8 mM NaCl/CV. C and D: The gradient time is kept constant.

Column temperature

Figures 6A–C show an example where the temperature was varied. Since CEX is a non-denaturing technique, the temperature was only increased up to 37 °C.

The relationship between the retention factor and the temperature can be expressed in van’t Hoff equation:

log k = -(ΔH / RT) + (Δ / R) + log β

k is the retention factor, T is the absolute temperature in Kelvin, ΔH is the enthalpy  change associated with the transfer of the analyte between phases, ΔS is the entropy change, and R is the molar gas constant.

A plot of log k versus 1/T should result in a linear relationship, and the enthalpy and entropy information can be extrapolated from the slope and Y-intercept, respectively.6 Shown in Figure 6B,  a linear relationship was indeed obtained for adalimumab. However, even though the retention time increased with increase of temperature (Figure 6B, right plot), p/v ratio, Pc, and selectivity did not change significantly with temperature (Figure 6C). Similar observations were made for cetuximab, trastuzumab, bevacizumab (date not shown), and other mAbs from the literature.7

Based on all the observations, it is concluded that while temperature may impact the overall retention of proteins in these cation-exchange separations, it does not generally have significant impact on the selectivity differences and ultimately the resolution between mAb charge variants. Therefore, while optimization of temperature may not be essential, it is recommended that the temperature of these separations be controlled for improved retention time reproducibility.

Figure 6. Effect of temperature on adalimumab charge variant separation; 20 mM MES, pH 5.7, 140–175 mM NaCl in 5 minutes.

Organic additives

Organic additives could affect selectivity of IEX separation as well as the secondary interaction during the separation. A small percentage of isopropanol or methanol was added to the mobile phases at pH 5.4, 6.0, and 6.6. Figure 7 shows an example chromatogram where 5% of isopropanol was added to the mobile phases  at pH 6.0 in adalimumab separation.  

Figure 7. Effect of isopropanol as a mobile phase additive on adalimumab charge variant separation; 20 mM MES, pH 6.0, 115–155 mM NaCl in 5 minutes.

The two chromatograms looked almost identical except for the retention time difference, which is likely due to the fact that only 95% of the salt was there to elute the analyte. 

It’s important to point out that the peak area is very similar with and without organic additives in all cases, and the retention increased as the level of organic modifier increased, both of these observations indicate that there is minimal hydrophobic interaction between the analyte and the stationary phase. This is important, because the recovery of hydrophobic proteins and modified proteins such as antibody drug conjugate (ADC) requires minimal hydrophobic surface on the particle.

Column length

The effect of column length on the mAb charge variant separation is illustrated in Figures 8A–D.

The top chromatogram shows the separation on a 4.6 × 50 mm column in 5 minutes, while the bottom chromatogram shows the separation on a 4.6 × 100 mm column in 10 minutes. The column volumes of the gradient slope are kept the same, so any changes in resolution is solely due to the impact of column length, not due to the changes in selectivity. As can be seen in all cases, the 100 mm column provides improved separation over the 50 mm column. Importantly, more  small peaks can be separated out with the 100 mm column. 

The middle chromatogram in figures 8A and B shows the separation on a 4.6 × 50 mm column  in 10 minutes. Although the gradient slope is halved, the separation is not as well resolved as that on a 4.6 × 100 mm column in 10 minutes, demonstrating that longer column length has more impact on the separation quality than running a longer gradient on a shorter column.

Figure 8. Effect of column length on mAb charge variant separation. A: trastuzumab, 20 mM MES, pH 6.7, 50–85 mM NaCl; B: bevacizumab, 20 mM MES, pH 5.4, 120–200 mM NaCl;  C: cetuximab, 20 mM MES, pH 6.6, 25–65 mM NaCl; D: adalimumab, 20 mM MES, pH 5.7, 140–175 mM NaCl.

Column internal diameter

Figure 9 shows the separation of adalimumab on a 2.1 x 50 mm column and on a 4.6 x 50 mm column.  Since the LC system has a gradient delay volume that impacts more on the smaller bore column, the retention time is longer on the 2.1 mm I.D. column. With the correction of the gradient delay volume in the instrument method (middle chromatogram), the retention time became very similar on both columns.

The separation is better resolved on the 4.6 mm I.D. column than that on the 2.1 mm I.D. column, as can be seen from the basic peak p/vstart as well as the profiles in the zoomed-in chromatograms. The tubing between the column outlet and the detector is 0.0025” in internal diameter and 8.5” in length. The TUV detector has a 5 mm flow path. It is predicted that the post-column dispersion has more impact on the performance of the narrower bore columns due to the smaller peak volumes generated.

On the other hand, it can be advantageous to use narrower bore columns. For example, when sample amounts are limited or if there  is a cost benefit to limiting mobile phase usage. Another advantage would be in the case where volatile mobile phases are used in  IEX for direct analysis by electrospray ionization source mass spectrometry. In this case when using the narrower bore column, flow-splitting may not be required due to the more compatible lower flow rates employed by the narrower bore columns.

Figure 9. Adalimumab charge variant separation on 2.1 mm I.D. and 4.6 mm I.D. columns, without (top) and with (middle) gradient delay volume correction on the 2.1 mm I.D. column. Flow rate = 0.17 mL/min for 2.1 mm I.D. column and 0.8 mL/min for 4.6 mm I.D. column.

Auto•Blend Plus technology

All of the separations shown in this application note have been generated using Auto•Blend Plus methods. Auto•Blend Plus Technology is a part of the Empower Software. Used in Waters’ quaternary pump systems including ACQUITY UPLC H-Class/H-Class Bio, ACQUITY Arc/Arc Bio Systems, it allows the analyst to program the method directly in the units of pH and salt molarity (see the gradient table in the Experimental section). It can speed up method development by simplifying mobile phase preparation. In addition, Auto•Blend Plus Technology can be used to help better define the robustness range of a method that has been developed.

Conclusion

Method development is an important step in charge variant analysis of biotherapeutic protein by cation-exchange chromatography, and there are many factors that can be manipulated.

  • Mobile phase pH can affect the resolutions of the acidic peaks and basic peaks inversely, so an operating pH needs to be chosen carefully to determine the optimal compromise for these separations.
  • Gradient slope affects selectivity and resolution. Gradient slope as defined by column volumes can be altered by changing gradient time or flow rate. A shallower gradient slope increases the resolution, however, at a certain point, further decreasing the gradient slope will not further improve the separation.
  • Temperature has minimal impact on the selectivity of mAb charge variants. However, it is recommended that temperature be controlled for improved reproducibility.
  • Increasing column length has more impact on resolution than increasing gradient time on a shorter column.
  • Finally, for the BioResolve SCX mAb Column, organic additives have minimal impact on the separation and the recovery of mAbs. This indicates that there is little hydrophobic interaction between the analytes and this CEX stationary phase.

We have demonstrated that through a systematic process of method development, effective CEX separations can be routinely developed. This process is made more efficient through the use of AutoBlend Plus Technology while also taking advantage of the high performance BioResolve SCX mAb Column.

References

  1. Khawli, L.A.; et al. Charge variants in IgG1. mAbs. 2010, 2 (6), 613–624.
  2. Wang, Q.; et al. Development of pH Gradient Mobile Phase Concentrates for Robust and High Resolution mAb Charge Variant Analysis. Waters Application Note, 720006491EN (2018).
  3. Hlady, V.; Buijs, J. Protein Adsorption on Solid Surfaces. Current Opinion on Biotechnology. 1996, 7 (1), 72–77.
  4. Kittelmanna, J.; et al. Orientation of Monoclonal Antibodies in Ion-Exchange Chromatography: A Predictive Quantitative Structure-Activity Relationship Modeling Approach. J. Chrom. A. 2017, 1510, 33–39.
  5. Lauber, M.A.; et al. Designing a New Particle Technology for Robust Charge Variant Analysis of mAbs. Waters Application Note, 720006475EN (2018).
  6. Fekete, S.; et al. Ion-Exchange Chromatography for the Characterization ofBiopharmaceuticals. J. Pharmaceutical and Biomedical Analysis. 2015, 113, 43–55.
  7. Fekete, S.; et al. Method Development for the Separation of Monoclonal Antibody Charge Variants in Cation Exchange Chromatography, Part I: Salt Gradient Approach. J. of Pharmaceutical and Biomedical Analysis. 2015, 102, 33–44.

720006477, April 2019

Volver arriba Volver arriba