• Nota de aplicación

LC-MS/MS Method Development and Validation for the Quantitative Determination of Regulated Mycotoxins in Cereal Grain Flours Using Simplified Sample Preparation Conditions on Xevo TQ-XS

LC-MS/MS Method Development and Validation for the Quantitative Determination of Regulated Mycotoxins in Cereal Grain Flours Using Simplified Sample Preparation Conditions on Xevo TQ-XS

  • Nicola Dreolin
  • Sara Stead
  • Waters Corporation

Abstract

In this application note we describe the validation of a quantitative multi-mycotoxin method in wheat flour, which was further extended to a range of different cereal-based flours.

Benefits

A fully quantitative LC-MS/MS-based method for the simultaneous determination of the most important and regulated mycotoxins in cereal grains and dried food commodities with a rapid, simple sample preparation strategy for compliance with regulatory limits and method performance guidelines.

Introduction

Mycotoxins are toxic secondary metabolites produced by various mold species that grow on many agricultural commodities and processed food, either in the field or during storage.1,2 They have been ranked as the most important chronic dietary risk factor, higher than synthetic contaminants, plant toxins, food additives, or pesticide residues.3

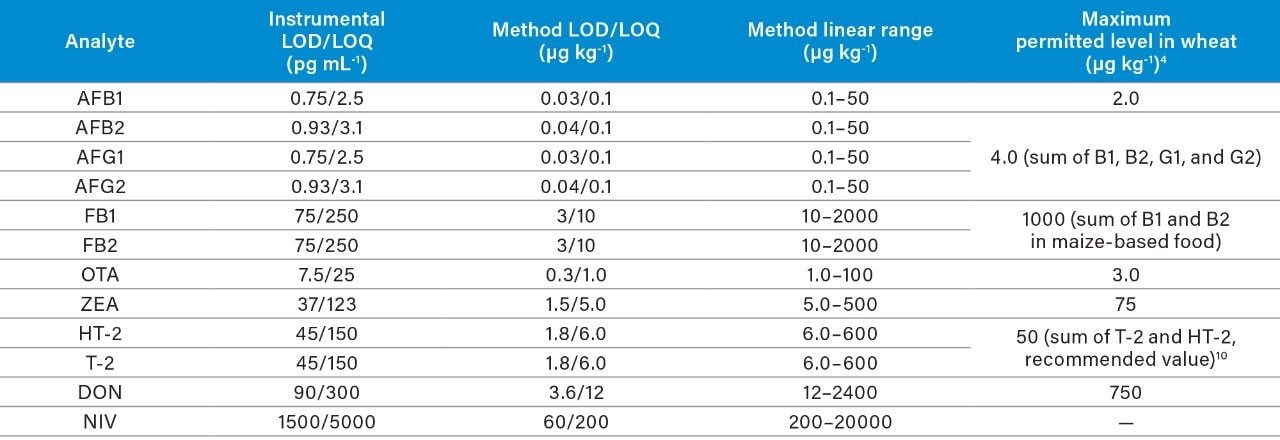
The European Commission Regulation No. 1881/2006 (and subsequent amendments)4 set the Maximum Permitted Levels (MPLs) for aflatoxins B1, B2, G1 and G2, fumonisins B1 and B2, deoxynivalenol, toxins T-2 and HT-2, zearalenone and ochratoxin A in different foodstuffs. The most recent EFSA scientific opinion established a Tolerable Daily Intake (TDI) of 1.2 μg kg-1 body weight per day for nivalenol,5 whose highest mean concentrations are typically observed in oats, maize, barley, and wheat products. In 2018, there were 25 serious notifications for mycotoxin contamination in cereal grains reported via the RASFF portal.6 For these reasons, we focused the method development on cereal-based food, as it is considered a high-risk commodity for mycotoxin contamination.

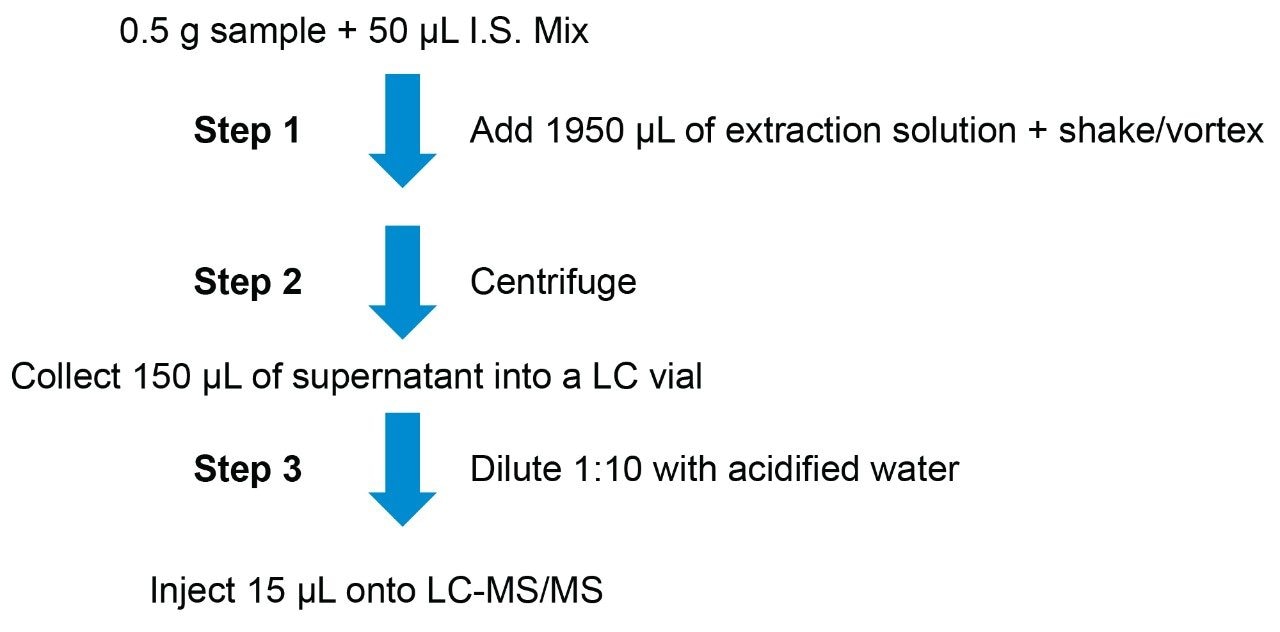
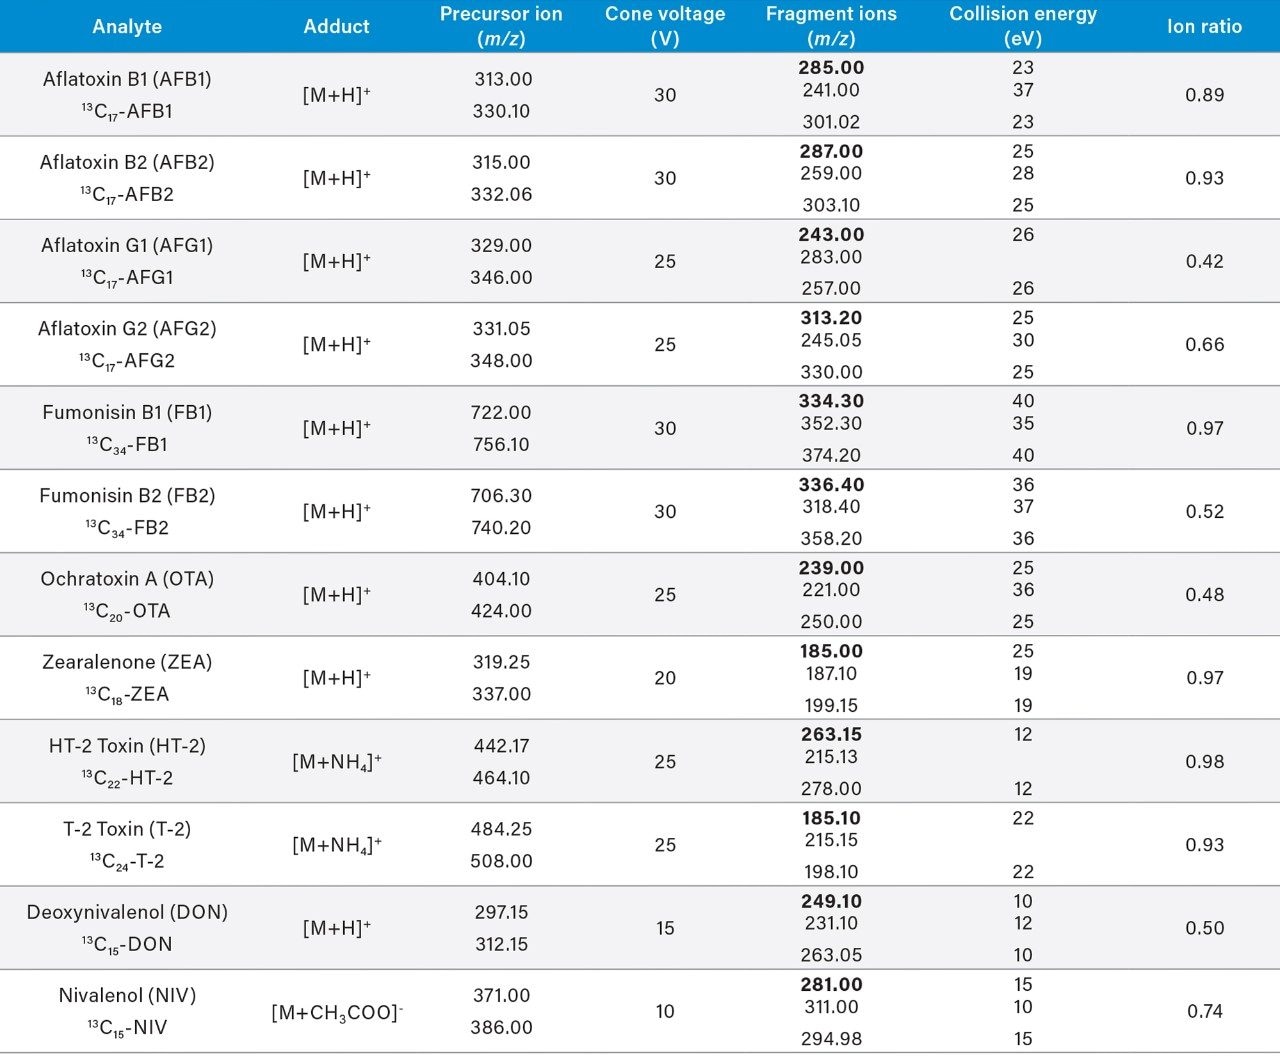
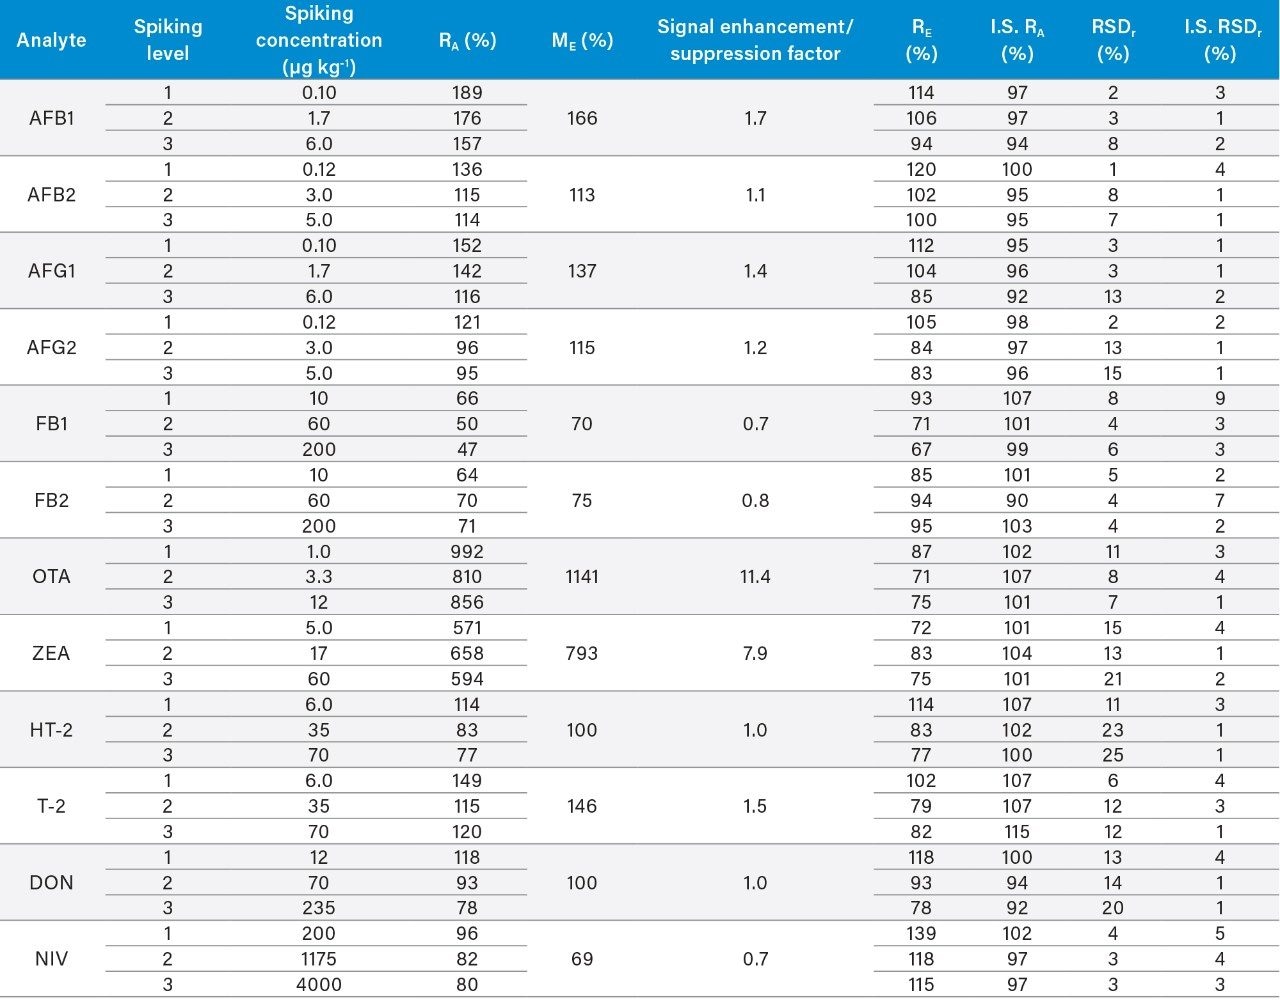
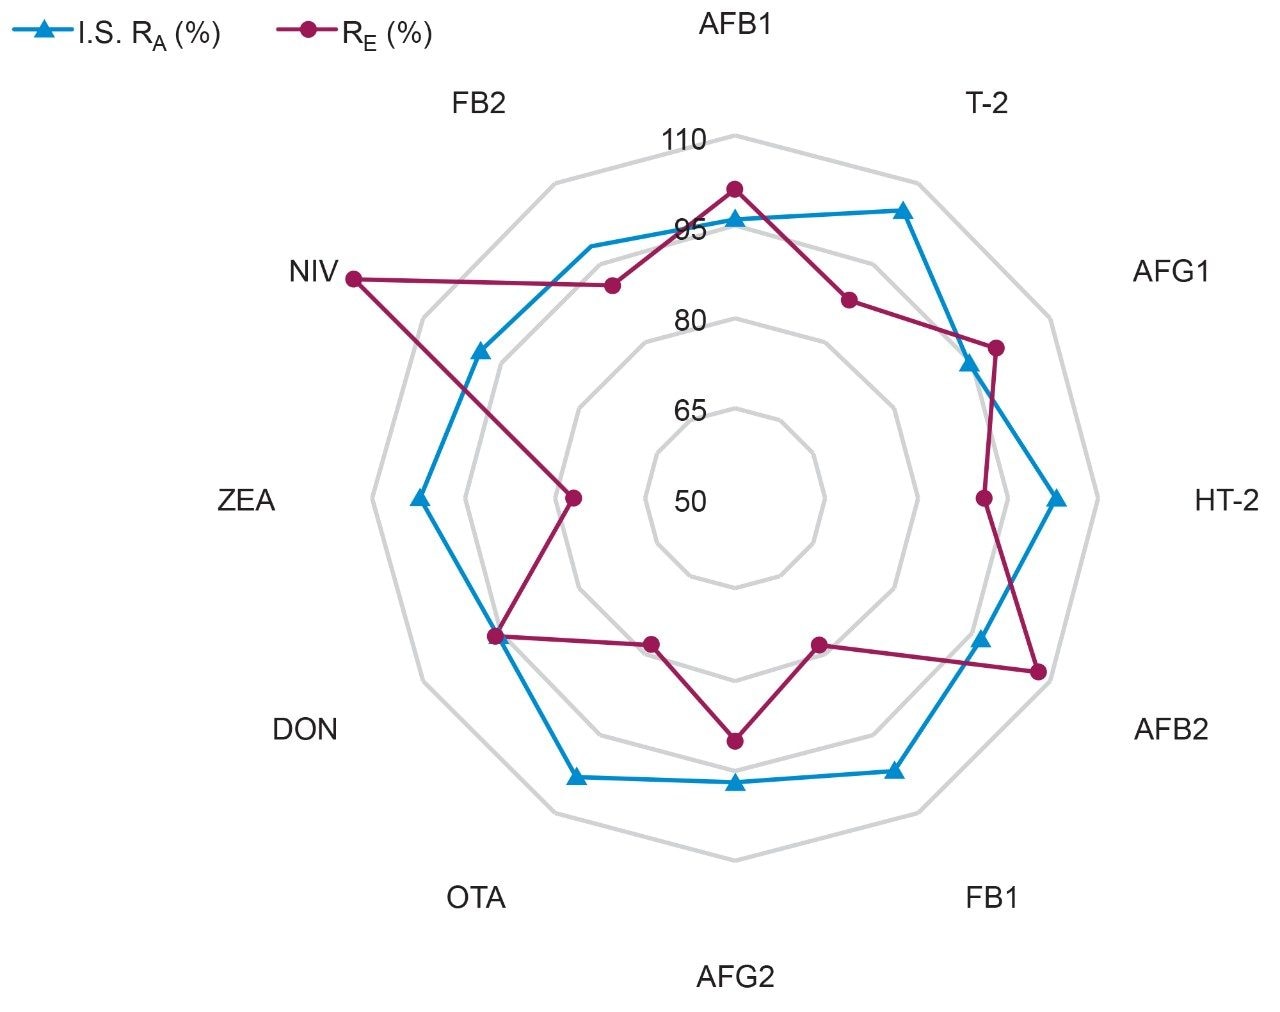
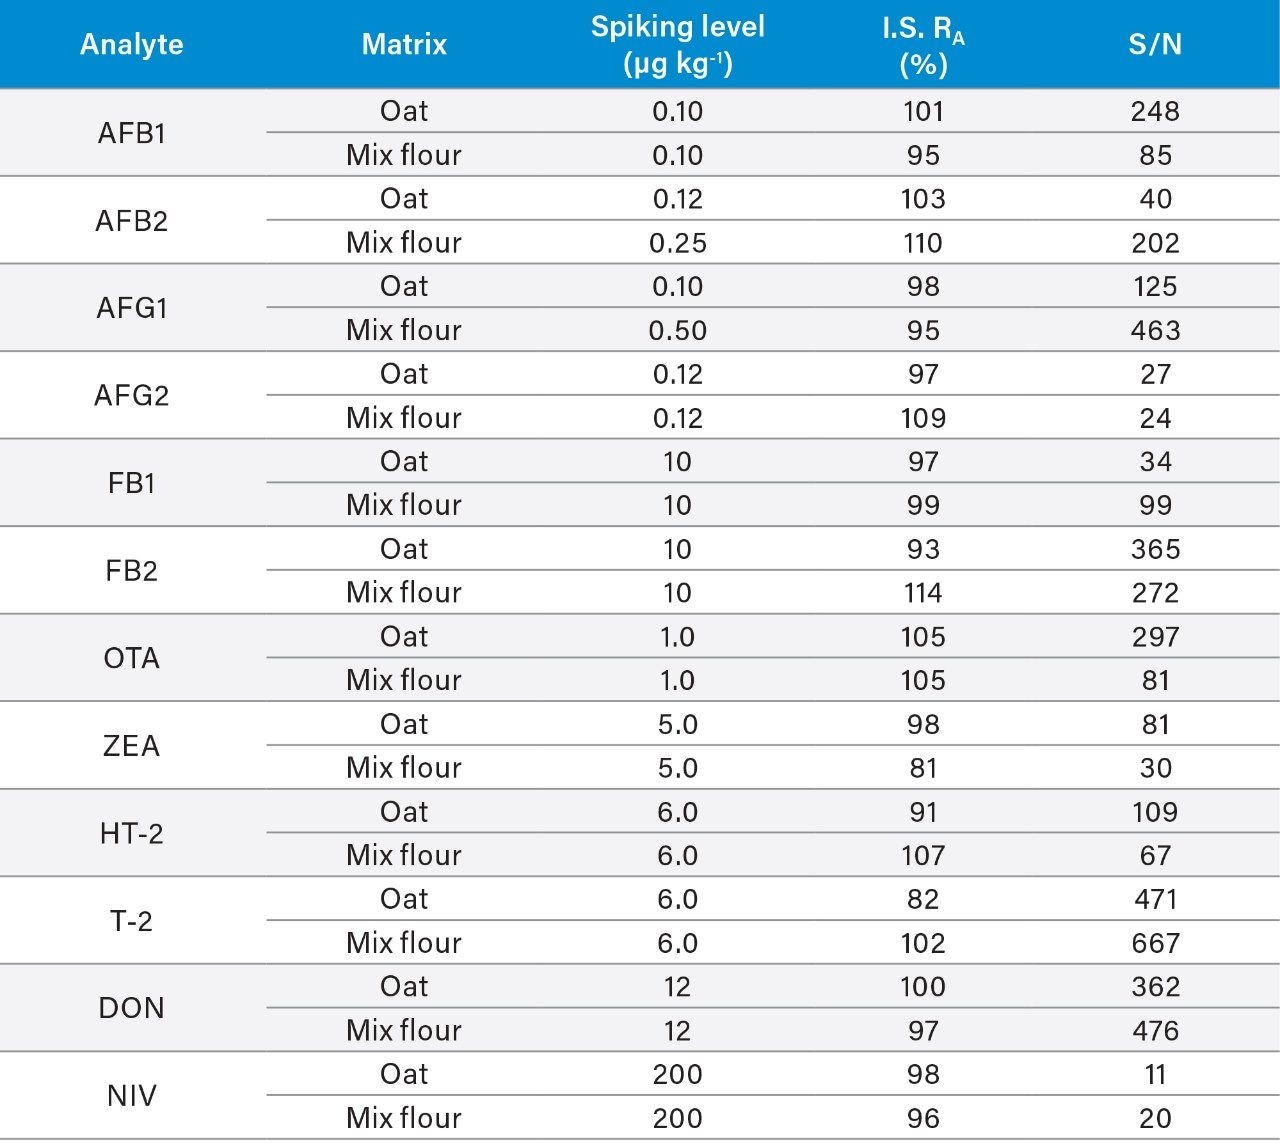
Here we describe the validation of a quantitative multi-mycotoxin method in wheat flour, which was further extended to a range of different cereal-based flours. The Waters Xevo TQ-XS Tandem Quadrupole Mass Spectrometer was chosen because it provides ultimate sensitivity and it allows the analyst to implement a simple sample preparation process, thus reducing the overall analysis time. The use of isotopically labelled internal standards was investigated to achieve better performance compared to the widely adopted external standard or standard addition methods. The analytical procedure was assessed according to criteria described by the amended European Commission Regulation No. 401/2006 and SANTE guidelines.7,8

Experimental

Sample Treatment

Powdered sample material (0.500 ± 0.005 g) was weighed into a 5 mL plastic centrifuge tube and spiked with 50 μL of the Internal Standard Mix. To the mix, 1950 μL of extraction solution (MeCN:H2O 79:20 + 0.75% acetic acid + 0.2% formic acid) was added and the tube was vigorously shaken for 10 seconds and placed in an automatic Vortex mixer for 10 minutes (1300 pulsed speed). After centrifugation at 5000 rpm (5311 g), 150 μL of supernatant was transferred into a 2 mL LC vial, followed by the addition of 1350 μL of diluent (H2O + 0.5% acetic acid + 0.1% formic acid), * resulting in a final dilution factor of 40.

*In the case of particulates being present in the final extract, a filtration step was performed as follows: 1 mL of the supernatant was filtered through a 0.2 μm GHP syringe filter (p/n: WAT097962), and 150 μL of the filtered extract was diluted 1:10 with diluent into a LC vial prior to injection.

Calibration Standard Preparation

Solvent calibration curves containing the 12 target mycotoxins were prepared by mixing and diluting the individual stock solutions, maintaining a solvent composition of H2O:MeCN 95:5 + 0.5% acetic acid + 0.1% formic acid, to generate concentrations relevant to the appropriate MPLs. Eight calibration points (excluding the blank) were used for constructing the calibration series. Matrix-matched calibration curves were prepared according to the same protocol, by dilution with blank wheat flour extract. An aliquot of the mixed I.S. standard solution (10 μL) was added to 400 μL of each level directly into LC vials for both curves.

Figure 1. “Extract-dilute-shoot” sample prep method.

LC Conditions

System:

ACQUITY UPLC I-Class with Fixed-Loop (50 μL) Sample Manager

Column:

ACQUITY UPLC BEH C18 1.7 μm, 2.1 × 100 mm (p/n: 186002352)

Mobile phase A:

Methanol + 0.5% acetic acid + 0.1% formic acid

Mobile phase B:

1 mM ammonium acetate in water + 0.5% acetic acid + 0.1% formic acid

*Strong needle wash:

H2O+20 mM citric acid:MeOH:MeCN:IPA:acetone:DMSO 37:9:18:18:9:9 (900 μL wash volume)

*Weak needle wash:

H2O:MeCN 1:1 + 0.125 mM EDTA (1200 μL wash volume)

Flow rate:

0.4 mL min-1

Injection volume:

15 μL (partial loop with needle overfill, 5 μL needle overfill flush)

Column temp.:

40 °C

Sample temp.:

15 °C

*The appropriate selection of autosampler washing solutions was found to be critical to minimize carryover to an acceptable level, particularly with respect to fumonisin B2 and aflatoxin B1.

LC Gradient:

Time (min)

%A

Curve

0.0

5

0.7

5

6

6.5

50

6

9.5

100

6

12.5

100

6

12.6

5

6

14.0

5

6

MS Conditions

Instrument:

Xevo TQ-XS Tandem Quadrupole Mass Spectrometer

Ionization:

Electrospray (+/-)

Capillary voltage:

+0.5/-0.3 kV

Source offset:

30 V

Source temp.:

150 °C

Desolvation temp.:

500 °C

Desolvation gas flow:

800 L h-1

Cone gas flow:

150 L h-1

Nebulizer gas flow:

7.0 bar

Collision gas flow:

0.15 mL min-1 (argon)

Two transitions were monitored for each analyte, while one transition was used for the respective 13C-labelled isomer (Table 1). Cone voltages and collision energies were optimized via a manual tuning during a combined infusion of different standard solutions containing individual analytes with the gradient composition at elution. Source voltages, gases flow, and temperatures were optimized based on the least sensitive compounds. The data were acquired using MassLynx Software v4.2 and processed by TargetLynx XS Application Manager.

Table 1. MRM transitions of the analytes and respective 13C-isotopically labelled analogs. Quantification transitions are in bold.

Results and Discussion

Linearity, Limit of Detection, and Quantitation (LOD and LOQ)

The linearity of the method was verified across the range of concentrations tested using both the external and internal standardization approaches. A weighting factor (1/x) was used to construct the calibration curves.

For the internal standard approach, the ratio, [analyte response/I.S. response], was plotted against the ratio [analyte concentration/I.S. concentration]. All regression equations showed coefficients of determination (R2) between 0.9941 and 1.0000, and percentage residuals lower than 20% across the full calibration range. For the purpose of this study, the lowest point of the solvent calibration curve was adopted as the instrument limit of quantitation (LOQ). Whereas, the lowest spiking level, within the linear calibration range, was adopted as the method LOQ. Subsequently, the method LOD and LOQ were verified following Eurachem guidelines9 by multiplying the “adjusted” standard deviation of 10 different blank samples by a factor of either three and 10, respectively. In the case where no signal was obtained from the blank matrix, 10 independent replicate measurements of the wheat flour sample spiked with the lowest concentration of the linear range were used. Additionally, both the concentrations equivalent to the instrumental and method LOQ were shown to have signal-to-noise (S/N) ratios greater than 10. The lowest detection capability was recorded for the aflatoxin compounds, where LODs (determined from solvent standards) were shown to be 0.75–0.93 pg mL-1 (equivalent to 11–14 fg on column). For the other target mycotoxin compounds, the Xevo TQ-XS was able to achieve LODs at concentrations ranging between 0.0075 and 1.5 ng mL-1 (equivalent to 0.1 to 22.5 pg on column).

The excellent sensitivity of the Xevo TQ-XS allows the analyst to perform a simple solvent extraction and dilution of the cereal matrix without the need for time-consuming pre-concentration or cleanup steps, thus improving the overall lab efficiency and, additionally, reducing the consumption of solvents.

Trueness, Intra-Day Repeatability, and Matrix Effects

Percentage recovery was employed as an estimation of method trueness, as determined using matrix fortified prior to extraction. A wheat flour sample was spiked with the 12 target mycotoxins at three different concentration levels, encompassing the method LOQs and bracketing the relevant MPLs for the majority of compounds.

Table 2. Linearity, limit of detection and quantitation, and permitted limits of the tested mycotoxins in wheat flour.

Recoveries (%) and relative standard deviation (RSDr) were obtained under intra-day repeatability conditions from the analysis of seven independent replicates at each concentration level. IUPAC distinguishes between recovery and apparent recovery (RA).11 The RA, also defined as process efficiency (PE), denotes the ratio of an observed value obtained from an analytical process via a calibration curve, divided by a reference known or theoretical value. This is also referred to as overall or total recovery of a method. The term recovery (RE) itself is used to indicate the yield of a preconcentration or extraction stage of an analytical process for an analyte divided by the amount of analyte in the original sample. RA is the result of the contribution of both RE and matrix effect (ME):

RA (%) = (C1 – C0) / Cs * 100 ME (%) = bM / bS * 100 RE (%) = RA / ME * 100

Where C1 is the calculated concentration of the analyte after spiking a sample with a concentration CS; C0 is the calculated concentration of the analyte in the un-spiked sample; and bM and bS are the slopes of the matrix-matched and solvent calibration curves, respectively. Apparent recovery, recovery, and matrix effect are all shown in Table 3. RA was also calculated using the internal standard method (I.S. RA). Figure 2 indicates that when the internal standard correction is used, the apparent recovery (averaged between the three spiking levels), comprehensive of matrix effect and analyte losses, lies within a narrow range of 95–105%.

Table 3. Method accuracy parameters and matrix effects obtained from the validation data on wheat flour matrix. Spiking level 1 = method LOQ; spiking level 2 and 3 were within the linear range.
Figure 2. RADAR-plot showing the comparison between the recovery of the method (exclusively related to the yield of the sample preparation process) and the apparent recovery using the internal standard method, which is comprehensive of both recovery and matrix effect.

Recoveries and RSDr meet the performance criteria set by annex II of the European Commission Regulation No. 519/2014 amending EC Regulation No. 401/2006,12 although, as expected, the internal standard method was found to improve method trueness and precision (RSDr ≤9% in all cases).

Throughout the repeatability study, Gaussian chromatographic peaks with a retention time (RT) exceeding at least 2x analytical column void volume (Figure 3) were obtained for the target mycotoxins. RT deviations were found to be within the acceptable threshold of ±0.05 minutes. The RT and peak shape of 13C-isotopically labeled mycotoxins analogues used for internal standardization are perfectly matched to those of the target compounds. The ion ratios in unknown samples were within ±30% of those calculated from the average of the calibration standard within the same sequence.

Figure 3. Chromatographic profile of the fifth point of the matrix-matched calibration curve (no smoothing applied). The insert shows the calibration curve of ochratoxin A in solvent and in matrix, highlighting the massive matrix  enhancement affecting this compound.

The external standardized data highlights the significance of the challenge of variable matrix effects previously reported within mycotoxin analysis. In this case, matrix effects ranging from >30% signal suppression for nivalenol, to >1000% signal enhancement for ochratoxin A were encountered. This finding clearly justifies the use of the isotopically labeled internal standards to aid with quantitative accuracy, and to negate the effects of different matrices, thus allowing the use of a calibration curve prepared using solvent standards.

In order to reduce the cost of the analysis, one can opt for the addition of the internal standard mix to the final diluted extract, directly into the LC vial (i.e., the addition of 10 μL to 400 μL of diluted extract would result in a five-fold reduction of internal standard consumption). In this way it is also possible to scale-up the entire sample preparation process, for example by weighing more sample and using a higher volume of extraction solution, keeping the ratio sample extraction solvent/sample weight equal to four. The drawback of adding the IS at the end of the process is that the method performance happens to be lower, as the IS will not correct for analyte losses.

In the absence of access to internal standards, the construction of appropriate matrix-matched calibration curves can also be performed to achieve reliable quantitation. However, it should be noted that true “blank” reference materials are not always readily available, especially when dealing with a wide variety of commodities.

The retail purchased wheat flour sample used for the validation study had other declared additives, including vitamins (niacin and thiamin) and calcium carbonate within the label description. Despite the presence of these additives, excellent selectivity and linearity (100-fold linear range, or more) was still achieved for all the target mycotoxins regardless of whether external or internal standard calculation was used, as illustrated in Table 2.

Extension of the Method to other Matrices

In addition to wheat flour, the method was applied to oatmeal (ground oats) and to a gluten-free mix of different flours (rice, potato, tapioca, maize, and buckwheat, including the additives mono-calcium phosphate, sodium bicarbonate, and xanthan gum). All samples were purchased from a local market and screened prior to analysis. Some samples were found to contain trace levels of T-2 toxin and deoxynivalenol but were well below the permitted limits. Each sample was spiked in triplicate with the 12-mycotoxin mixed standard at the LOQ concentration calculated in wheat flour. The I.S. (50 μL) was added prior to extraction and the sample was analyzed according to the analytical procedure described in the experimental section.

Recovery values comparable to those obtained for the primary matrix (wheat) were observed in the other flours with respect to all the analytes at the LOQ levels, with S/N ratios >10. These results confirm the analytical selectivity even in the presence of a diverse variety of ingredients and additives.

Table 4. Apparent recovery data of the method at LOQ level in different matrices using the internal standard quantitation approach. Signal-to-noise (S/N) ratios of the quantitative transition were calculated considering peak width at half height (signal) and peak-to-peak with no extra processing (noise).

Conclusion

  • The Xevo TQ-XS method is considered as “fit-for-purpose” for the quantitative analysis of EU regulated mycotoxins in dried cereal grain commodities such as wheat, oats, maize, rice, and buckwheat-based food products.
  • The excellent sensitivity of the Xevo TQ-XS and the selectivity of the MRM acquisition mode, made the extreme simplification of the sample treatment procedure possible, thus reducing the overall analysis time and reagent consumption.
  • The incorporation of 13C-labelled internal standards within the analytical workflow leads to enhanced method performance and is therefore recommended as an efficient approach to correct for both matrix effects associated with mycotoxin analysis and the inevitable analyte lossesduring the sample preparation. Internal standardization allows the analyst to avoid the use of matrix-matched calibration and work with solvent calibration curves for accurate quantitation. The addition of I.S. can either be performed prior to or post extraction, depending on the specific analytical requirements.
  • Furthermore, with the use of internal standards, the method was found to be potentially transferable to a more diverse range of commodities (including dried spices).

References

  1. Hussein, H. S.; Brasel, J. M. Toxicity, Metabolism, and Impact of Mycotoxins on Humans and Animals. Toxicology, 2001. DOI: 10.1016/S0300-483X (01)00471-1.
  2. Bennett, J. W.;Klich, M. Mycotoxins. Clinical Microbiology Reviews, 2003. DOI: 10.1128/ CMR.16.3.497-516.2003.
  3. Sulyok, M.; Berthiller, F.; Krska, R.;Schuhmacher, R. Development and Validation of a Liquid Chromatography/Tandem Mass Spectrometric Method for the Determination of 39 Mycotoxins in Wheat and Maize. Rapid Communications in Mass Spectrometry, 2006. DOI: 10.1002/rcm.2640.
  4. European Commission Regulation No. 1881/2006 of 19 December 2006 Setting Maximum Levels for Certain Contaminants in Foodstuffs. Annex, section 2.
  5. Scientific Opinion on Risks for Animal and Public Health Related to the Presence of Nivalenol in Food and Feed. EFSA Journal, 2013;11(6):3262.
  6. https://webgate.ec.europa.eu/rasff-window/portal/?event=searchResultList (accessed on July 17, 2019).
  7. European Commission Regulation No. 401/2006 of February 23, 2006 Laying Down the Methods of Sampling and Analysis for the Official Control of the Levels of Mycotoxins in Foodstuffs.
  8. SANTE/12089/2016. Guidance Document on Identification of Mycotoxins in Food and Feed. Implemented by 01/01/2017.
  9. B. Magnusson and U. Örnemark (eds.) Eurachem Guide: The Fitness for Purpose of Analytical Methods – A Laboratory Guide to Method Validation and Related Topics, (2nd ed. 2014). ISBN 978-91-87461-59-0.
  10. European Commission Recommendation No. 2013/165 of March 27, 2013 on the Presence of T-2 and HT-2 Toxin in Cereals and Cereal Products. 
  11. Burns, D. T.; Danzer, K.; Townshend, A.Use of the Terms “Recovery” and “Apparent Recovery” in Analytical Procedures. Pure Appl. Chem. 2002, 74 (11) 2201–2205.
  12. European Commission Regulation No. 519/2014 of May 16, 2014 amending Regulation (EC) No. 401/2006 as Regards Methods of Sampling of Large Lots, Spices and Food Supplements, Performance Criteria for T-2, HT-2 Toxin and Citrinin and Screening Methods of Analysis.

720006685, Revised March 2021

Volver arriba Volver arriba