Improved HPLC-UV Separation of Common Beta-2 Adrenergic Receptor Agonists
Abstract
Beta-2 Adrenergic receptor agonists (BAs) are commonly prescribed medications used to treat Chronic Respiratory Diseases (CRDs). BAs have been amongst the top ten prescribed drugs for several years now. Here, we developed a method that reproducibly separated several types of BAs and BA impurities in under 14 minutes. We investigated the effect of pH on analysis. Further, we demonstrated the high pH stability and batch consistency of MaxPeak™ High Performance Surfaces (HPS) Technology.
Benefits
- Single method that offers baseline separation of a diverse panel of BAs and their impurities
- Basic conditions used in this method reduce tailing by up to 65%
- Method demonstrates the dependability and reproducibility of MaxPeak™ HPS Technology Columns and Systems in high pH conditions
Introduction
Noncommunicable diseases account for 41 million deaths globally. Of that 41 million, 10% are because of chronic respiratory diseases (CRDs).1 Asthma and chronic obstructive pulmonary disease (COPD) are recognized as CRDs.2 While CRDs are not curable, maintenance medications such as Beta-2 Adrenergic receptor agonists (BAs) are available to help improve symptoms.3 Further, there are three classes of BAs: short-acting B2 agonists (SABAs), Long-acting B2 agonists (LABAs), and ultra-long-acting B2 agonists (ULABAs). Given the prevalence of CRDs it is no surprise that BAs, such as albuterol, have been on the top 10 list of most filled prescription medication for several years.4
Some current LC methods for BAs mention noticeable tailing when analyzing these compounds under acidic reversed phase conditions.5,6 However, there is evidence that high pH conditions may improve the overall chromatography for BAs.7 Further, there is a lack of full panel methods including a variety of BAs. Therefore, we developed a high pH reversed phase method for the separation of a BAs panel. The analysis of 6 BAs and some of their impurities is complete in under 14 minutes with reproducible, linear, and sensitive results. In addition, different column sorbent batches were compared using this method demonstrating the reliable and stable performance of Premier Columns and Systems with MaxPeak™ High Performance Surfaces (HPS) Technology, especially under high pH conditions.
Experimental
Method of Separation Sample Description
Various BAs were purchased to establish a full panel containing SABAs, LABAs, and ULABAs. Levalbuterol was sourced from Sigma Aldrich (Allentown, PA). Pirbuterol was purchased from Toronto Research Chemicals (Toronto, ON). Formoterol, Indacaterol, Olodaterol, and Vilanterol were obtained from Cayman Chemical (Ann Arbor, MI). Terbutaline was sourced from Santa Cruz Biotechnology (Dallas, TX).
Each standard was weighed into a 20 mL scintillation vial and diluted with Deionized Water: Acetonitrile (95:5). Salt factors and purities were taken into consideration. Stock concentrations varied from 0.5 mg/mL to 1 mg/mL, depending on standard solubility. Stocks were stored at 2 °C–8 °C and allowed to equilibrate to ambient temperature prior to analysis.
Stocks were diluted and combined to make a BAs Mix sample. Each Analyte was at a 100 µg/mL concentration.
Linearty and Impurities Sample Description
Linearity and Impurities standards were purchased from European Directorate for the Quality of Medicines & HealthCare (EDQM) (Strasbourg, FR). The standards purchased were the following: Formoterol, Formoterol Impurity I, Salbutamol, Salbutamol Impurity B, Salbutamol Impurity D, Salbutamol Impurity F, Salbutamol Impurity G, Terbutaline, and Terbutaline Impurity C.
Each standard was weighed into a 20 mL scintillation vial and diluted with Deionized Water: Acetonitrile (95:5). Salt factors and purities were taken into consideration. Stock concentrations varied from 0.1 mg/mL to 1 mg/mL, depending on standard solubility. Stocks were stored at 2 °C–8 °C and allowed to equilibrate to ambient temperature prior to analysis. Stocks were diluted and combined to make various curve points for each main analyte. For impurities analysis, analytes and their respective impurities were combined. Each impurity was at a 10 µg/mL concentration, while analytes were at a 100 µg/mL concentration.
LC Conditions
|
LC system: |
Arc™ Premier LC System |
|
Detection: |
Waters™ 2998 Photodiode Array Detector, 276 nm |
|
Column(s): |
XBridge™ Premier BEH™ C18, 130 Å, 4.6 x 100 mm, 2.5 μm |
|
Column temperature: |
40 °C |
|
Sample temperature: |
Ambient |
|
Injection volume: |
10 μL |
|
Flow rate: |
1.0 mL/min |
|
Mobile phase A: |
Deionized Water with 10 mM Ammonium Formate, pH 10, adjusted using Ammonium Hydroxide |
|
Mobile phase B: |
Acetonitrile |
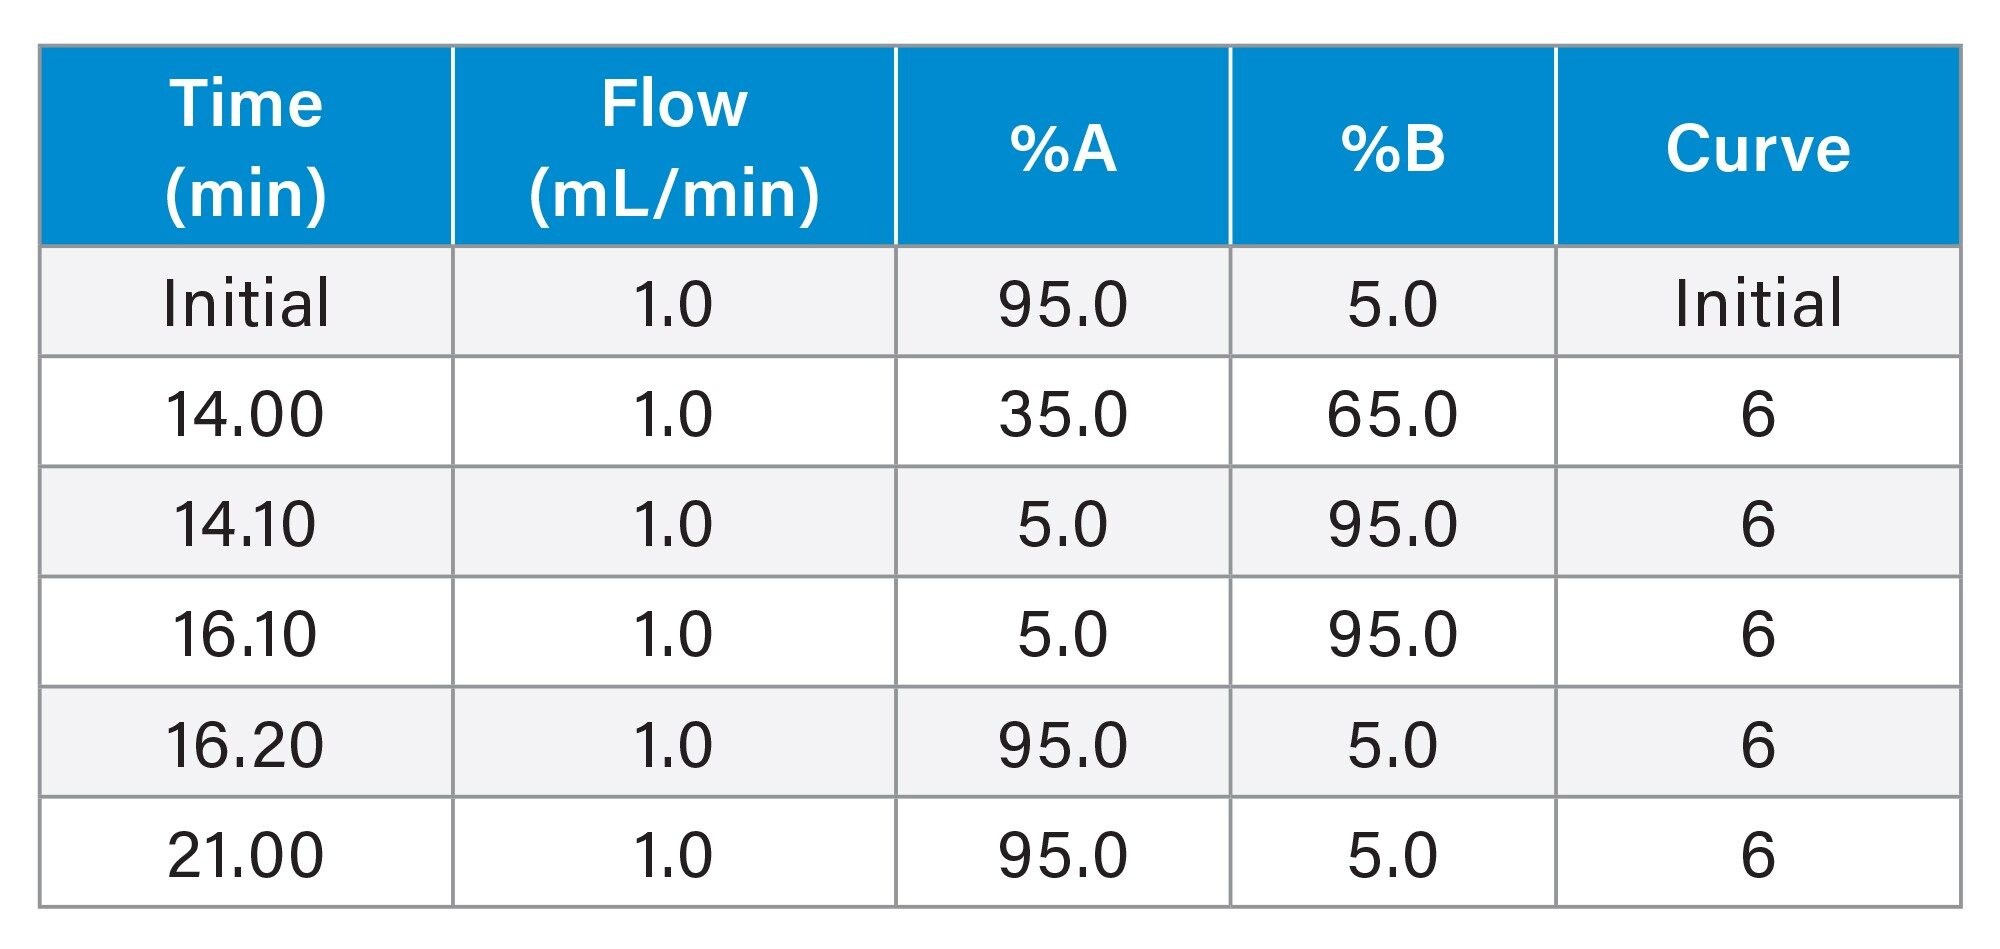
Gradient Table
Data Management
|
Chromatography software: |
Empower™ 3.7.0 |
Results and Discussion
Method of Separation Results
This method was reproducible in the retention and separation of BAs. Over the course of 12 injections of the BAs Mix sample, the %RSD for area, retention time, and tailing for each analyte was <1% (Tables 1, 2, and 3). Below, an overlay chromatogram of the 12 injections provides a clear picture of the method’s performance (Figure 1).
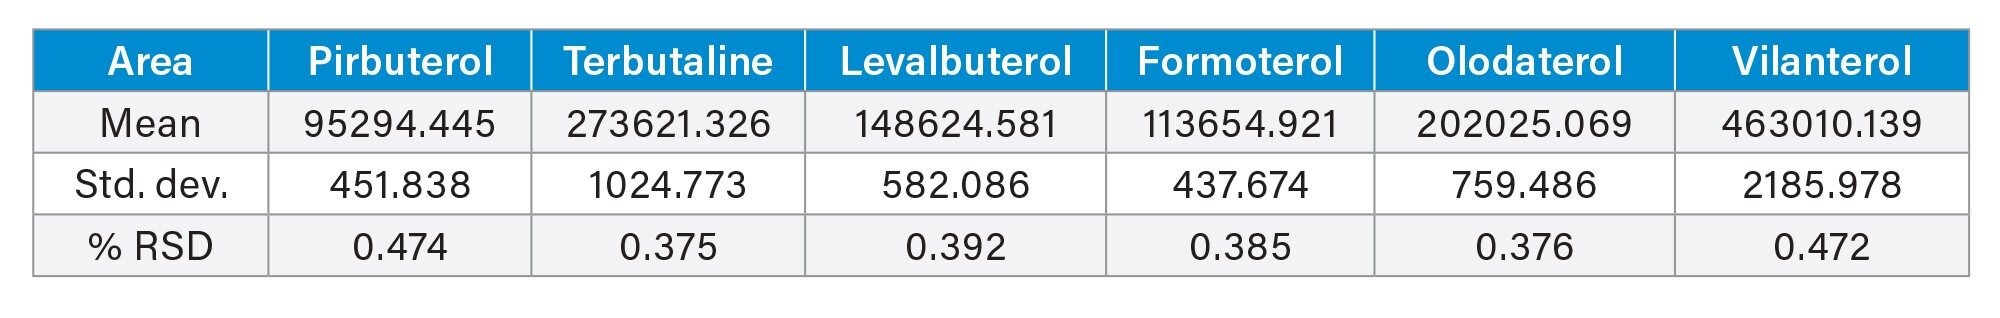 Table 1. Table containing data for the area across 12 injections for the BAs Mix sample.
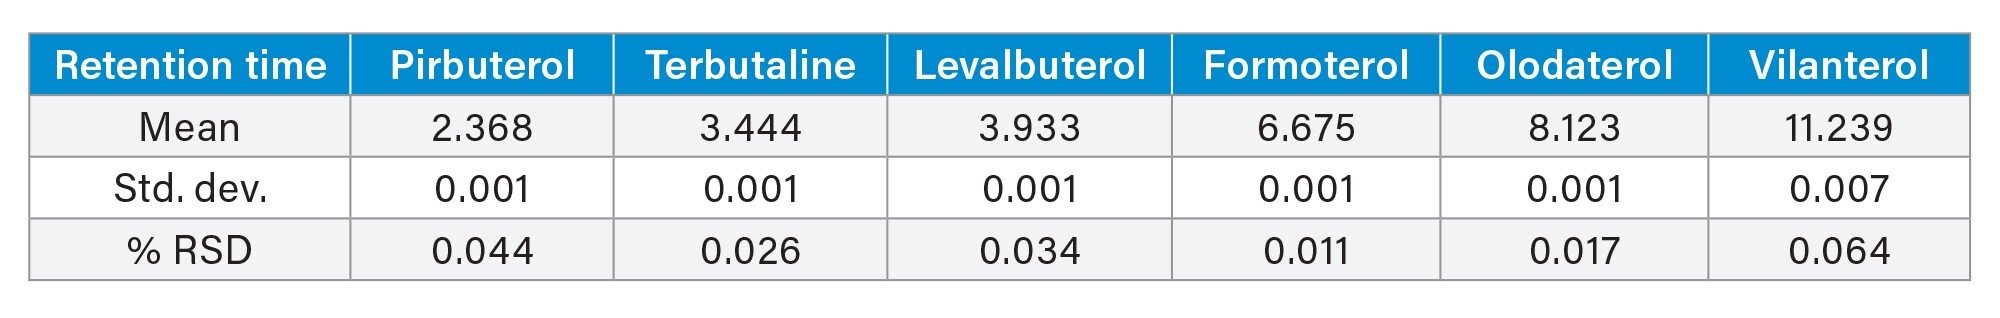 Table 2. Table containing data for the retention time across 12 injections for the BAs Mix sample.
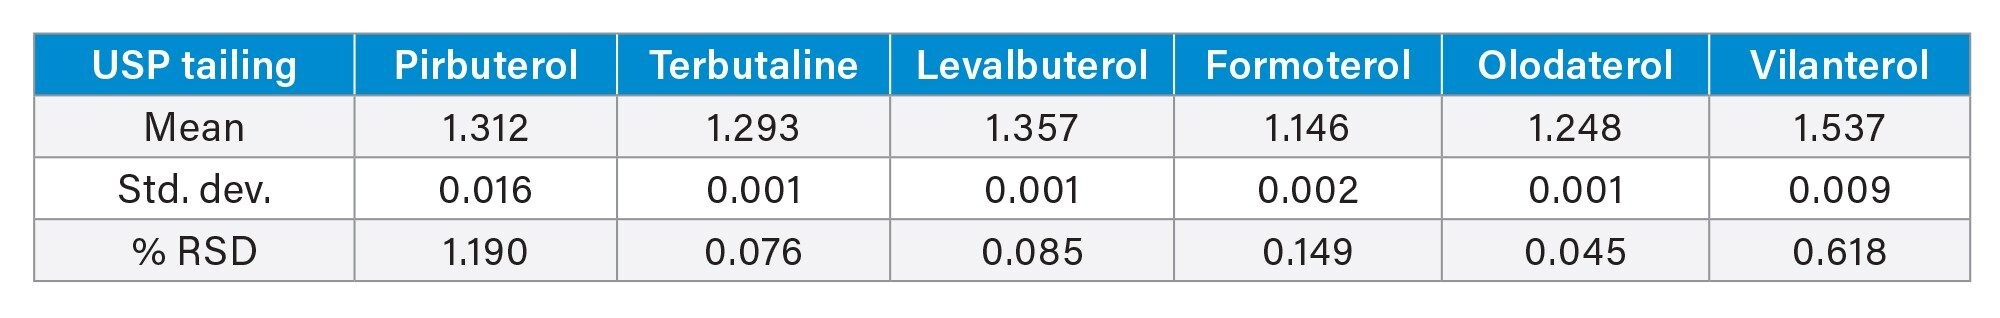 Table 3. Table containing data for the tailing across 12 injections for the BAs Mix sample.
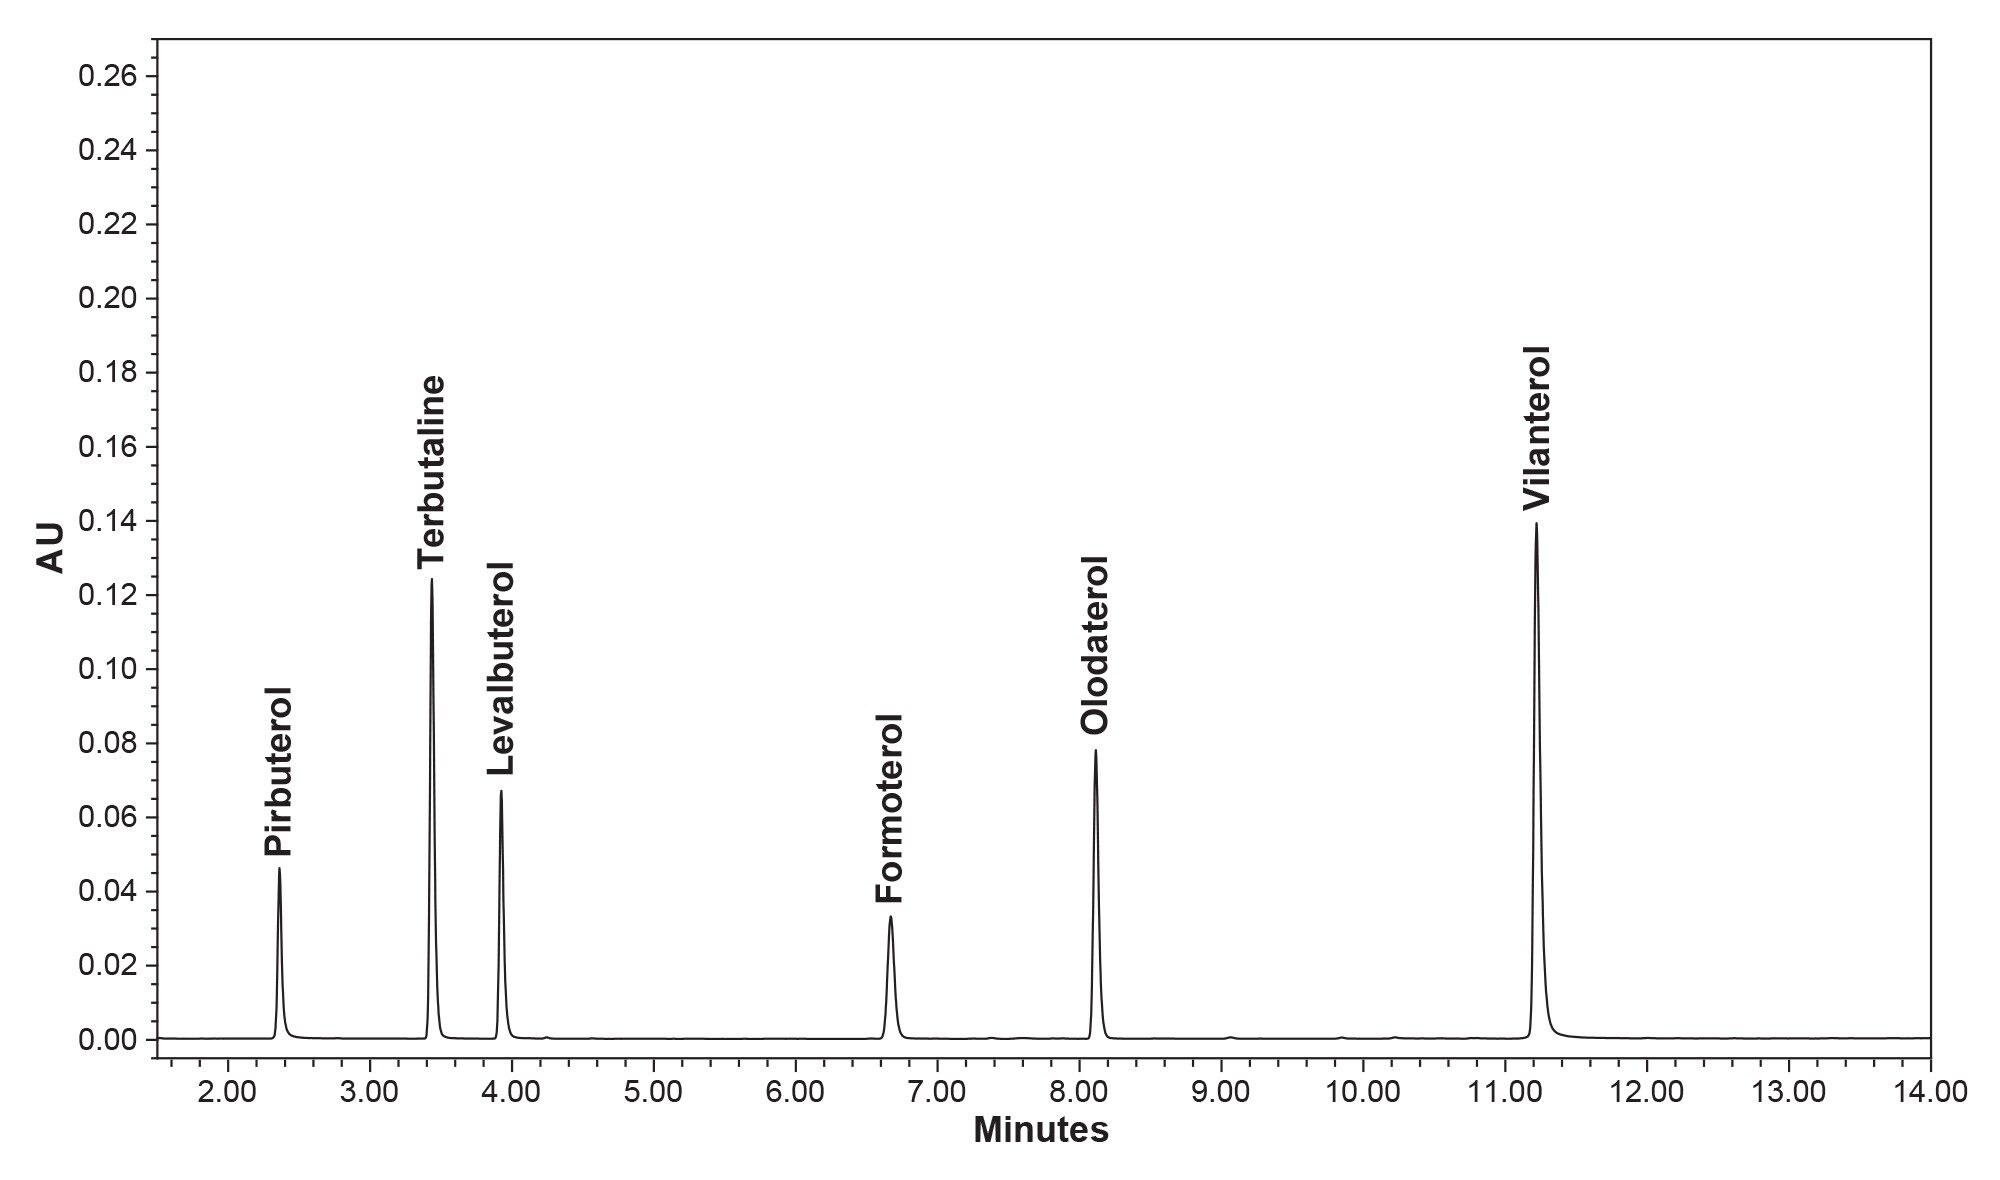 Figure 1. Overlay chromatogram of 12 injections for the BAs Mix sample.
Effects of pH
It is well known that pH has a notable effect on most reversed phase applications.7,8 To investigate its effect on BAs we analyzed the same BAs Mix sample using a basic and acidic mobile phase A. The basic mobile phase used was deionized water with 10 mM ammonium formate, pH 10, adjusted using ammonium hydroxide. The acid mobile phase was deionized water with 10 mM ammonium formate, pH 3, adjusted using formic acid.
Under basic conditions, tailing improves amongst the analytes, and baseline resolution is achieved for levalbuterol and terbutaline, the critical pair in the acidic conditions. There is up to a 65% decrease in tailing when switching to the basic method. Below is a data table and chromatogram representative of the performance of both methods (Figure 2a and 2b, Tables 4 and 5).
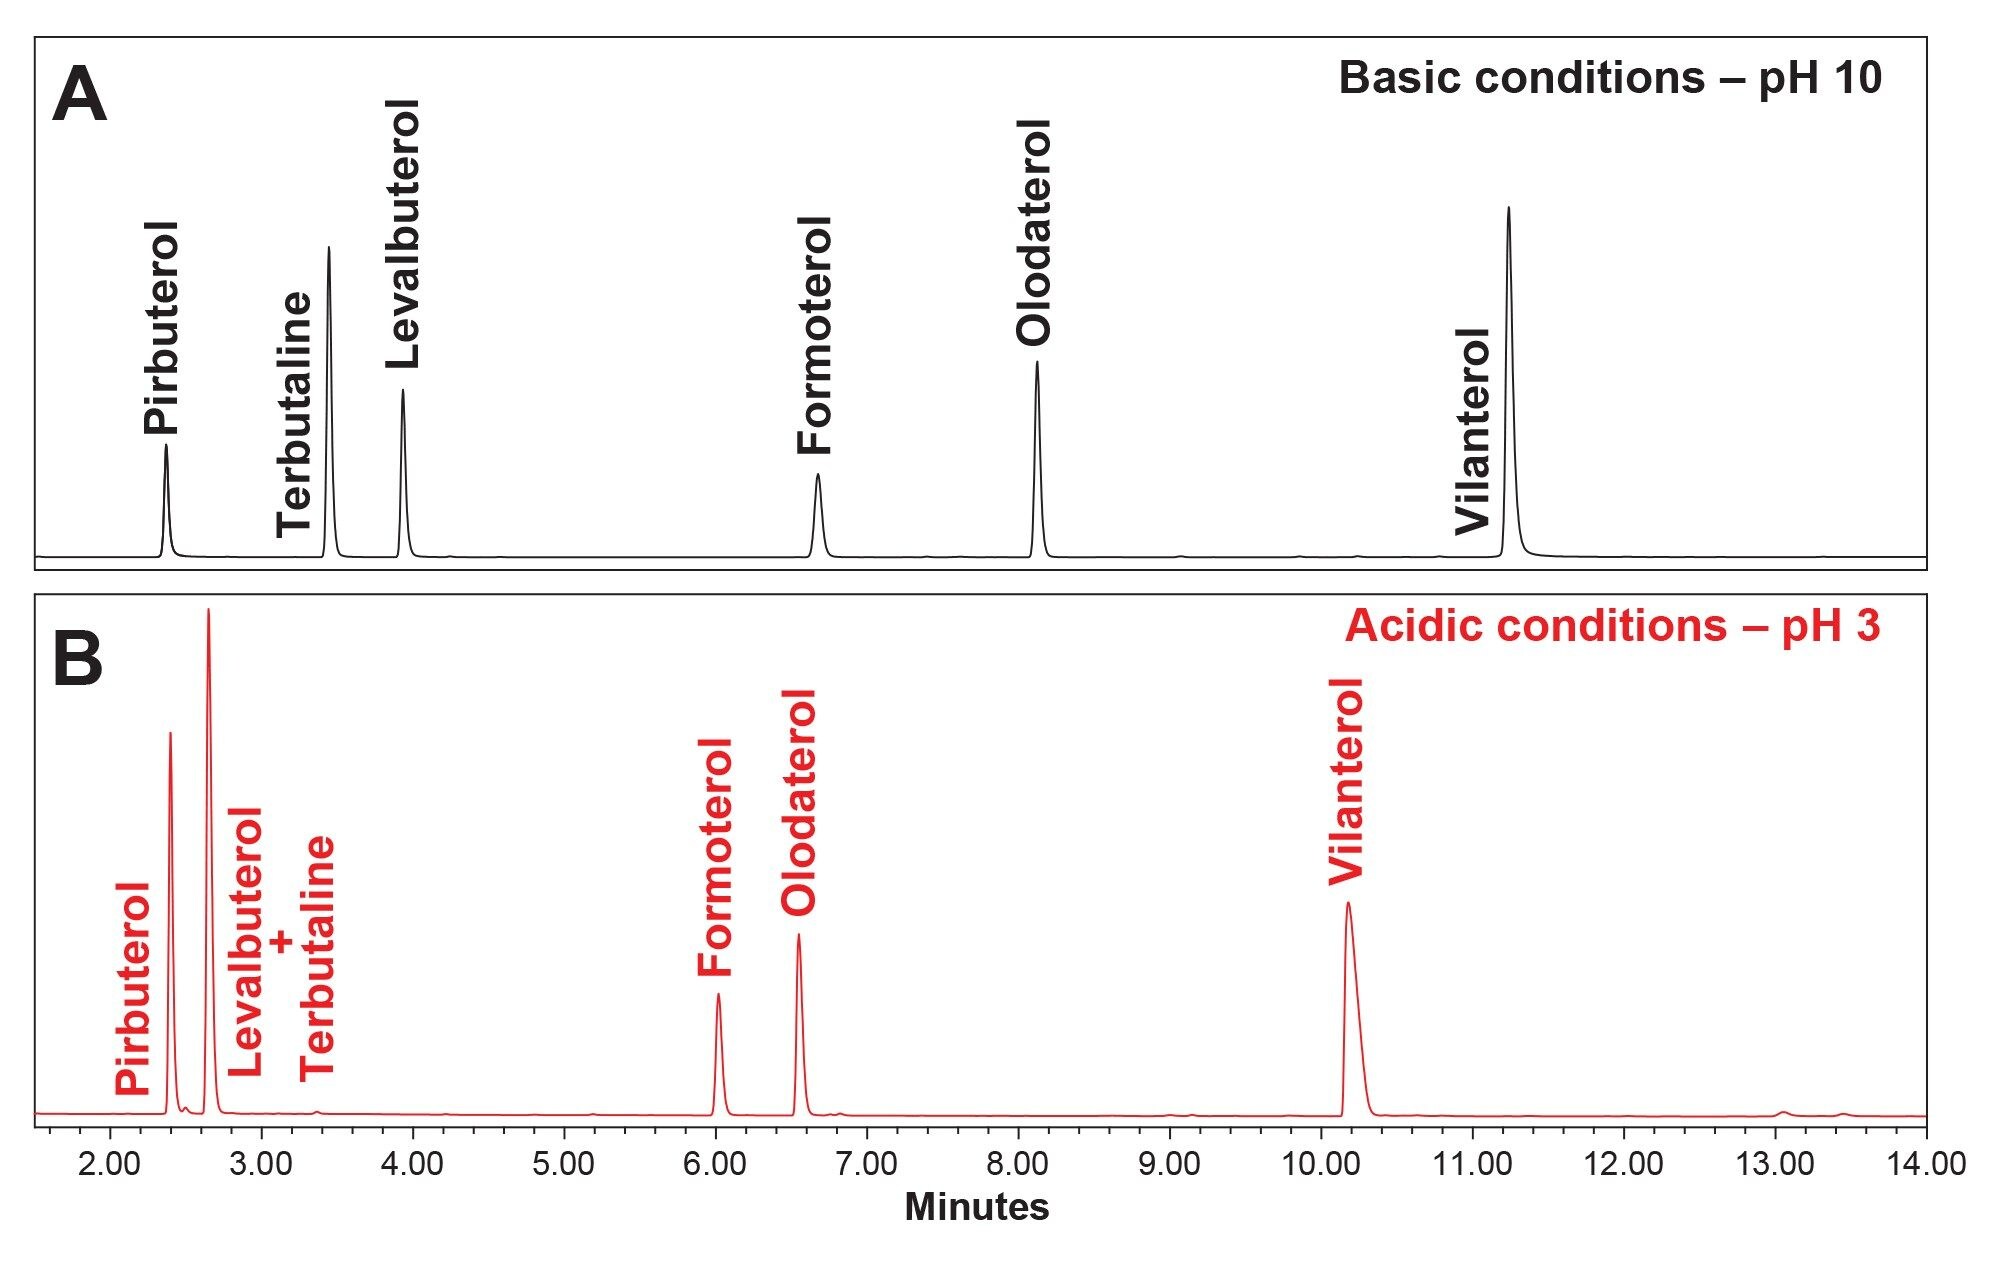
Figure 2a. A representative chromatogram detailing the performance of the basic method conditions for the BAs Mix sample.
Figure 2b. A representative chromatogram detailing the performance of the acidic method conditions for the BAs Mix sample.
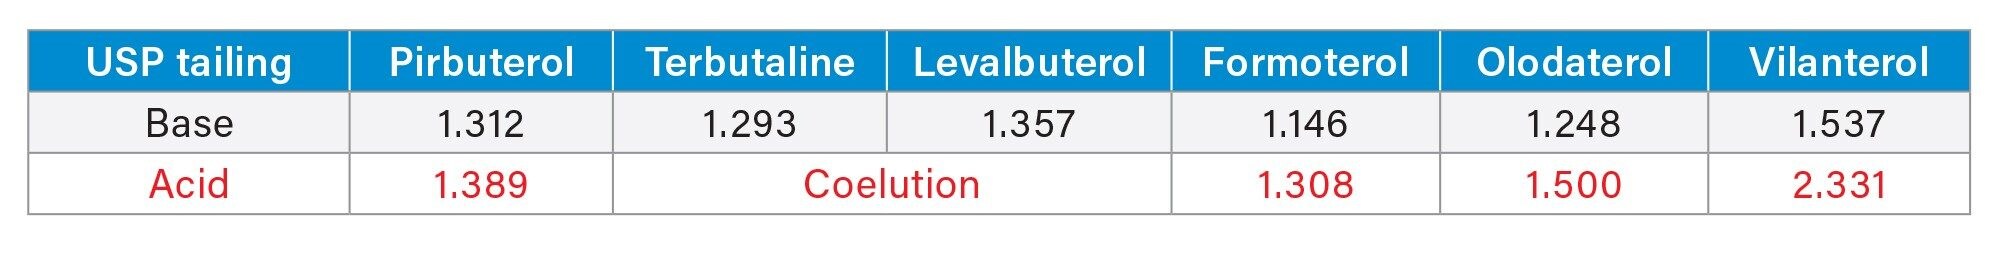 Table 4. Data detailing the improvements in the tailing between the two methods.
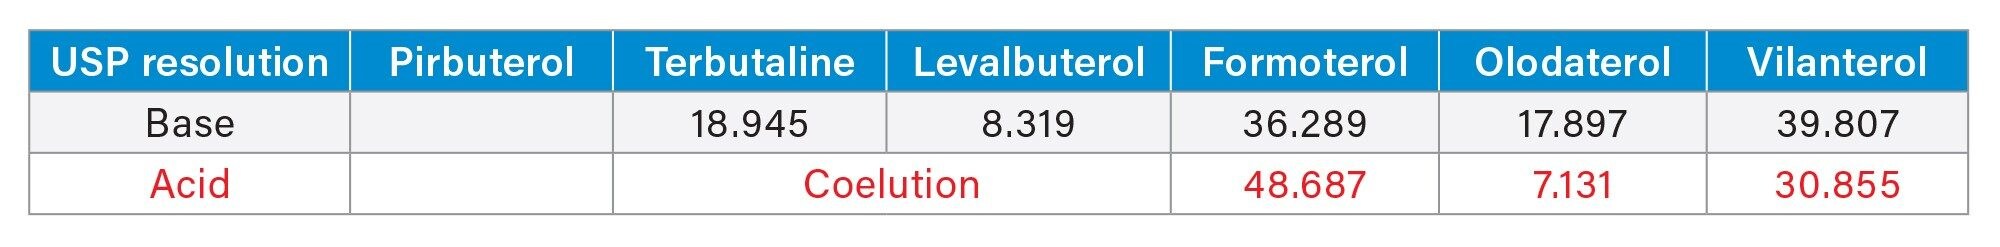 Table 5. Data detailing the improvements in the resolution between the two methods.
Linearty Results
Each of the EDQM analytes were investigated for their linearity. The linearity for each analyte was calculated using a linear fit through the calibration features in Empower 3. Below, the quantitative capability of this method is clear, suggesting its use in quality control testing (Figures 3a through 3c).
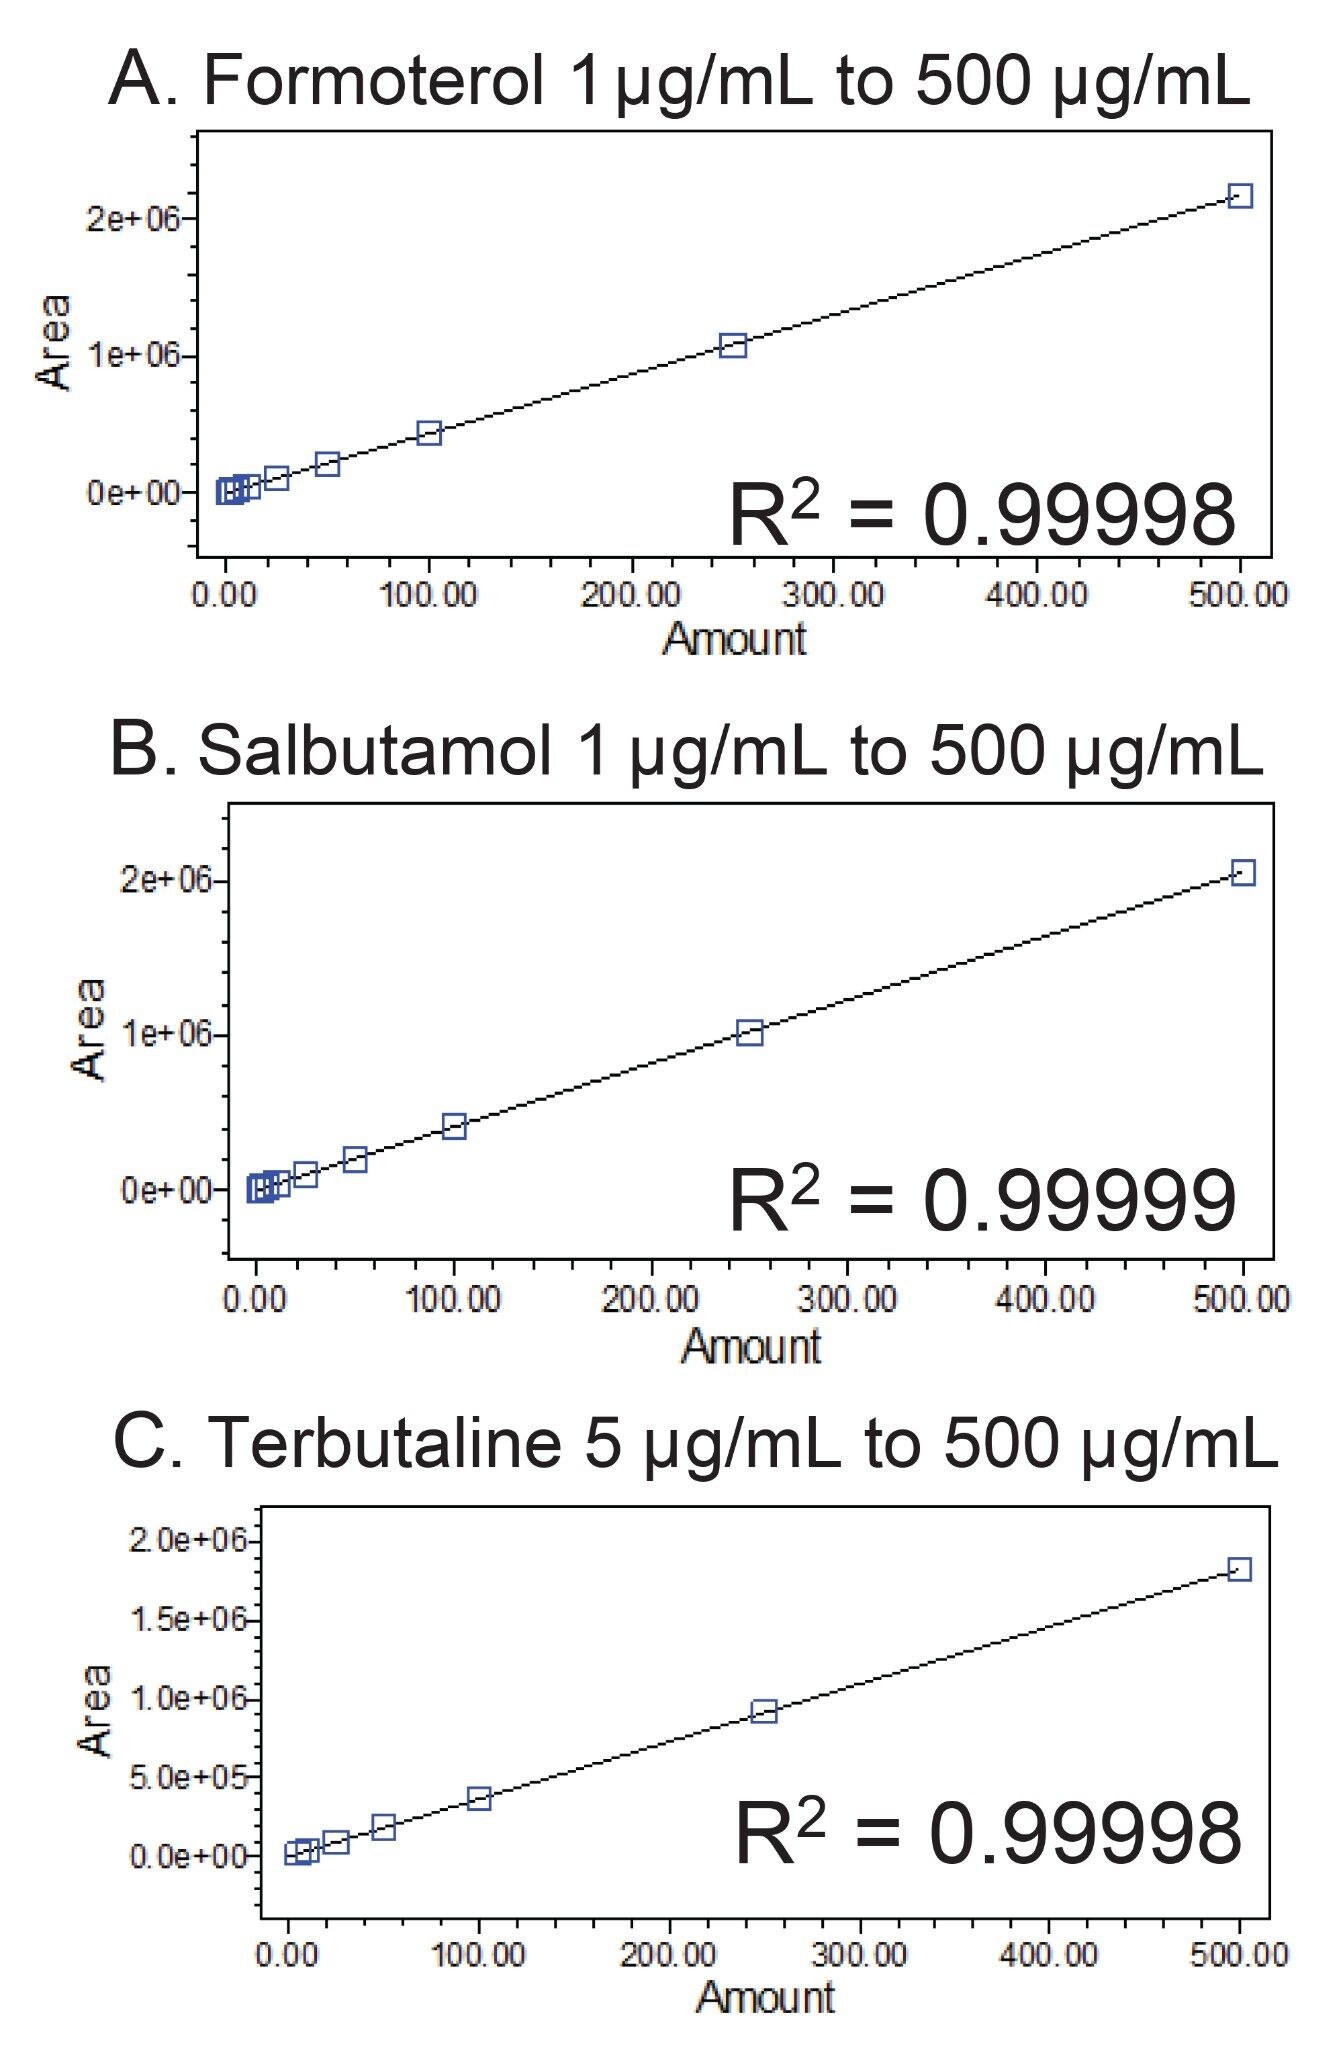
Figure 3a. The calibration curve for Formoterol spanning from the concentrations of 1 μg/mL to 500 μg/mL.
Figure 3b. The calibration curve for Salbutamol spanning from the concentrations of 1 μg/mL to 500 μg/mL.
Figure 3c. The calibration curve for Terbutaline spanning from the concentrations of 5 μg/mL to 500 μg/mL.
Impurites Analysis Results
This method was also investigated for its impurities analysis suitability. The EDQM analytes and their respective impurities were combined so that impurities were at 10% of the main analyte concentration. Below, this method demonstrated its ability to separate analytes from their impurities with baseline resolution and good sensitivity (Figures 4a and 4b).
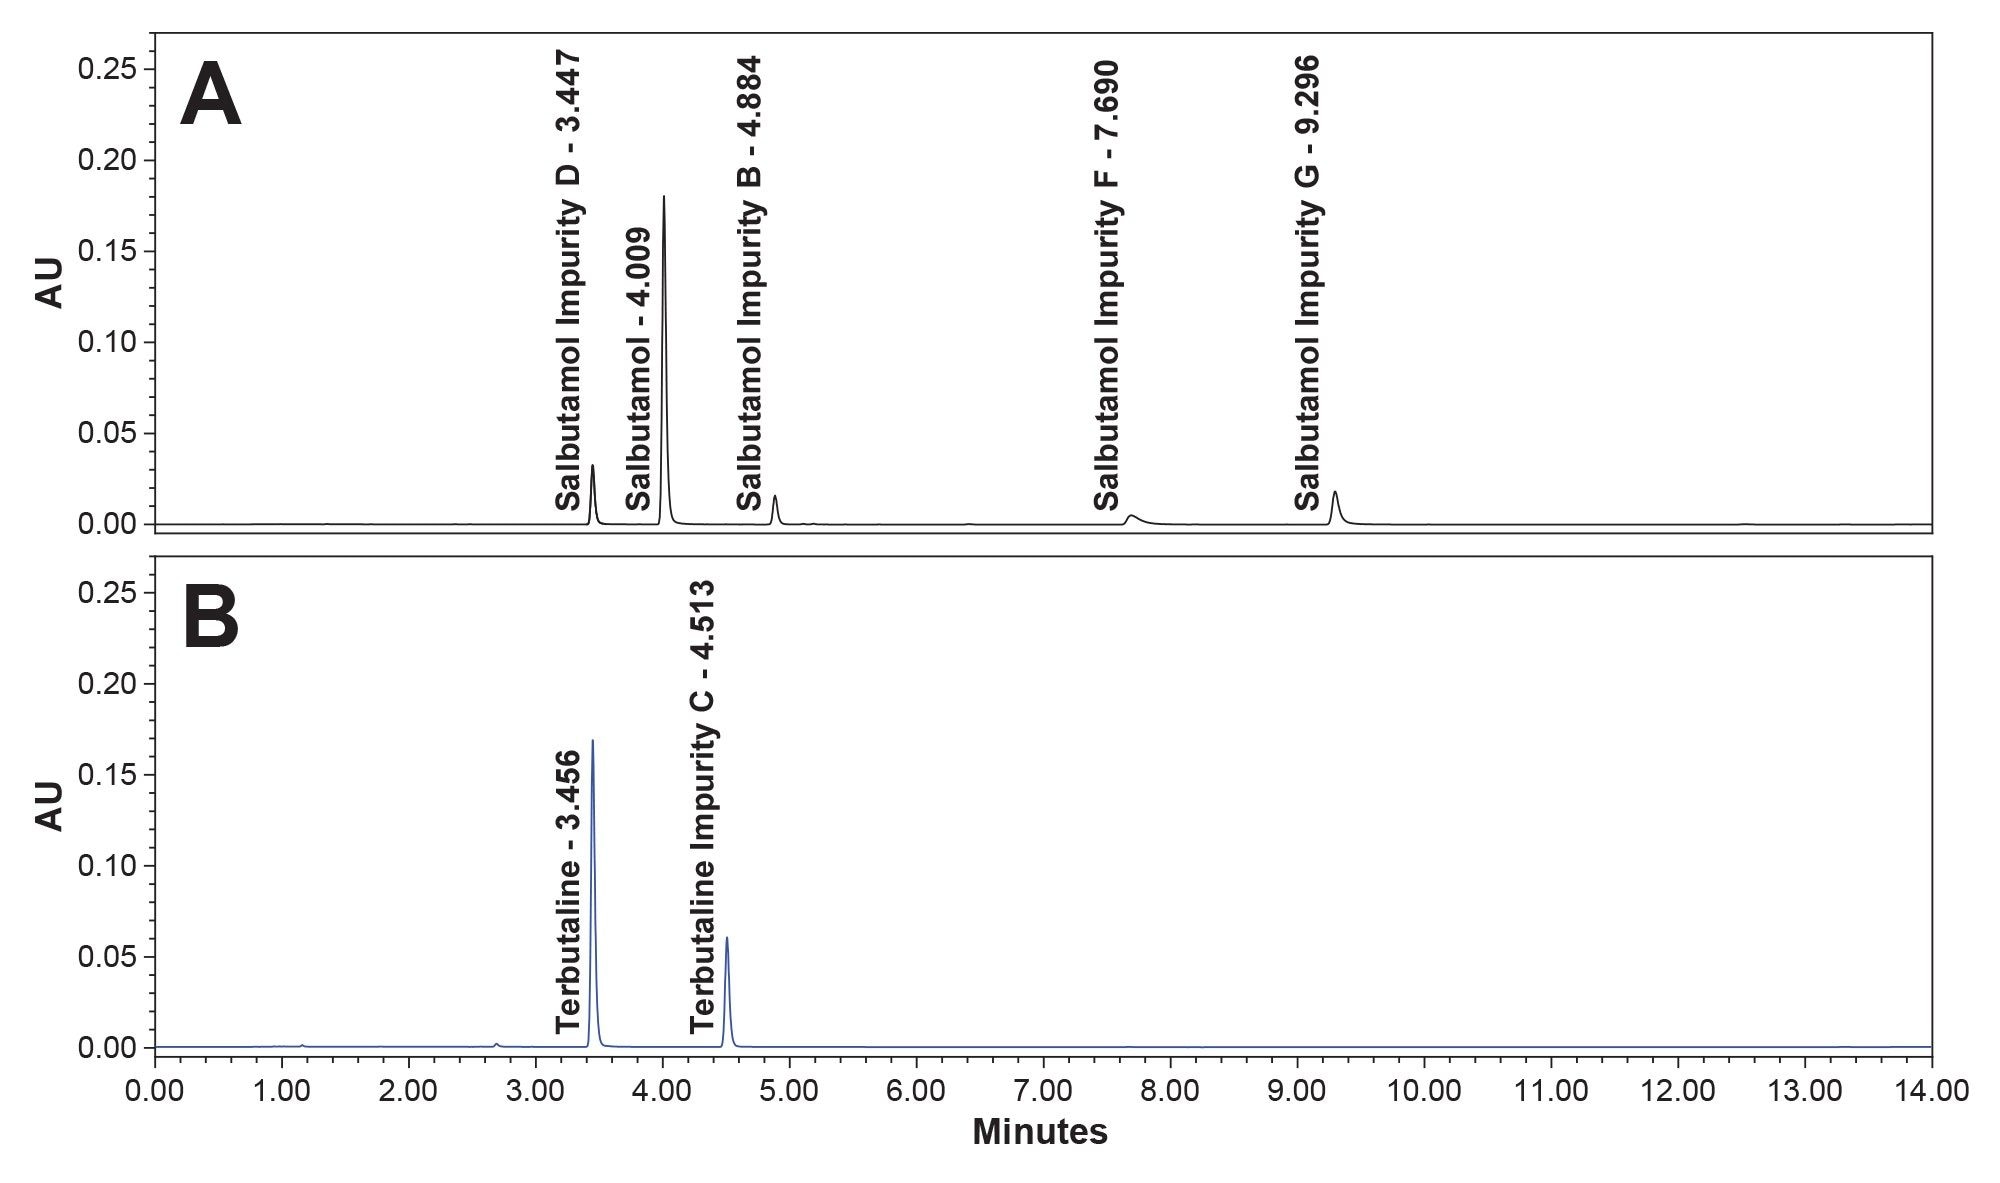
Figure 4a. Representative chromatogram for the separation of Salbutamol (100 μg/mL) and its related impurities (10 μg/mL).
Figure 4b. Representative chromatogram for the separation of Terbutaline (100 μg/mL) and its related impurity (10 μg/mL).
Column Batch Reproducibility
To prove the consistency of column batches for the XBridge™ Premier BEH C18 Column, three different manufacturing lots were investigated. Each column was examined across 12 injections of the BAs Mix sample. The performance across batches is undoubtedly equivalent (Figures 5a through 5c, Tables 6 and 7). The data provides a clear image of the reliability of XBridge™ Premier BEH C18 Columns.
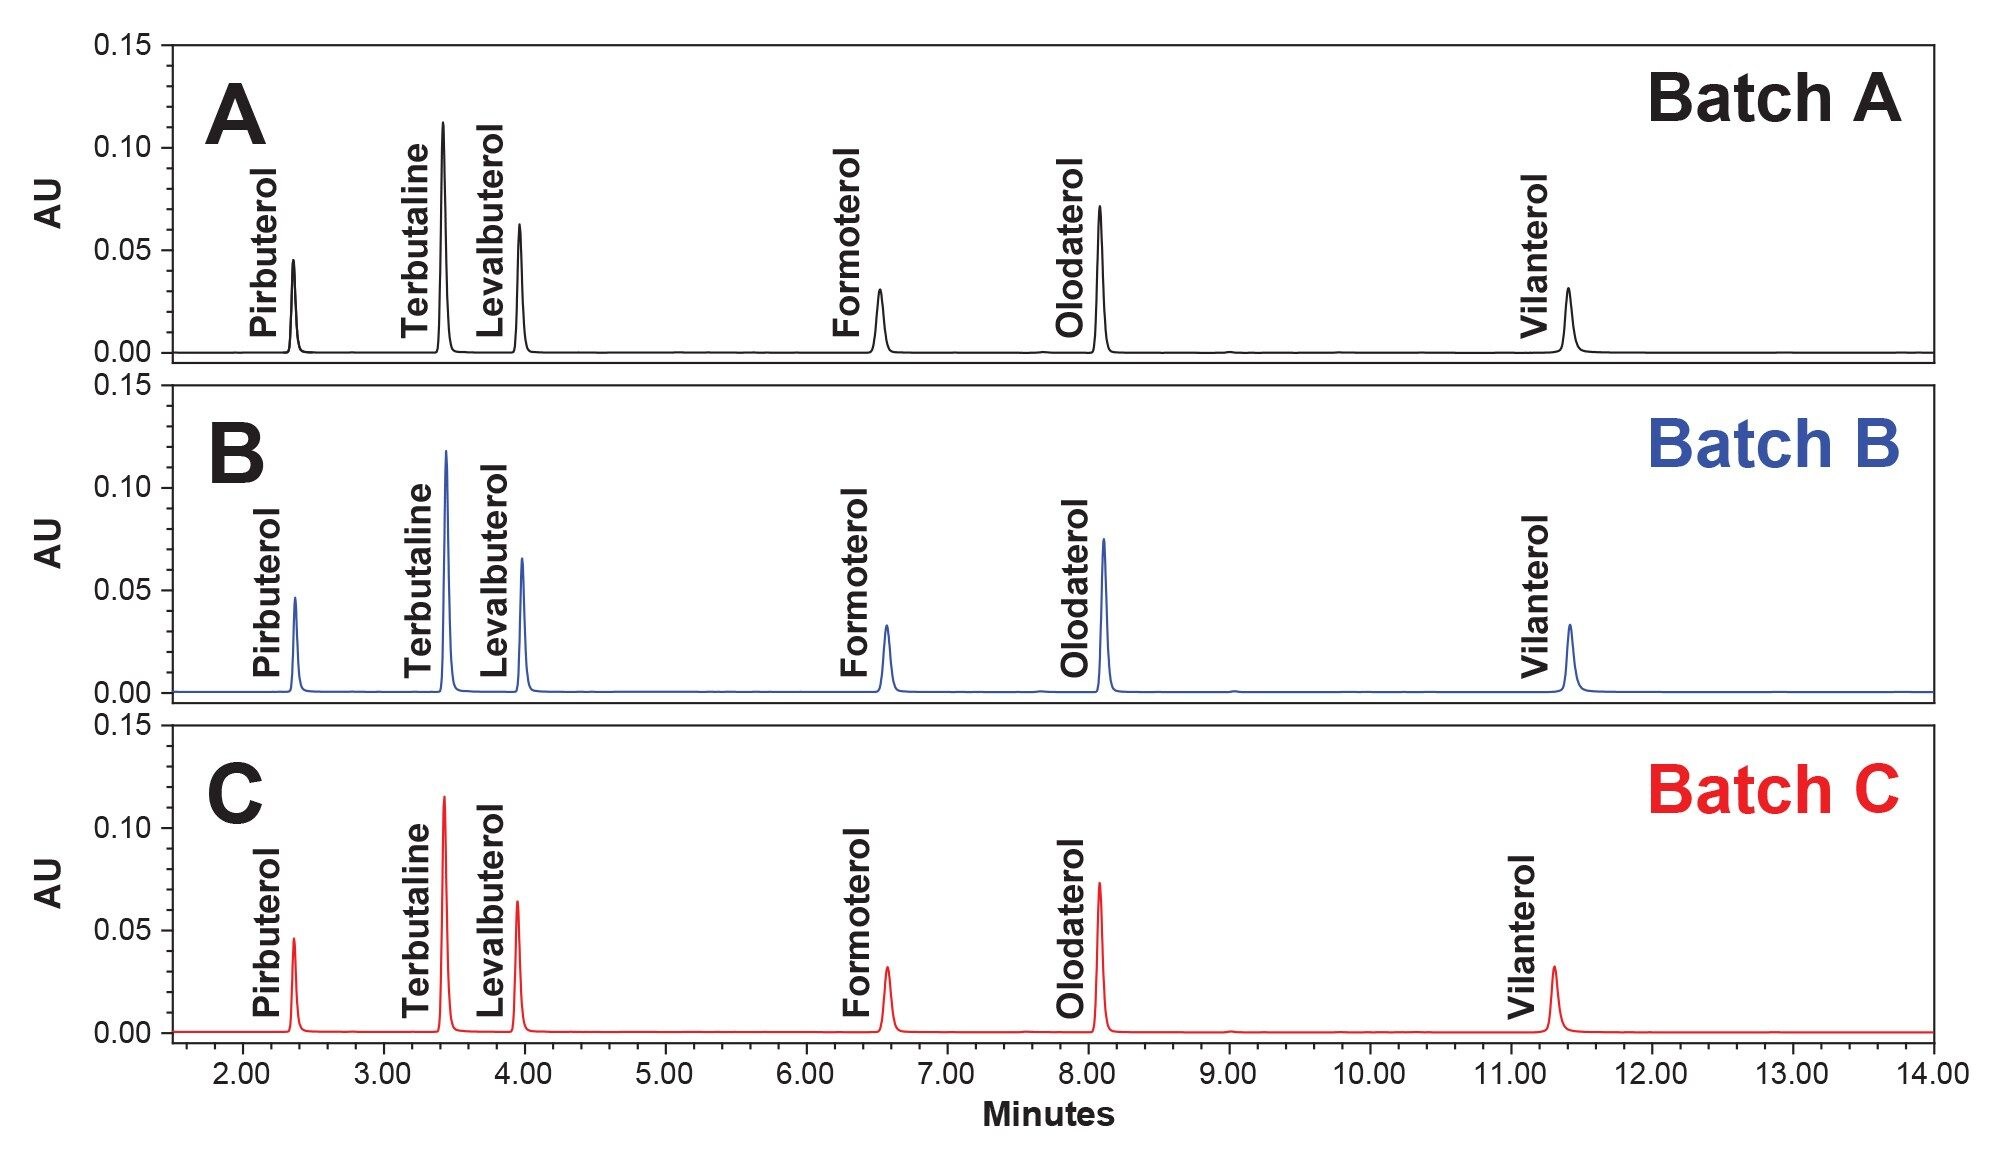
Figure 5a. Representative chromatogram for the separation of the BAs mix for column batch A.
Figure 5b. Representative chromatogram for the separation of the BAs mix for column batch B.
Figure 5c. Representative chromatogram for the separation of the BAs mix for column batch C.
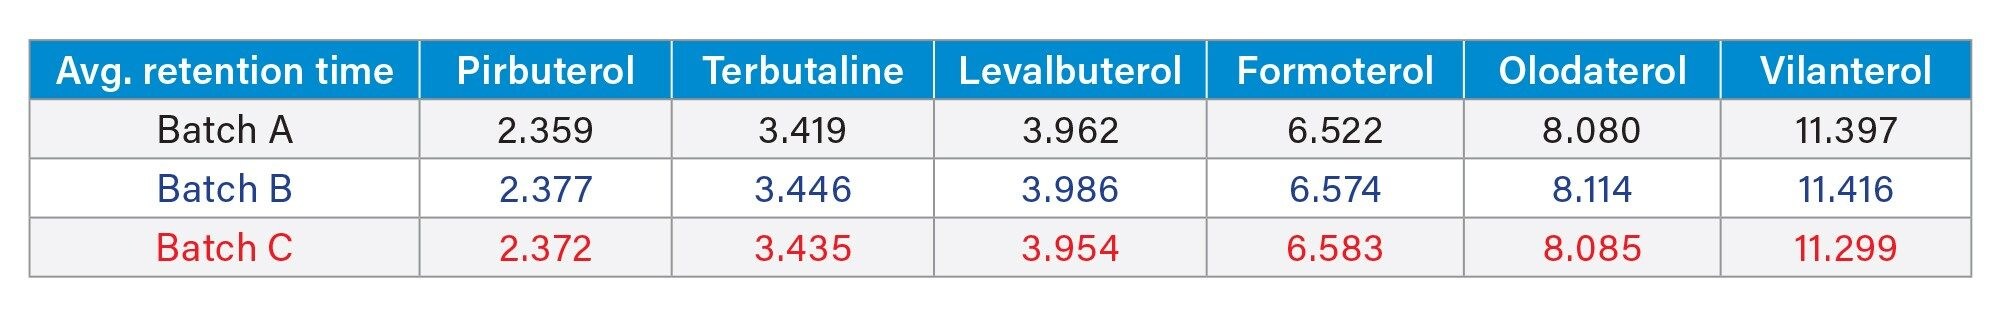 Table 6. Table containing average retention time data for the column batch reproducibility across 12 injections for the BAs Mix sample.
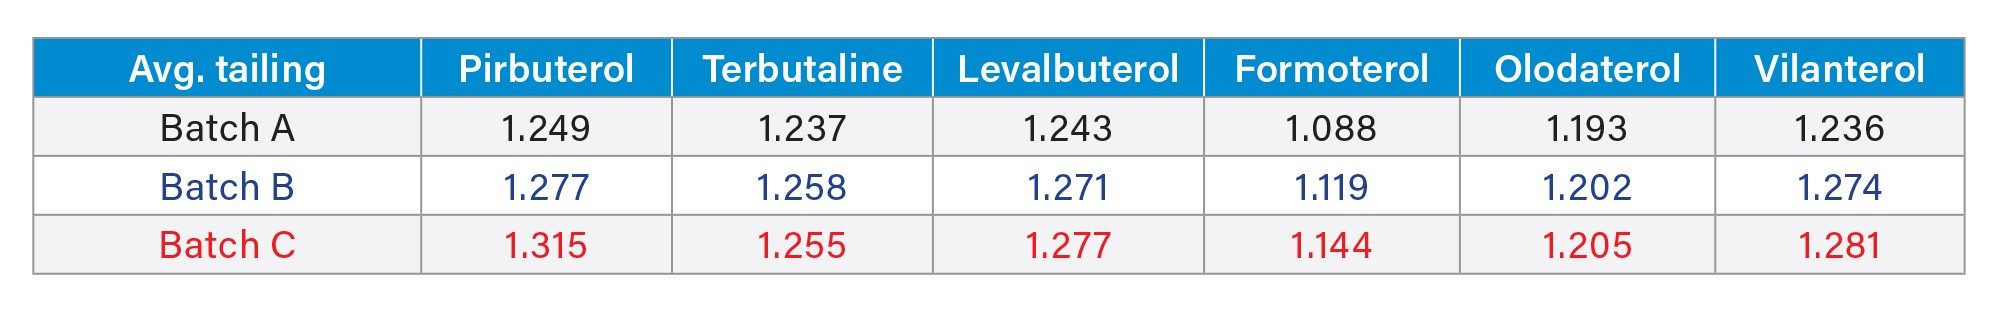 Table 7. Table containing average tailing data for the column batch reproducibility across 12 injections for the BAs Mix sample.
High pH System and Column Reproducibility
To demonstrate the resilience of Premier Columns and Systems with MaxPeak™ HPS Technology under high pH conditions, a fresh XBridge™ Premier BEH C18 Column was installed on the Arc™ Premier LC System. This column underwent 300 injections of the BAs Mix sample equating to over 100 hours of run time. The average retention time and standard deviation over the course of 300 injections is detailed below (Table 8).
 Table 8. Table containing average data for the column and system high pH stability across 300 injections for the BAs Mix sample.
Conclusion
Due to the prevalence and mortality associated with CRDs, the quality and efficacy of maintenance drugs such as BAs is critical. To support this, we developed a method that can separate a variety of BAs and their impurities. Results were reproducible and linear. The basic conditions of this method provided reduction in tailing by up to 65% and improved baseline separation for some critical pairs. Further, this method demonstrated the dependability and reproducibility of MaxPeak™ HPS Technology when exposed to basic pH conditions for an extended period of run time. Finally, it was shown that the XBridge™ Premier BEH C18 Column reliably performs across different sorbent lots.
References
- WHO. Noncommunicable diseases [Internet]. www.who.int. World Health Organization: WHO; 2022. Available from: https://www.who.int/news-room/fact-sheets/detail/noncommunicable-diseases#:~:text=Cardiovascular%20diseases%20account%20for%20most
- WHO. Chronic respiratory diseases. Who.int. World Health Organization: WHO; 2019. Available from: https://www.who.int/health-topics/chronic-respiratory-diseases#tab=tab_1
- Abosamak NR, Shahin MH. Beta 2 Receptor Agonists/Antagonists. PubMed. Treasure Island (FL): StatPearls Publishing; 2023. Available from: https://www.ncbi.nlm.nih.gov/books/NBK559069/?report=classic
- Wirth J. The 50 most-filled prescriptions of 2022. The Checkup. SingleCare Administrators; 2022. Available from: https://www.singlecare.com/blog/most-prescribed-drugs-2022/#:~:text=Prescription%20drug%20use%20in%202022%20vs.%20previous%20years
- Zhang L, Jia Q, Liao G, Qian Y, Qiu J. A Fast Method for the Simultaneous Analysis of 26 Beta-Agonists in Swine Muscle with a Multi-Functional Filter by Ultra-High Performance Liquid Chromatography-Tandem Mass Spectrometry. Separations. 2022 May 1;9(5):121. Available from: https://www.mdpi.com/2297-8739/9/5/121
- Yan K, Zhang H, Hui W, Zhu H, Li X, Zhong F, et al. Rapid screening of toxic salbutamol, ractopamine, and clenbuterol in pork sample by high-performance liquid chromatography—UV method. Journal of Food and Drug Analysis. 2016 Apr 1;24(2):277–83. Available from: https://www.sciencedirect.com/science/article/pii/S1021949816000107?via%3Dihub
- Alkhateeb FL, Wilson I, Maziarz M, Rainville P. Ultra high-performance liquid chromatography method development for separation of formoterol, budesonide, and related substances using an analytical quality by design approach. Journal of Pharmaceutical and Biomedical Analysis. 2021 Jan 30;193:113729. Available from: https://www.sciencedirect.com/science/article/pii/S0731708520316150?viewFullText=true
- Dolan J. Back to Basics: The Role of pH in Retention and Selectivity. Chromatography Online. LCGC; 2017. Available from: https://www.chromatographyonline.com/view/back-basics-role-ph-retention-and-selectivity
720007945, July 2023