Reproducibility and Robustness of the Xevo™ G3 QTof Mass Spectrometer for the Analysis of Large Cohort Studies
Abstract
Demonstrating the robustness and reliability of the Xevo G3 QTof coupled to an ACQUITY™ Premier UPLC for large cohort metabolomic studies. The LC/MS system demonstrated excellent retention time reproducibility, mass accuracy consistency and peak area stability. Highlighting that the Xevo G3 QTof is an ideal solution for successful metabolic profiling of biological fluid for large cohort biomedical research.
Benefits
- A robust and reproducible system highly suited to extended analyses
- Consistently high mass accuracy and compound response over a large cohort, demonstrated over 1000 injections. Exceeding seven days of total analysis time
- The ACQUITY Premier System delivers a highly consistent retention time stability throughout a large cohort analysis
Introduction
The aim of biomedical research or epidemiological studies is to compare two or more groups of samples to look for statistically significant biological differences; an example of this could be healthy controls vs disease state, to look for biological markers of the disease to improve diagnosis tests, timeframe, or confidence. A large cohort of biological samples is often required to overcome any bias within the data due to factors unrelated to the condition being studied, for example: subject, age, gender, diet etc.
The analysis of significantly large sample sets, required to overcome natural variation within the subject group, brings with it many analytical challenges. Primarily the system needs to be robust and reproducible with minimal analytical drift as possible. Without this it is possible for a batch effect to mask important biological feature changes and/or to reduce confidence in the data. The batch effect referenced here, can be created in various ways for LC-MS analyses. For example, the same compound not being identified as such within different injections: this can be caused by retention time changes or mass accuracy drift. Or erroneous fold-change information for compounds of interest, either due to peak area fluctuation throughout the run or through a loss of sensitivity over time.
Therefore, having an LC-MS system which is highly robust and reproducible, significantly reduces analytical variation, providing far more reproducible results, fewer QC failures, and increased confidence in subtle biologically significant features.
The method outlined in this document uses typical reversed-phase (RP) chromatography and demonstrates system robustness over a 1000 injection analysis by monitoring retention time, peak area, and mass accuracy stability of the system. Compounds have been putatively identified utilizing chromatographic retention time, accurate mass, and fragmentation pattern (both theoretical and analytically derived).
Experimental
Sample Description
Nicotine Metabolites in Human Urine (SRM: 3671; NIST, USA), 200 µL of each of the three urine levels were pooled to create a representative QC sample.
Waters™ LCMS QC Reference Standard (LCMS Mix) (p/n: 186006963), was diluted 1:3 in ultrapure water - 500 µL of LCMS Mix diluted with 1500 µL of ultrapure water.
A 100 µL aliquot of the pooled QC sample was diluted with 1700 µL of ultrapure water and spiked with 200 µL of the prepared LCMS Mix and vortexed for 15 seconds to ensure homogeneity.
Replicates were injected using an ACQUITY Premier System onto the Xevo G3 QTof with no further sample preparation, acquisition was controlled by waters_connect™ software.
LC Conditions
|
LC system: |
ACQUITY Premier FTN |
|
Column: |
ACQUITY Premier UPLC HSS T3 (100 mm x 2.1 mm, 1.8 µm) |
|
Column temperature: |
45 °C |
|
Injection volume: |
1 µL |
|
Flow rate: |
0.6 mL/min |
|
Mobile phase A: |
Water 0.1% formic acid |
|
Mobile phase B: |
Acetonitrile 0.1% formic acid |
|
Gradient: |
99% A hold 0.3 minutes, 99%–50% A 0.5–7 minutes, 50%–30% A 7–8 minutes, 1% A wash 8–9 minutes, re-equilibrate initial conditions 9–10 minutes. |
MS Conditions
|
MS system: |
Xevo G3 QTof |
|
Capillary voltage: |
2 kV in Positive ion mode |
|
Sampling cone: |
30 V |
|
Source offset: |
80 V |
|
Source temperature: |
120 °C |
|
Desolvation temperature: |
600 °C |
|
Cone gas flow: |
50 L/hr |
|
Desolvation flow: |
600 L/hr |
|
StepWave mode: |
Default Transmission[1] |
|
Detector auto gain: |
On |
|
Analyzer mode: |
Sensitivity |
|
Data format: |
MSE continuum |
|
Acquisition range: |
50–1200 Da |
|
Dynamic range: |
Extended |
|
Scanning speed: |
10 Hz |
|
Fragmentation CE: |
20–40 V |
|
Lockspray flow: |
10 µl/min |
|
Lockspray settings: |
Average 3 scans every 60 seconds |
|
IDC: |
On (Default) |
Data were processed within MARS software (MassAnalytica, Barcelona, Spain) for compound identification, whilst Skyline Daily software (MacCoss Lab, University of Washington) was used for additional data interrogation and figure generation. Lastly data were exported into Microsoft Excel for averages and standard deviation calculations.
Results and Discussion
To evaluate the suitability of the Xevo G3 QTof for the analysis of biological fluids from a large cohort study, we analyzed 1000 injections of human urine, utilizing a typical 10-minute metabolomic chromatographic method, which resulted in less than seven days of continuous analysis. Please note that at injection 500 the analysis buffers were refilled to ensure sufficient volume for the remainder of the analysis. Data were processed from every tenth injection to give an overview of system performance.
The data displayed in Figure 1 demonstrates a typical Skyline Daily overview for a selected component: cocaine metabolite Benzoylecgonine, found endogenously within the NIST urine sample, the visual includes an XIC of the chromatographic peak for the selected compound (injection 500 shown), the peak area, the retention time, and the mass accuracy of the selected component for every tenth injection over the whole analysis is also shown.
 Figure 1. Representative Skyline Daily display showing an XIC, peak area, retention time, and mass accuracy for the benzoylecgonine compound over the whole analysis.
The statistical analysis tools employed in biological sample profiling, rely on data which are consistent allowing software to accurately peak pick across the entire analysis with minimal data manipulation. To achieve this, the retention time and mass accuracy of the peaks is crucial to ensure that the same component is identified in every injection in which it appears. Should a retention time or mass accuracy change, the same component may be identified as two separate peaks across different injections, leading to misinterpretation of data by statistical software packages. Mass accuracy also plays a crucial role when putatively identifying compounds of interest, as good mass accuracy will lead to a more confident assignment of the compound identity.
Finally, assessment of the concentration of each component in the derived data will provide information on fold changes. This is essential for determination of statistical significance of each compound and relies upon the instrumentation delivering a consistent response over the course of the entire analysis session. Data normalization is possible within some statistical software packages; however, this process can skew complex data by masking changes for the features of interest, or by falsely increasing the fold change on compounds due to matrix variance. When an analysis demonstrates a stable response, this will ensure any normalization of data is minimal and provides greater confidence in the statistical analysis results.
To assess the stability, the response of eight compounds were extracted, five spiked compounds: Sulfaguanidine, Acetaminophen, Val-Tyr-Val, Leucine Enkephaline and Sulfadimethoxine and three endogenous compounds (drug metabolites) found in the NIST SRM Urine: Benzoylecgonine, Naproxen Glucuronide and Ibuprofen Glucuronide. Table 1 shows a summary of all eight compounds.
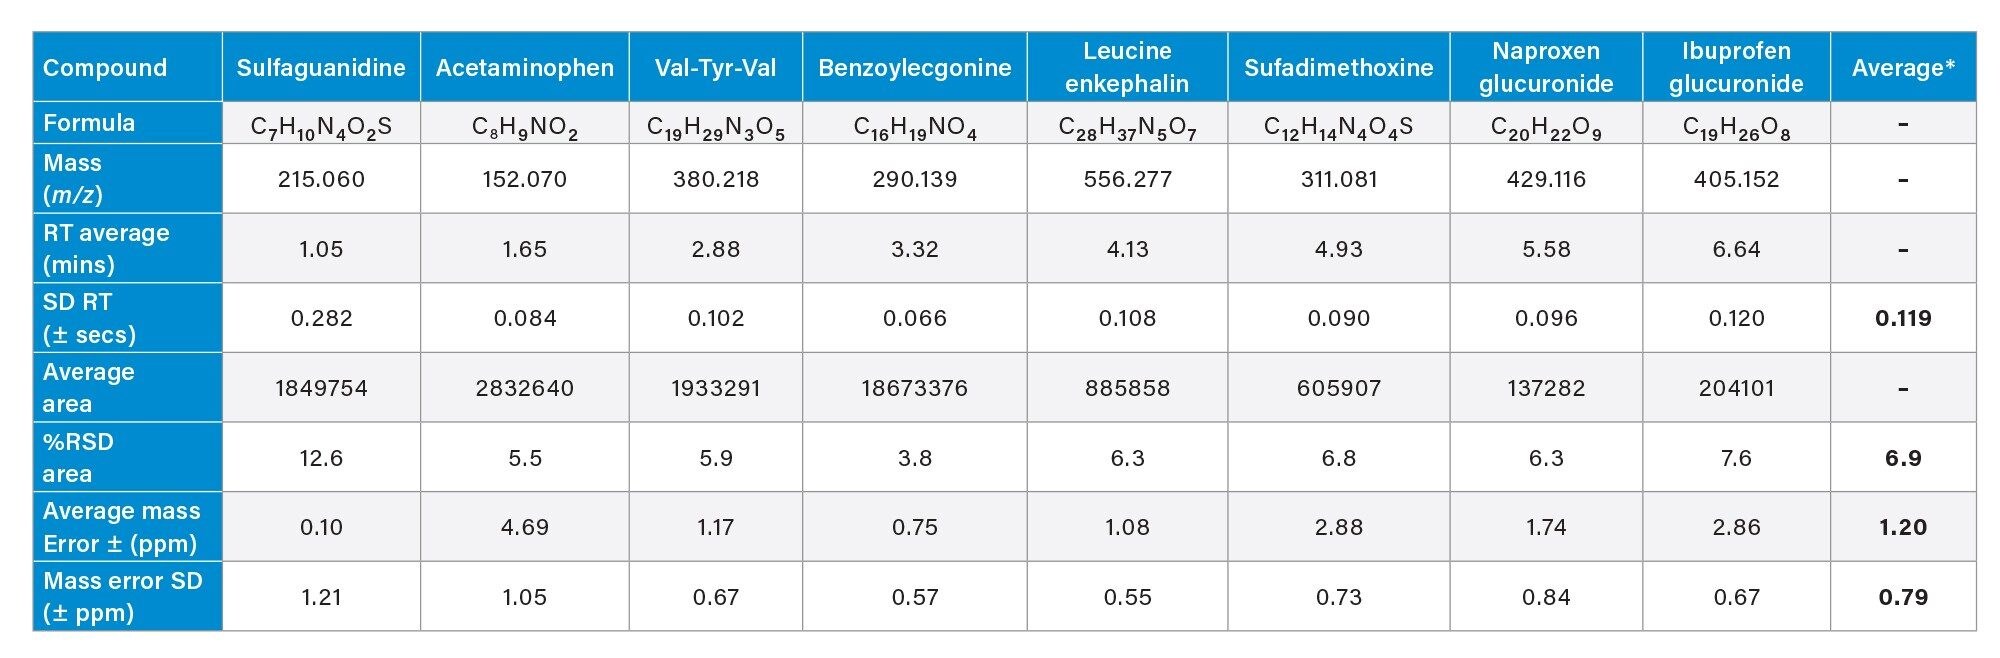 Table 1. A summary of results from 1000 injections or NIST SRM Urine spiked with LCMS QC Mix.
The resulting data for chromatographic retention time reproducibility is displayed in Figure 2. and summarized in Table 1. The data showed a standard deviation (SD) of between ±0.084 and ±0.282 seconds with an average retention time standard deviation of ±0.12 seconds. The smallest peak area variation was observed from the environmental metabolite Benzylecgonine, which presented as a sharp, intense peak with mid-chromatographic retention (Figure 2). The largest retention time variation was seen in Sulfaguanidine, which is early eluting (1.054 minutes) and hence a close proximity to the injection solvent front, likely resulting in the variation observed. This data provides great confidence that the chromatography system provided excellent accuracy and precision across a large sample batch spanning seven days of analysis time.
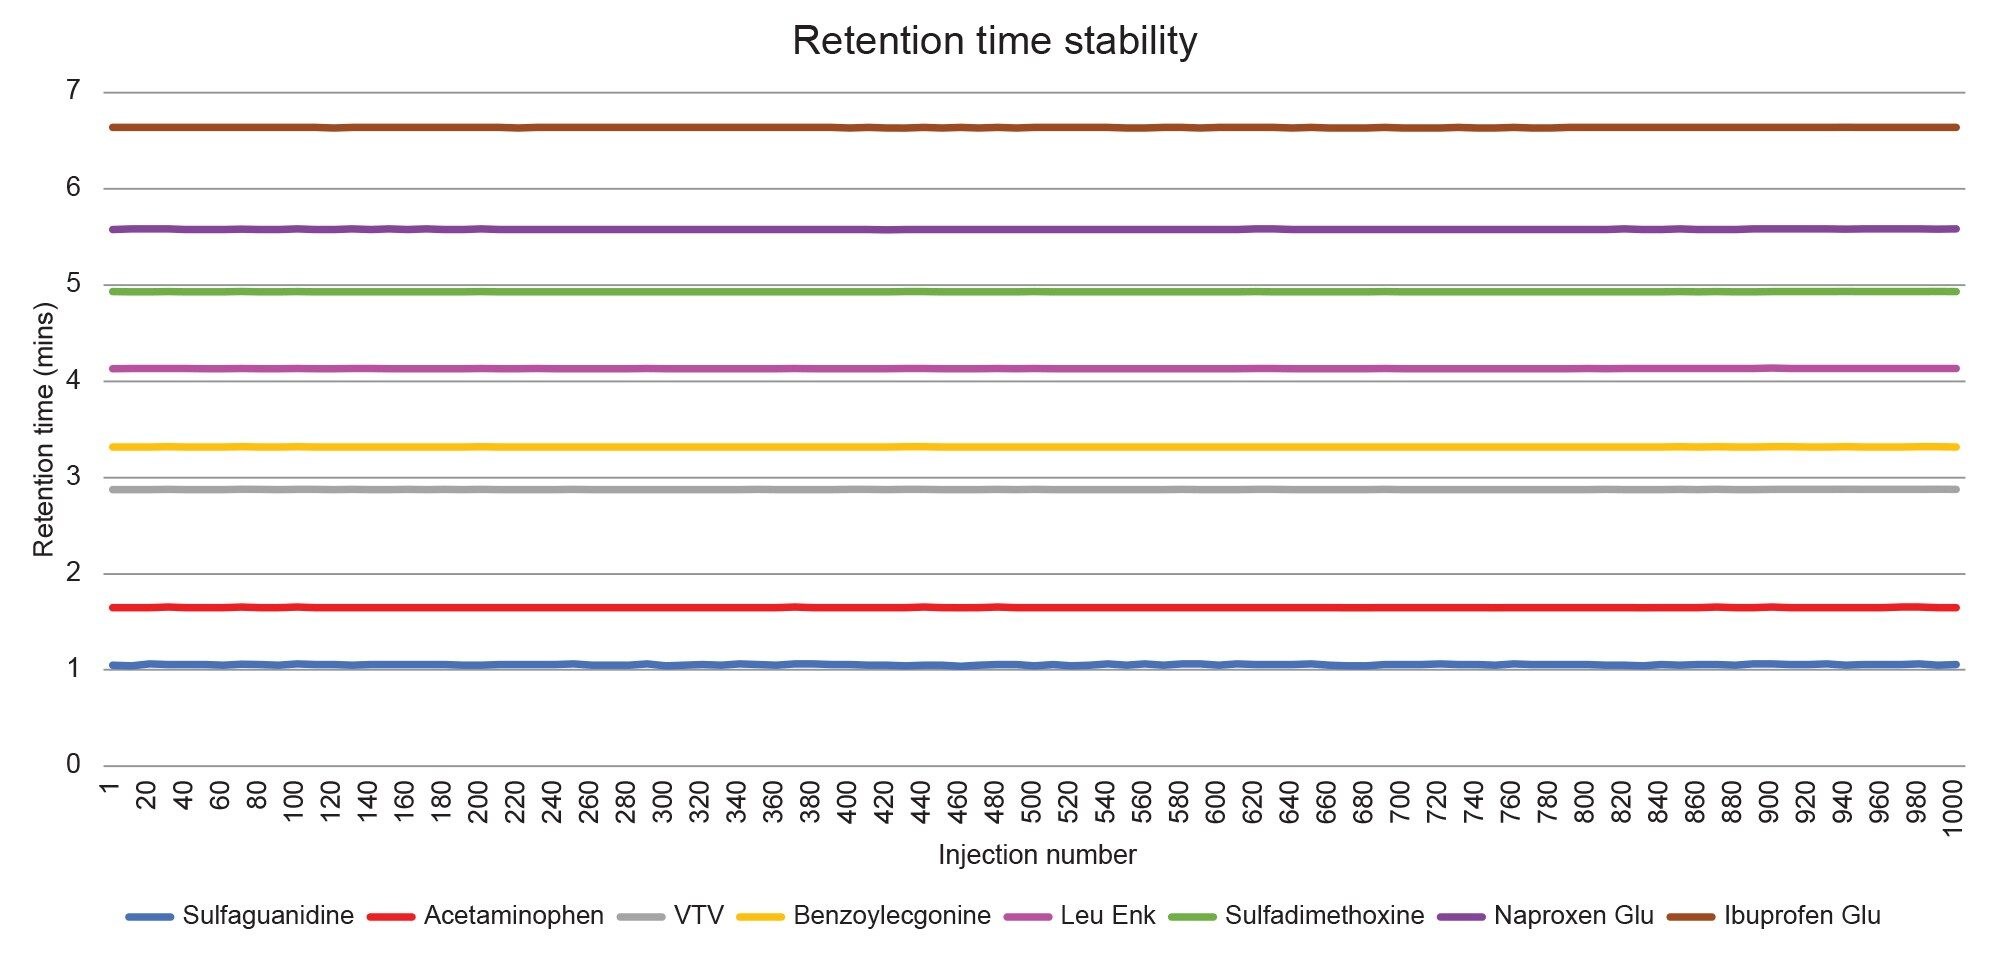 Figure 2. Retention time stability over 1000 injections, data displayed is every tenth injection for all eight compounds.
The average mass accuracy of the Xevo G3 QTof across the eight compounds for this analysis was ±1.2 ppm with an average standard deviation of ±0.79 ppm across the 1000 injections. The Skyline mass accuracy graph for four of the eight compounds is displayed in Figure 3 and the values for all eight compounds are summarized in Table 1.
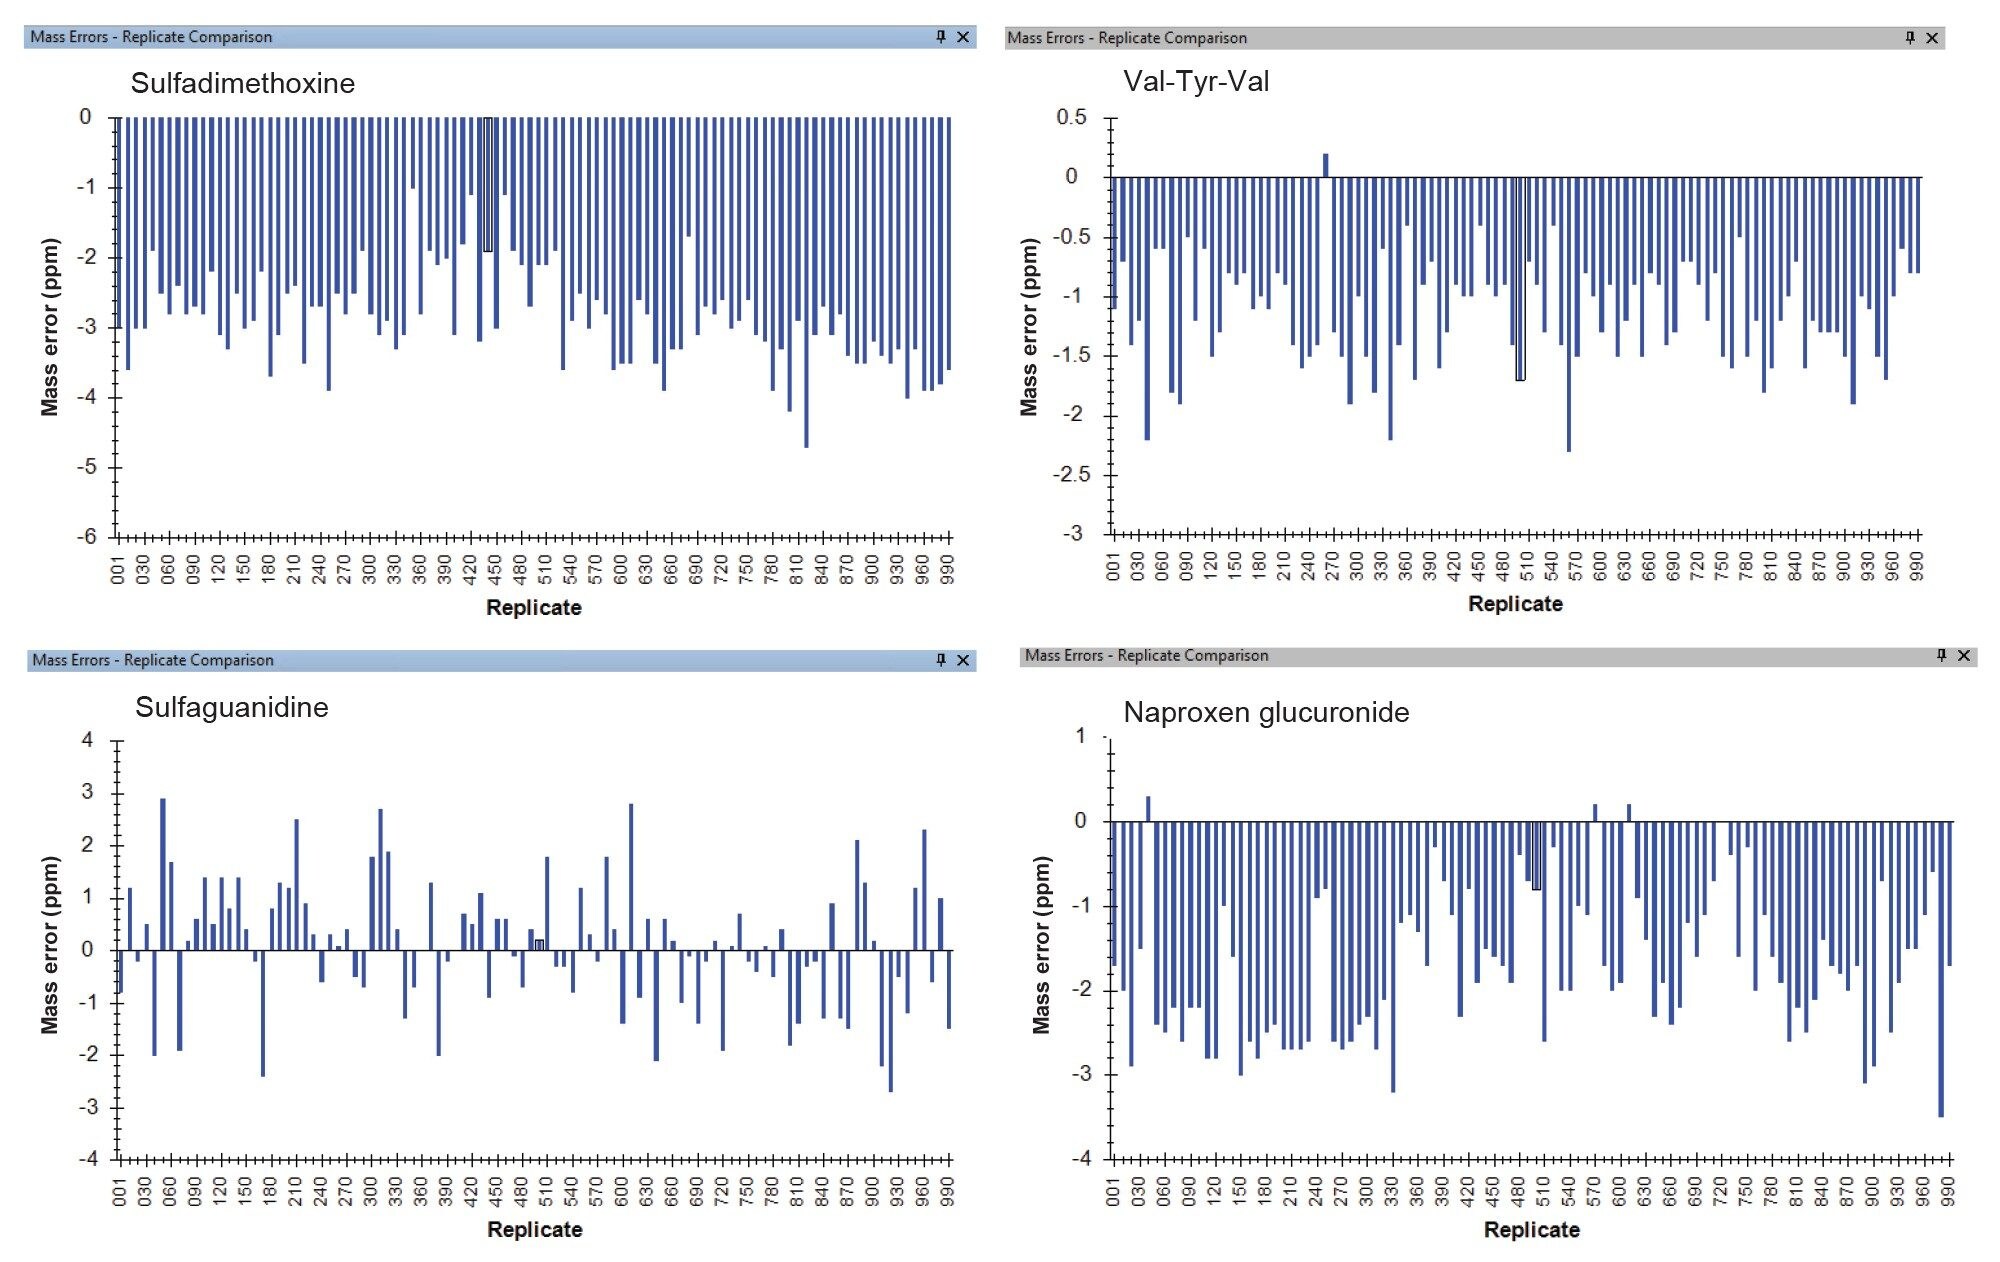 Figure 3. Skyline visuals of the mass accuracy across the whole analysis, data displayed is every 10th injection for four of the eight compounds.
The variation in the mass spectrometry response over the duration of the analytical process for the eight compounds was between 3.8 and 12.6 percent relative standard deviation (%RSD), and an average of 6.9 %RSD was calculated combining results from all eight compounds. The smallest peak area variation was observed from the environmental metabolite Benzylecgonine, which presented as a sharp, intense peak with mid-chromatographic retention. The largest peak area variation was seen in Sulfaguanidine, this is the earliest eluting compound (1.054 minutes), therefore the observed variation is also likely caused by proximity to the injection solvent front (as mentioned previously). The Skyline area graph for four of the eight compounds is shown in Figure 4, and the values for all eight are summarized in Table 1.
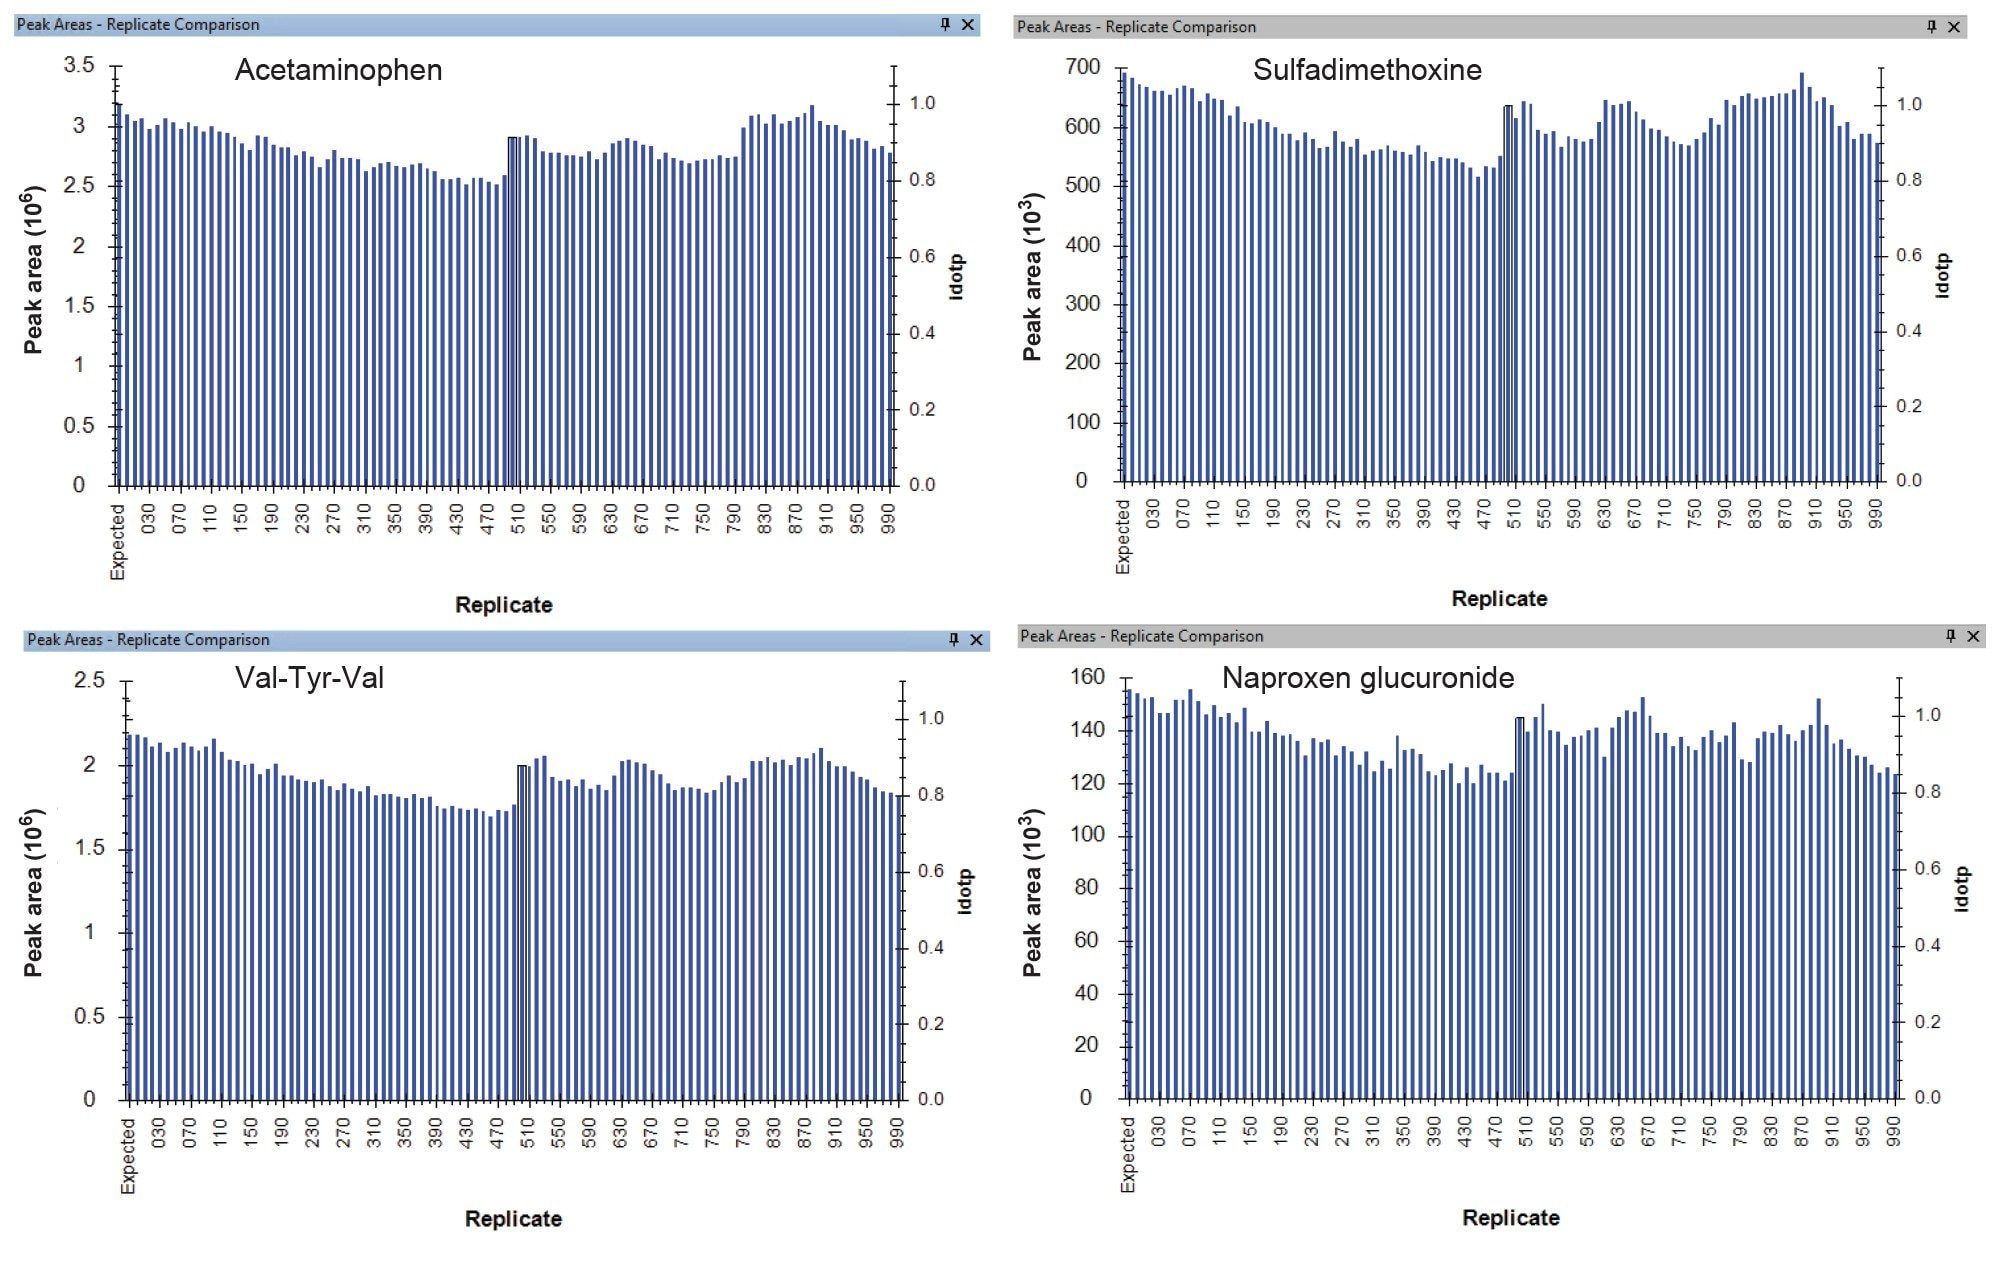 Figure 4. Skyline visuals of the compound response across the whole analysis, data displayed is every 10th injection for four of the eight compounds.
Conclusion
A sample of human urine representative of a large cohort metabolic profiling study was injected 1000 times on a 10-minute reversed-phase chromatographic method, totaling less than days of continuous analysis. Overall, this demonstrates the robustness of the Xevo G3 QTof coupled to an ACQUITY Premier System for large cohort metabolomic studies.
The system demonstrated excellent peak retention time reproducibility with an average standard deviation in retention time of only ±0.1 seconds. A consistent mass accuracy average mass error of ±1.2 ppm, with an average standard deviation of only ±0.79 ppm across the whole 1000 injection analysis. A stable peak area reproducibility, providing an average area relative percentage standard deviation of 6.9% RSD. This highlights that the Xevo G3 QTof is an ideal solution for successful profiling of biological fluid for large cohort biomedical research.
References
- Improved Transmission of Labile Species on the Xevo G3 QTof Mass Spectrometer with the StepWave™ XS, Waters Application Brief 720007794. November 2022.
Featured Products
720008274, March 2024