• Application Note

A Rapid and Sensitive Analysis Method of Sudan Red I, II, III, and IV in Tomato Sauce Using UPLC-MS/MS 

A Rapid and Sensitive Analysis Method of Sudan Red I, II, III, and IV in Tomato Sauce Using UPLC-MS/MS 

  • Choon Keow NG
  • Naomi Tanaka
  • Michelle Kim
  • Swee Lee Yap
  • Waters Corporation

Abstract

In this application note, a method using UltraPerformance LC (UPLC)-MS/MS has been developed to quantitate trace amounts of Sudan I, II, III, and IV in tomato and chili sauce.

Introduction

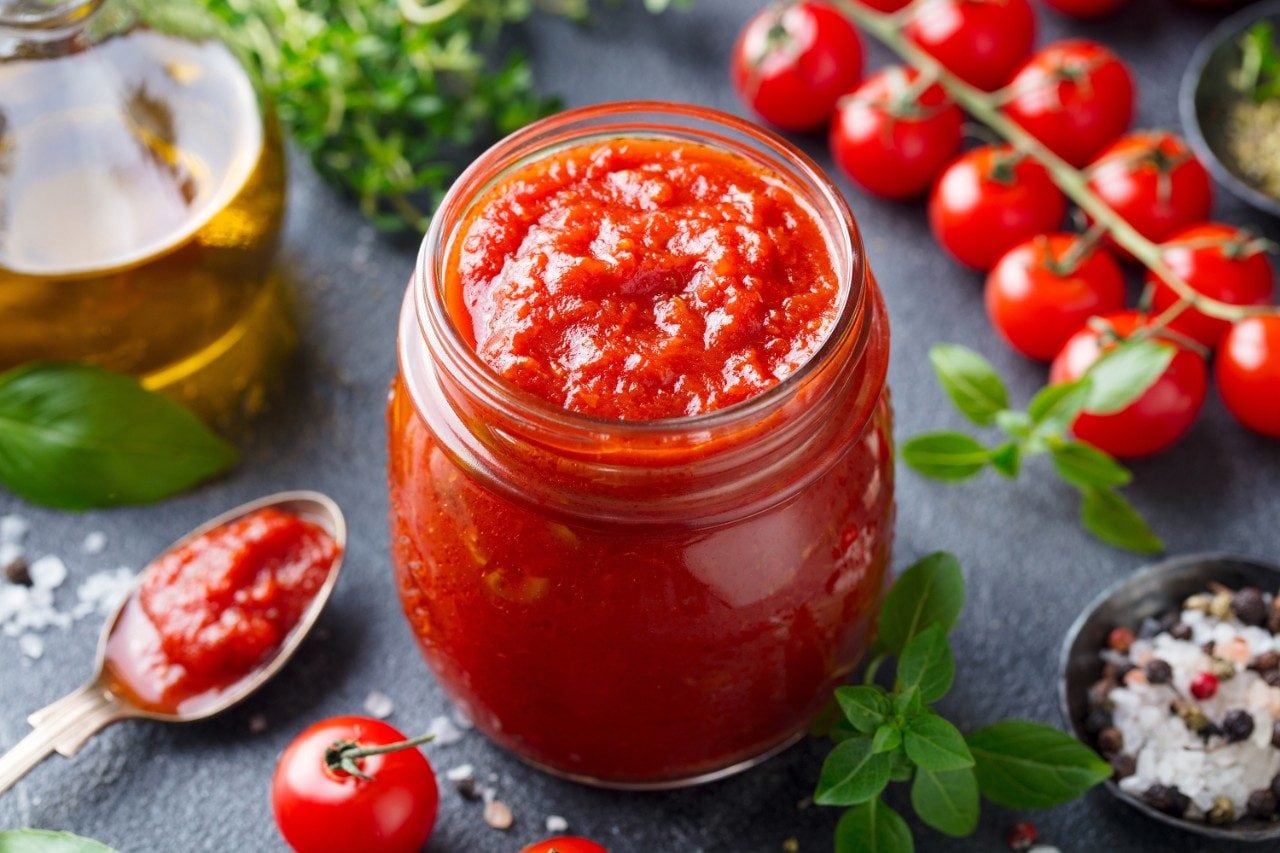
In recent years, several processed food products, including chili powder, curry sauce, and mustard sauce have been rejected or withdrawn by the European Union (EU) because of the presence of Sudan dyes, particularly Sudan I and IV. Sudan I, II, III, and IV are a class of azo compounds produced synthetically for coloring solvents, oils, waxes, petrol, and shoe & floor polishes. The dyes are considered to be genotoxic carcinogens and have been linked to cancer in animals. To date, it has not been possible to identify safe levels of Sudan dyes or quantify the health risks associated with their use in food. In response the European Commission (EC) banned the use of Sudan dye as a food additive in January 2004 under Directive 2003/460/EC. However, Sudan Dyes remain a popular food additive as the color enhancement provided by the dyes increases the selling price of various food products, such as chili powder, chili sauce and tomato sauce. Figure 1 shows the structures of Sudan I, II, III, and IV. 

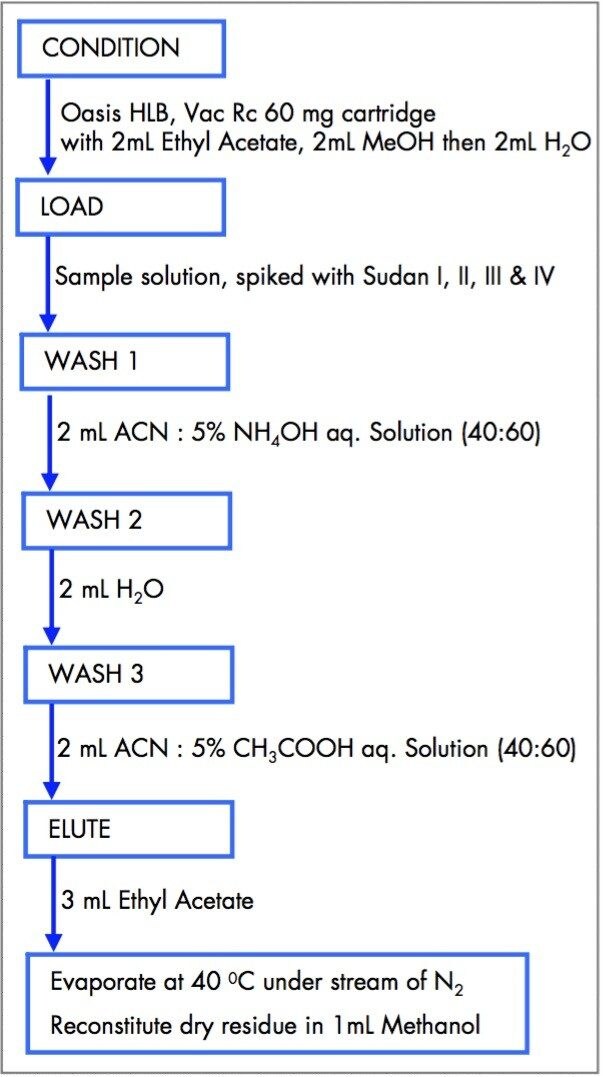
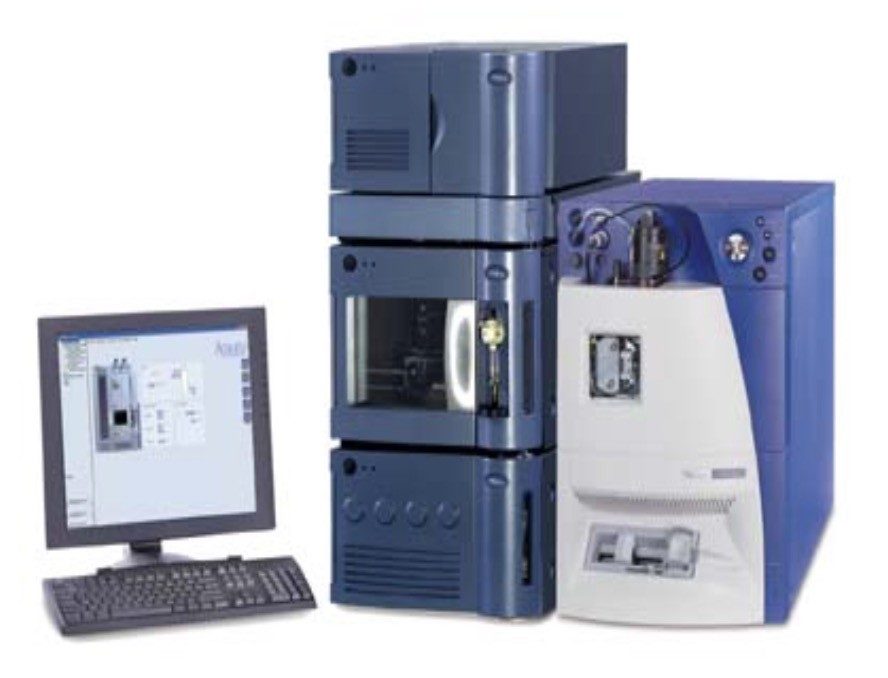
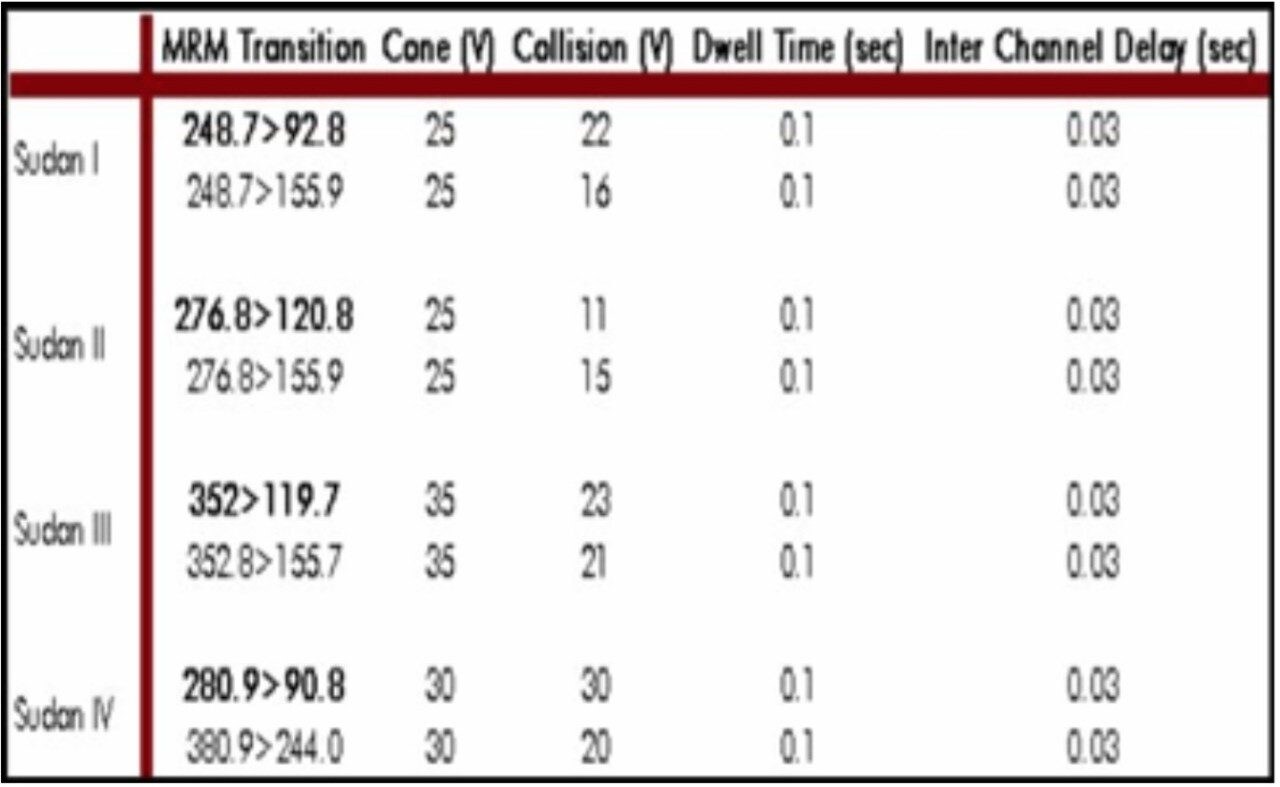
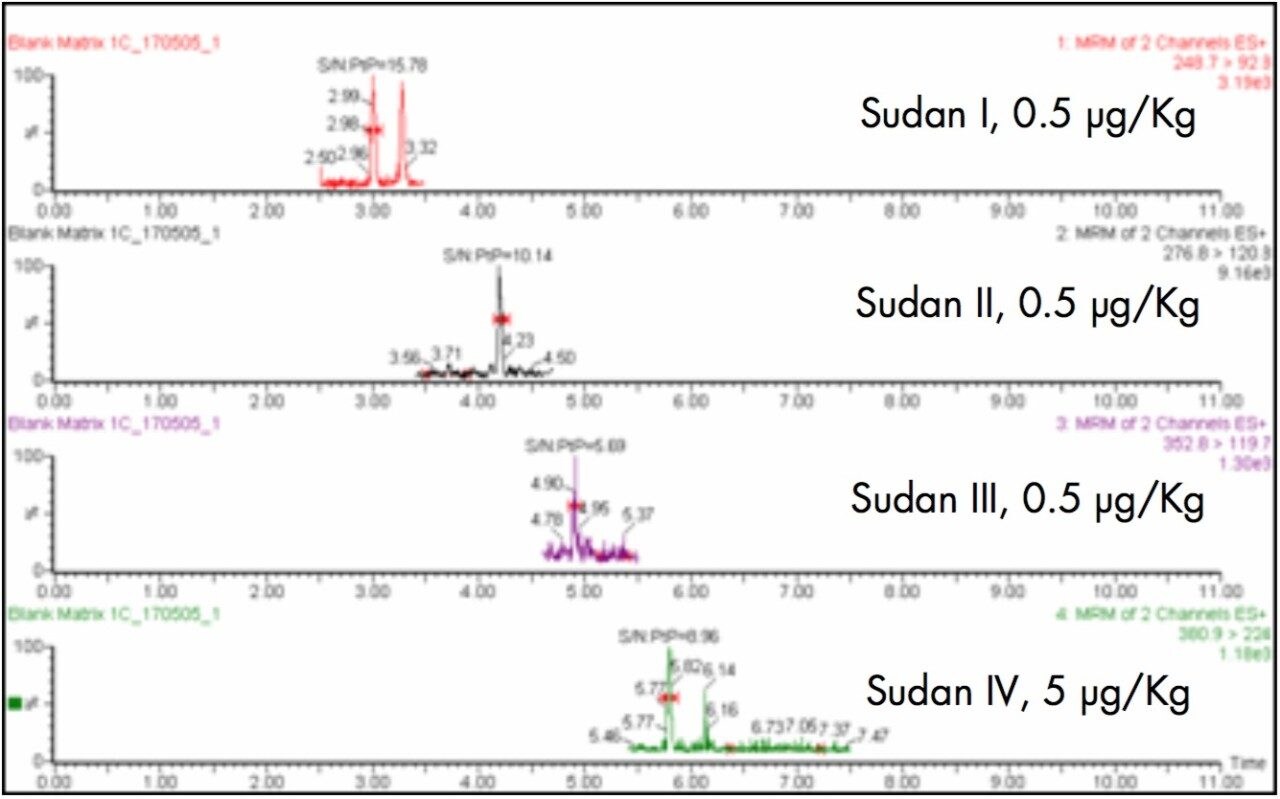
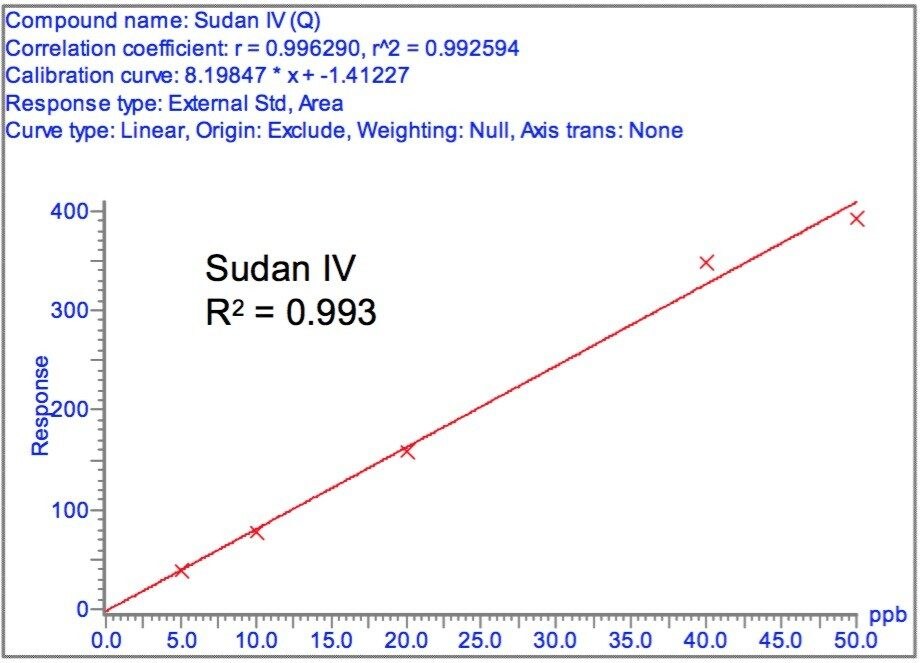
A method using Ultra Performance LC(UPLC)- MS-MS has been developed to quantitate trace amounts of Sudan I, II, III, and IV in tomato and chili sauce. A solvent extraction followed by a simple SPE method using Waters Oasis HLB cartridges was employed to provide a clean matrix for trace amount analysis. By coupling UPLC to the Waters Quattro micro API, the method is able to provide excellent sensitivity and selectivity, as is demonstrated by a LoD of 0.1 to 1.7 μg/Kg in the final injected solution. 

Figure 1. Structures of Sudan I, II, III, and IV. 

Experimental

Chemicals and Solutions

Individual Sudan Red standards (I, II, III, and IV) were purchased from Sigma Aldrich (St Louis, MO,USA). HPLC grade Methanol, Ethyl Acetate, and Acetonitrile and ACS grade Acetone were purchased from JT Baker (USA). The stock solution of each standard was prepared in Ethyl Acetate and further diluted using Methanol. 

Sample Preparation

Liquid/Liquid Extraction 1 g of tomato sauce was measured into a 50 mL centrifuge tube followed by an addition of 10 mL Acetone. The tube was shaken for 5 minutes, and centrifuged at 4500 rpm for 10 minutes. 8 mL of the supernatant was transferred into another 50 mL centrifuge tube which contained 8 mL of 5% NH4OH aqueous solution. This solution was further cleaned up using Waters Oasis HLB cartridges. The solid phase extraction method is illustrated in Figure 2. 

Figure 2. Waters Oasis HLB Solid Phase Extraction. 

UltraPerformance LC-MS/MS Conditions

Waters ACQUITY UPLC system

Mobile phase A:

Water with 0.1% formic acid

Mobile phase B:

Acetonitrile with 0.1% formic acid

Column:

ACQUITY BEH, 1.7 μm, 2.1 x 100 mm, 30 °C

Flow rate:

0.4 mL/min

Injection volume:

10 μL

Gradient

Time

Linear

Curve

0 min

60%B

-

5 min

100%B

6

7 min

100%B

11

7.01 min

60%B

1

11 min

60%B

11

MS Conditions

Waters Quattro micro API

Electrospray mode with positive polarity

Capillary voltage:

3.00 KV

Extractor:

1.0 V

RF lens:

0.0 V

Source temperature:

100 °C

Desolvation temperature:

450 °C

Desolvation gas flow:

500 L/hr

Collision gas pressure:

3.50 e-3

Multiplier:

650

Waters ACQUITY UPLC with Quattro micro API Mass Spectrometry System. 

Each analyte was monitored for two Multiple Reaction Monitoring (MRM) transitions along with the collision energy and dwell time as shown in Table 1.

Chromatograms corresponding to quantitation and confirmation transitions are shown in Figure 3 and 4 respectively. 

Data was acquired using Waters MassLynx Software and processed using Waters QuanLynx Application Manager. 

Table 1. MRM parameters (MRM transition in Bold represent quantitation transition). 

Results and Discussion

A series of matrix match calibration standards, spiked matrix samples, matrix blanks, and recovery samples were analyzed in order to determine method repeatability, linearity, and recovery. 

Figure 5 shows the observed peak to peak S:N ratio for quantitation transitions of Sudan I, II, III, and IV taken from the lowest matrix match calibration standards. By extrapolation, the LoD, defined as the concentration at which S:N is 3:1, is approximately 0.1, 0.15, 0.26, and 1.67 μg/Kg in the final injected solution for Sudan I, II, III, and IV respectively.

Figure 5. Chromatograms from lowest matrix match calibration standard with observed peak-to-peak signal-to-noise ratio. 

The linearity of the method is demonstrated by the calibration graphs obtained from matrix match standards as shown in Figure 6.1 to 6.4. 

Figure 6.1. Calibration curve of matrix match standard of Sudan I from quantitation transition. 
Figure 6.2. Calibration curve of matrix match standard of Sudan II from quantitation transition. 
Figure 6.3. Calibration curve of matrix match standard of Sudan III from quantitation transition. 
Figure 6.4. Calibration curve of matrix match standard of Sudan IV from quantitation transition. 

Method accuracy and precision were performed based on three replicates of blank matrix spiked with 1μg/Kg of Sudan I, II, and III respectively and 10 μg/Kg of Sudan IV. The observed mean concentration and % RSD for the three replicates are demonstrated in Table 2. 

Table 2. Results of 3 replicates of blank matrix spiked with Sudan I, II, III, and IV.

Commercially purchased tomato sauce in which Sudan I, II, III, and IV were demonstrated to be absent was used as blank matrix for recovery test. Recovery experiments were performed by spiking blank matrix before and after sample preparation with Sudan I, II, III, and IV at 2 concentration levels, each with 3 replicates. The average area observed before and after sample preparation were used for recovery calculation at each concentration level. Table 3 and 4 show recovery results at concentration level 1 and 2 respectively. 

Table 3. % Recovery of blank matrix spike at concentration level 1. 
Table 4. % RSD in Area and % Recovery of blank matrix spike at concentration level 2. 

Conclusion

By coupling the ACQUITY UPLC with Quattro micro API, a rapid and sensitive method has been developed for the analysis of Sudan I, II, III, and IV in tomato sauce. The ACQUITY UPLC is capable of performing fast analysis with narrow peaks and together with the multiple MRM transitions in Quattro micro API provides excellent sensitivity and selectivity for trace level quantitation and confirmation of Sudan dyes. In addition, the simple solid phase extraction method provides a cleaner extract and aids in lower detection limit. 

References

  1. F. Calbiani, M. Careri, L. Elviri, A. Mangia L. Pistarà, I. Zagnoni, Development and inhouse validation of a liquid chromatography electrospray-tandem mass spectrometry method for the simultaneous determination of Sudan I, Sudan II, Sudan III, and Sudan IV in hot chili products, Journal of Chromatography A, 1042 (2004) 123–130 

720001293, July 2005

Back To Top Back To Top