UPLC™-UV Analysis of Amino Acids in Dairy Products – Implementing an International Standard on the ACQUITY™ Premier System
Abstract
Reversed-phase Ultra-Performance Liquid Chromatography of amino acids in dairy products was carried out on an ACQUITY Premier System with a Binary Solvent Manager and a Fixed Loop Sample Manager using the analytical procedure prescribed by the Official Method of Analysis of AOAC International 2018.06 (AOAC Method 2018.06). The chromatographic conditions and the procedures, such as the preparation of mobile phase A, the injection mode and parameters, the derivatization recipe, and the use of an inline filter, have been improved or adapted for a better and reliable separation. These adjustments resulted in reliable separation of amino acids with excellent linearity, sensitivity, precision, peak shape and baseline separation for both standards and a selection of representative dairy products. This application note demonstrates a successful implementation of AOAC Method (2018.06) on an ACQUITY Premier System with a Binary Solvent Manager and a Fixed Loop Sample Manager.
Benefits
- AOAC Method 2018.06 offers a faster and a more complete analysis of amino acids for dairy products
- The ACQUITY Premier System with a Binary Solvent Manager and a Fixed Loop Sample Manager offers a reliable solution for an efficient separation of amino acids by AOAC Method 2018.06
- AccQ∙Tag™ Ultra derivatization kit and AccQ∙Tag Ultra Chemistry Kit simplify the implementation of the AOAC Method 2018.06
Introduction
Amino acids (AA) provide essential nutrients for human and animal growth and well-being. Total amino acids and amino acid profiles are important nutritional values. AA profiles are also characteristic for certain foods and could be used to detect potential adulteration. Many legacy AA analysis methods, such as AOAC Method 994.12 and AOAC Method 985.28, are based on performic acid oxidation followed by acid hydrolysis, then separation by ion exchange chromatography with ninhydrin post-column derivatization. However, the performic acid oxidation step is time consuming. Tyrosine is also destroyed in this oxidation step and needs to be analyzed separately. AOAC Method 2018.06 provides a faster and a more complete approach for the AA analysis.1 In this method, samples undergo acid hydrolysis followed by pre-column derivatization with 6-aminoquinolyl-N-hydroxysuccinimidyl carbamate (AQC), then separation by Reversed-phase Ultra Performance Liquid Chromatography (RP-UPLC) with Ultraviolet/visible (UV/Vis) detection. There is no overnight performic acid oxidation step, and tyrosine can be analyzed together with other AA. AOAC Method 2018.06 has also been recognized by other organizations as official methods, such as International Organization for Standardization (ISO) 4214:2022,2 International Dairy Federation (IDF) 254:2022,2 and Cereals and Grains Association (AACC) 07–50.01.3
Waters amino acid analysis solutions4,5 share a similar approach in terms of pre-column derivatization with AQC and RP-UPLC. The only difference is in the RP-UPLC, a longer column is used in the AOAC Method 2018.06. Therefore, many Waters amino acid analysis products have been employed in the AOAC Method 2018.06. These products include the ACQUITY UPLC BEH™ C18 (1.7 μm, 2.1 x 150 mm, p/n: 186002353), AccQ∙Tag™ Ultra Derivatization Kit (186003836), AccQ∙Tag Ultra Eluent A Concentrate (p/n: 186003838) and AccQ∙Tag Ultra Eluent B (p/n: 186003839). Besides the column and consumables, several Waters ACQUITY Systems, including the ACQUITY UPLC System, the ACQUITY UPLC H-Class System, and the ACQUITY UPLC I-Class System, have been successfully employed by labs that participated in the multi-lab study, which has generated excellent results that led to the approval of this AOAC Method 2018.06.6 Given that separation of AA is susceptible to LC instrument hardware and design, we evaluated the ACQUITY Premier System configured with a Binary Solvent manager and a Fixed Loop Sample Manager for the implementation of AOAC Method 2018.06. Particular focus was given to the chromatographic conditions to achieve a reliable and efficient separation for AA.
Experimental
The experimental details prescribed in AOAC Method 2018.06 were followed in this study with minor adaptations. The key procedure and conditions are briefly described here. Additional details can be found in AOAC Method 2018.06.
AA calibration standards
2.5 mM AA stock solution: The AA stock solution (Waters p/n: WAT088122) contained 2.5 mM of each following amino acid (except L-cystine at 1.25 mM) in 0.1 M HCl: L-alanine (Ala), L-arginine (Arg), L-aspartic acid (Asp), L-cystine (Cys), L-glutamic acid (Glu), L-glycine (Gly), L-histidine (His), L-isoleucine (Ile), L-leucine (Leu), L-lysine (Lys), L-methionine (Met), L-phenylalanine (Phe), L-proline (Pro), L-serine (Ser), L-threonine (Thr), L-tyrosine (Tyr), and L-valine (Val). 0.5 mM AA solution and 0.05 mM AA solution were prepared from the AA stock solution by serial dilution with 0.1 M HCl. AA calibration standard solutions at 0–19.2 μM (pmol/μL) and Norvaline (Nva) at 7.7 μM (all were final concentrations after derivatization) were prepared according to Table 1. Nva was used as an internal standard (I.S.).
Note: Although presented in this solution, cystine was not used for quantification and was prepared separately.
Alternatively, Waters Food and Feed AA standard solution (Waters p/n: 186009299) could be used for AA calibration standards. It contained 0.5 mM of each 17 AA (the same AA as in the AA stock solution) plus additional 0.5 mM of the following AA: taurine (Tau), α-aminobutyric acid (AABA), Methionine sulfone (MetSO2), and Cysteic acid (Cya).
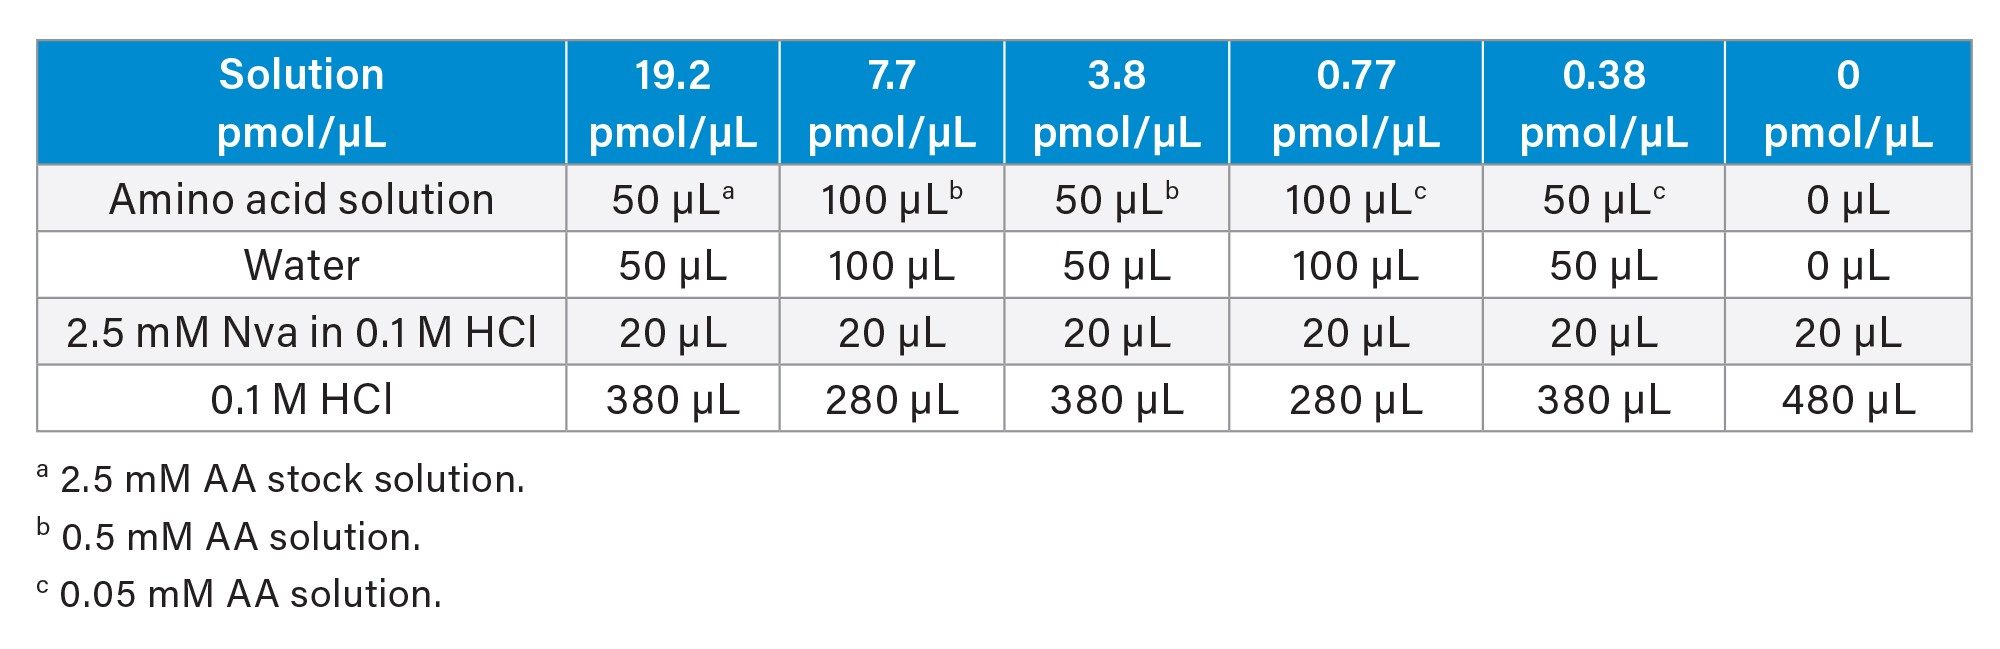 Table 1. Amino acid calibration standard solution preparation and concentrations.
Cystine calibration standards
Cystine stock solution (10 mM) was prepared by weighing out 240 mg cystine (recorded in 0.01 mg) into a 100 mL volumetric flask and diluted to the mark with 0.05 M NaOH. Cystine solution (1 mM) was prepared by diluting the cystine stock solution with 0.05 M NaOH. The 10 mM cystine stock solution was kept at –20 °C for up to 3 months. The 1 mM cystine solution was prepared freshly for each analysis.
Cystine calibration standards was prepared by adding 0, 10, 20, 50, 100, 200 μL of 10 mM cystine stock solution into 10 mL vials, completed to 1100 μL with water. To each vial, added 600 μL DDP (3,3’- dithiodipropionic acid) solution (1% DDP in 0.2 M NaOH), 600 μL 0.2 M HCl, 200 μL 10mM Nva stock solution, and 2500 μL phenol–HCl solution (0.1% phenol in 12 M HCl). The final concentrations after derivatization for these standard solutions were 0, 0.38, 0.77, 1.9, 3.8, and 7.7 μM (pmol/μL), respectively. Sparged vials for a minimum of 5 s with a stream of nitrogen to displace oxygen. Closed vials with screw caps and mixed on a vortex mixer. Note: Phenol–HCl solution must be added under the fume hood.
Sample Preparation
Infant formulas and dairy powder samples were reconstituted first by adding 2.5 g powder to 40 g water and mixed thoroughly. 800 ± 20 mg of the reconstituted samples were weighted into 10 mL glass vessels or vials with screw caps. (Recorded the sample mass to 0.01 mg.) To each vessel or vial, 600 μL DDP solution (1% DDP in 0.2 M NaOH), 600 μL 0.2 M HCl, 500 μL 10 mM Nva stock solution, and 2500 μL phenol–HCl solution (0.1% phenol in 12 M HCl) were added.
Acid Hydrolysis (samples and cystine standards only, no AA standards)
Vessels or vials that contain ample solutions or cystine calibration solutions were placed in an oven at 110 ± 2 °C for 24 ± 0.5 h.
Alternatively, samples were hydrolyzed using a microwave hydrolysis device (Discover Prep, CEM Corp, NC). 35 mL borosilicate glass pressure vessels (pressure rated up to 300 psi) (CEM p/n: 909036) were used along with silicone caps (CEM p/n: 909350). Teflon coated micro stir bars (CEM p/n: 162810) were used for mixing. The acid hydrolysis step was carried out using the following parameters: Dynamic Control with a max power setting of 300 W; temperature set at 160 °C for 20 min.; the pressure limit set at 300 psi; stirring level set to High; Nitrogen gas blow during cooling.
Neutralization and Dilution (of samples and cystine standards)
After the acid hydrolysis, hydrolysates were allowed to cool down. Then, 0.2 mL of each hydrolysate was transferred into a 1.5 mL microtube, followed by addition of 0.2 mL 6 M NaOH and 1.6 mL 0.1 M HCl. The mixture was thoroughly mixed and then filtered through a 0.45 μm PVDF membrane filter into a separate 1.5 mL microtube.
Derivatization (of samples, cystine standards, and AA- standards)
The AOAC Method 2018.06 derivatization procedure or the Care and Use manual of the AccQ∙Tag Ultra derivatization kit7 (Waters p/n: 186003836) was followed in preparation of the AccQ∙Tag Ultra Derivatization Reagent and in derivatization of calibration standards, neutralized sample solutions, or neutralized converted cystine standards. (Note: The Care and Use manual procedure is equivalent to the derivatization procedure in AOAC Method 2018.06). The following derivatization recipe (volume ratio) was used instead of the original recipe in the manual: 100 μL AccQ∙Tag Ultra Borate buffer [reagent 1 in the AccQ∙Tag Ultra Derivatization kit], 10 μL calibration standard solutions, or neutralized sample solutions, or neutralized converted cystine standard solutions, and 20 μL reconstituted AccQ∙Tag Ultra reagent. (Note: this modification helped to improve the peak shape in chromatography).
UHPLC Separation Conditions
|
UHPLC system: |
ACQUITY Premier System consists of a Binary Solvent Manager, a Fixed Loop Sample Manager, a Column Heater with active pre-heater (CH-A) and a Photodiode Array (PDA) eLambda Detector |
|
UV/Vis wavelength: |
260 nm |
|
Inlet tubing to detector: |
0.004 inch ID, 10.5 inch tubing assembly (Waters p/n: 430001784) |
|
Software: |
Empower™ 3 Chromatography Data System |
|
Column: |
ACQUITY UPLC BEH C18 Column, 1.7 μm, 2.1 mm × 150 mm (Waters p/n: 186002353) AccQ∙Tag Ultra C18 Column, 1.7 μm, 2.1 mm × 150 mm (Waters, p/n: 186009954) (Note: AccQ∙Tag Ultra C18 Columns are specially manufactured ACQUITY UPLC BEH C18 columns for amino acid analysis) |
|
Column inline filter: |
ACQUITY Column In-Line filter 0.2 μm (Waters p/n: 205000343) |
|
Sampling rate: |
10 Hz |
|
Column temperature: |
50 °C |
|
Sample temperature: |
20 °C |
|
Sample loop size: |
1 μL |
|
Injection volume: |
1 μL |
|
Injection mode: |
Partial loop with needle overfill (PLNO) with 6 times overfill volume |
|
Mobile phase A: |
Mixture of AccQ∙Tag Ultra Eluent A Concentrate (Waters p/n: 186003838) and water at 1:6 (v/v) (Note: Use a 100 mL Class A volumetric flask to transfer 100 mL AccQ∙Tag Ultra Eluent A Concentrate and mix with 600 mL water.) |
|
Mobile phase B: |
AccQ∙Tag Eluent B (Waters p/n: 186003839) |
|
Weak needle wash solution: |
95:5 (v/v) Water:acetonitrile |
|
Strong needle wash solution: |
5:95 (v/v) Water:acetonitrile |
|
Seal-wash solvent: |
50:50 (v/v) Water:acetonitrile |
|
Flow rate: |
0.4 mL/min |
|
Gradient elution: |
(see gradient table below) |
Gradient Table

Calculation
Please refer to the AOAC Method 2018.06 for details in calculations.
Results and Discussion
Analytical Procedure Overview
In the AOAC Method 2018.06, proteins were hydrolyzed in 6 M HCl in the presence of phenol and DDP (3,3’-dithiodipropionic acid). Nva was added as an internal standard. Cystine and cysteine were converted to S-2-carboxyethylthiocysteine (XCys) by DDP.8 After hydrolysis and neutralization, AA and XCys were derivatized with AQC. Derivatized AA and XCys were separated by RP-UPLC with UV/Vis detection at 260 nm. In acid hydrolysis, Gln and Asn were converted to Glu and Asp, respectively. Thus, Glu values represented the combined values of Glu and Gln, and Asp values represented the combined values of Asp and Asn. XCys values represented the combined values of cysteine and cystine. Tryptophan was degraded by acid hydrolysis and could not be analyzed by this method or any acid hydrolysis based method.
Implementation of AOAC Method 2018.06 on the ACQUITY Premier System
The ACQUITY Premier System configured with a Binary Solvent Manager and a Fixed Loop Sample Manager has a different dispersion volume, gradient delay volume and system dwell volume compared to other ACQUITY UPLC Systems. When implementing the AOAC Method 2018.06, the chromatographic conditions and procedures need to be adjusted to achieve a reliable and efficient separation. The main adjustments of the chromatographic conditions and procedures include an improved procedure for mobile phase A preparation, the use of a PLNO injection mode with 6 times of overfill, the use of an inline filter, and a slightly modified derivatization recipe.
Preparation of the Mobile Phase A
The early eluting AA with retention times (RT) of less than 10 mins were found to be extremely sensitive to the initial mobile phase A composition. Different batches of freshly prepared mobile phase A often caused a significant RT shift for these compounds. To reduce the RT changes, the mobile phase A was prepared by using a Class A volumetric flask instead of a graduated cylinder in transferring the AccQ∙Tag Ultra Eluent A Concentrate (see the UHPLC Separation Conditions in the Experimental section). In addition, the volume ratio of AccQ∙Tag Ultra Eluent A Concentrate to water in mobile phase A preparation was modified from 150:850 to 100:600 (v/v). This adjustment in volume ratio slightly increased the RT of AA, preventing a small variation in the mobile phase A preparation from causing a loss of resolution of the first eluting AA (His) from the derivatization peak, which eluted prior to His.
Improving Peak Shape
The peak shapes of early eluting AA (Figure. 1) were skewed. This was probably due to the strong solvent effect, resulting from a significantly higher organic content in the sample diluent comparing to the initial mobile phase. Various approaches have been tested to improve the peak shape. Figure. 1 shows the effects of different conditions on the AA peak shape. These conditions included different injection modes with different needle overfill volume ratio, use of a column inline filter or a guard column, and an adjusted lower sample diluent organic content. The best peak shape was obtained using a combination of the following conditions: a PLNO injection mode with a needle overfill volume ratio of 6, use of an inline filter, and a lower organic content in sample diluent (by changing the borate buffer from 70 μL to 100 μL in the derivatization step).
 Figure 1. Effects of various chromatographic conditions on the peak shape of an Food and Feed AA standard mix. Peaks: 1) His; 2) Tau; 3) Ser; 4) Arg; 5) Gly; 6) Asp; 7) MetSO2; 8)Glu; 9) Thr; 10) Ala; 11) Pro; 12) AABA; 13) Deriv. peak; 14) Cys; 15) Lys; 16) Tyr; 17) Met; 18) Val; 19) Nva; 20) ILe; 21) Leu; 22) Phe. Conditions: (A) Injection mode: Partial loop with needle overfill (PLNO); B) PLNO with 3 times needle overfill; (C) PLNO with 6 times of Needle Overfill; (D) Full Loop (FL) injection mode with 6 times Loop Overfill; (E) With a guard column (AccQ∙Tag Ultra C18, 1.7 μm, VanGuard Pre-Column, 2.1 x 5 mm); (F) With an inline filter 0.2 μm; (G) With an inline filter and an adjusted derivatization recipe (100 μL borate buffer instead of 70 μL).
Column Temperature
The column temperature was also found to be a crucial factor in achieving optimal separation of AA. Figure. 2 shows the effects of column temperature on the RT and selectivity of AA. Even slight variations in column temperature (± 2 °C) led to significant changes in RT and selectivity of AA. The column temperature of 50 °C was confirmed the best condition for an adequate retention and a good resolution for AA.
 Figure 2. Effect of column temperature on the separation.
Sensitivity and Linearity
The AA working standard solutions at concentrations from 0 to 19.2 μM were analyzed to evaluate the linearity. The data points were fitted to a line through zero by the least square regression without weighting. Table 2 shows representative calibration equations, the coefficient of determination (R2), and the estimated limit of quantitation (LOQ) for each AA. The R2 of larger than 0.997 were obtained for all AA. The LOQ was estimated using the standard deviation of the response and the calibration slope approach described in an industrial guidance.9 The responses of the AA were calculated as the peak area ratio of AA over I.S. (Nva) times the concentration of I.S. Results from five injections of an AA standard mix solution at 0.19 μM were used in the estimation of LOQ. The estimated LOQ were in the range of 0.02 to 0.16 μM (see Table 2).
 Table 2. Representative calibration results and estimated LOQ.
Repeatability and Intermediate Precision of RP-UPLC
The repeatability in RT, peak tailing, resolution and response were evaluated using replicate injections (n=4, measured within a day) of a Food and Feed AA standard mix solution (7.7 μM). Table 3 shows the mean and the RSD values of RT, peak tailing, resolution and response for each AA. RSD values of less than 3% for early eluting compounds (RT <10 min) and less than 1% for other compounds were achieved in RT. The peak tailing was less than 1.07 for all AA except His (the first eluting AA), which showed a peak tailing of 1.11. The resolutions of larger than 2.0 were achieved for these compounds except the MetSO2, which had resolution of 1.71 (between Asp and MetSO2). Please note that MetSO2 was not on the AA list of the AOAC 2018.06 and was not found in dairy samples. (It was included in the Waters Food and Feed AA standard mix). The response RSD of these AA were found 5.3% for Glu and less than 3.2% for the rest of the AA.
The intermediate precision was also evaluated using the Food and Feed AA standard mix solutions (7.7 μM) prepared separately and analyzed on 3 different days using 3 columns of different batches. Table 4 shows the summary results. The RT RSD was less than 5.0% for early eluting AA (RT < 10 min) and less than 1.7% for the remaining AA. The peak tailing was less than 1.11 for all AA. Resolution was higher than 2.0 for all compounds except the MetSO2, which showed resolution of 1.72 for the Asp and MetSO2 pair. The response RSD of these AA was 9.5% for Tau and less than 4.2% for the other AA.
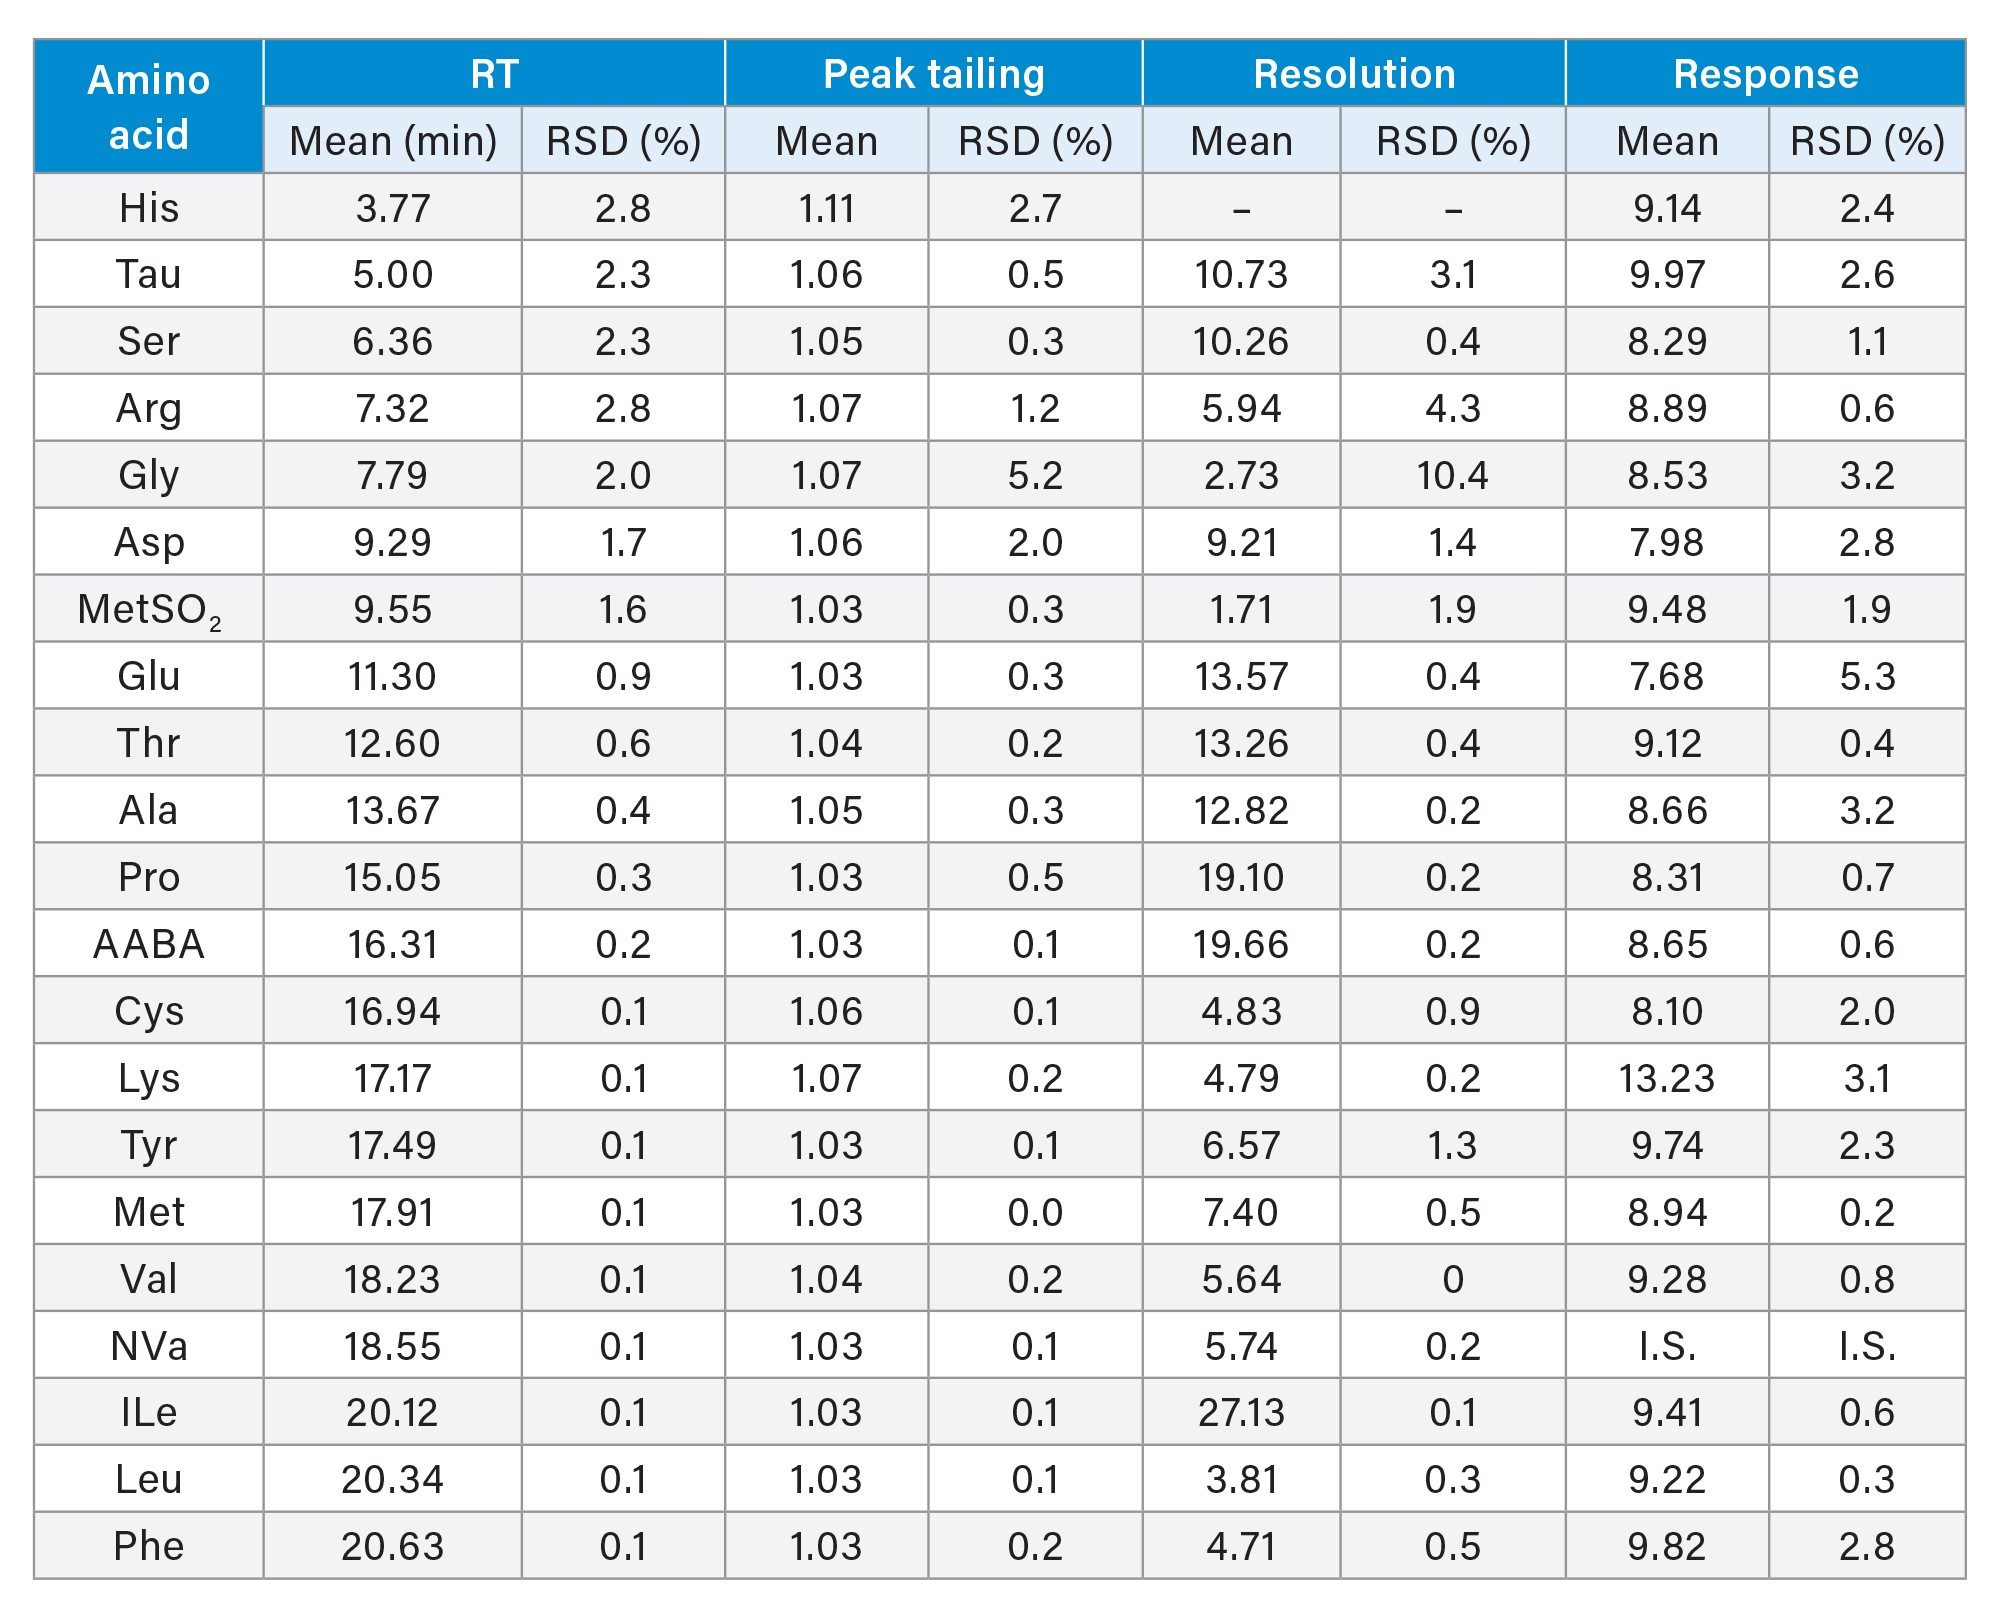 Table 3. Repeatability in retention time, peak tailing, resolution, and response for a Food and Feed AA standard solution evaluated on an ACQUITY Premier System with a Binary Solvent Manager and a Fixed Loop Sample Manager.
Separation of Dairy Products
All AA in the dairy products was successfully separated with baseline resolution (Figure. 3). These dairy samples include bovine milk powder, goat milk powder, infant formula powder, whey protein isolate, and casein powder. Table 5 shows the determined AA content in these dairy products. The infant formula was analyzed in triplicate, yielding RSDs of less than 4.8% for AA results.
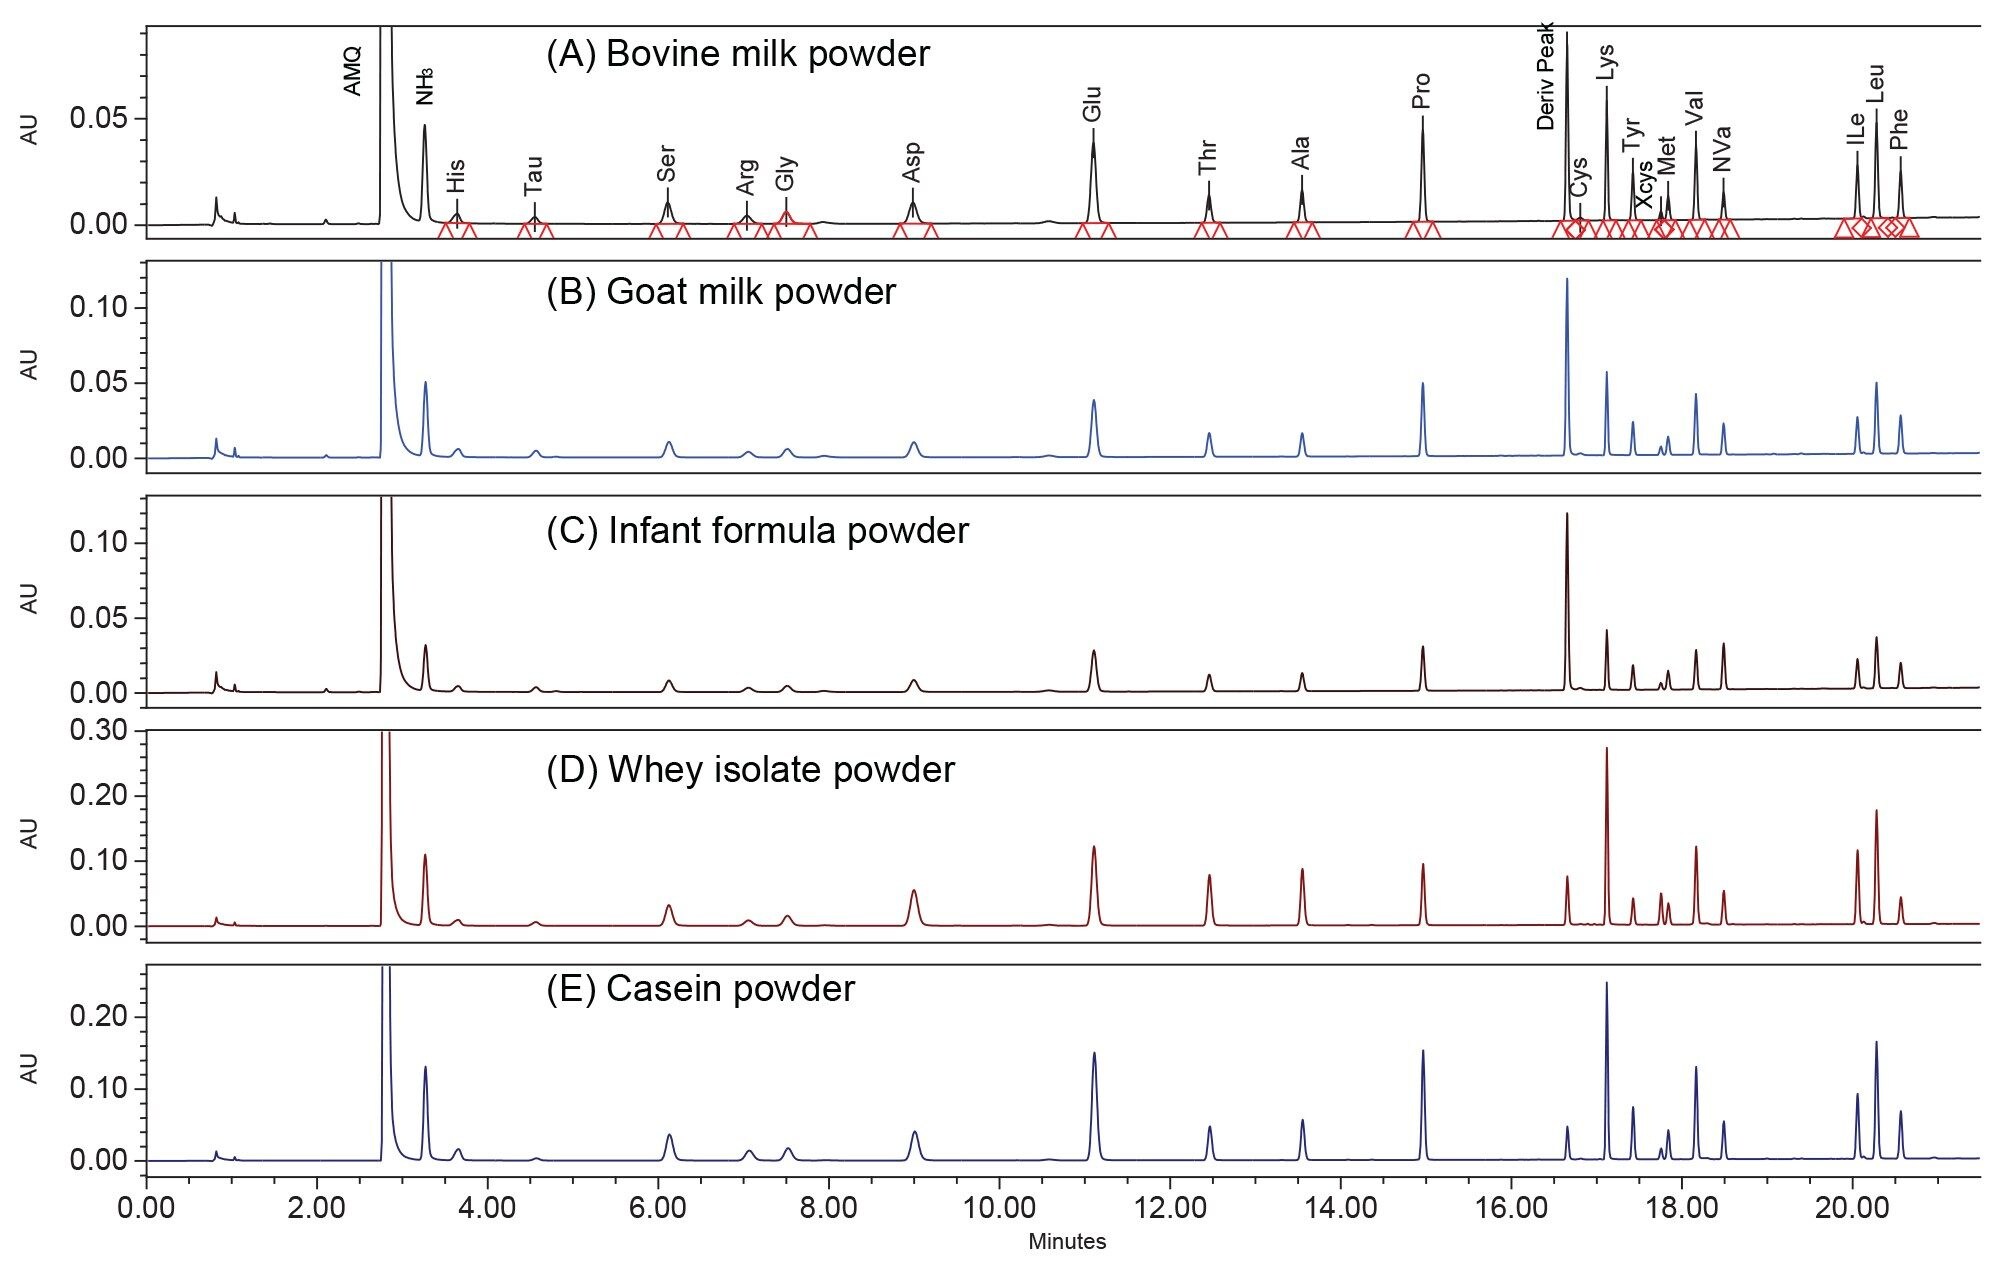 Figure 3. Chromatograms of dairy products A) Bovine milk powder; B) Goat milk powder; C) Infant formula powder; D) Whey protein isolate powder; E) Casein protein powder.
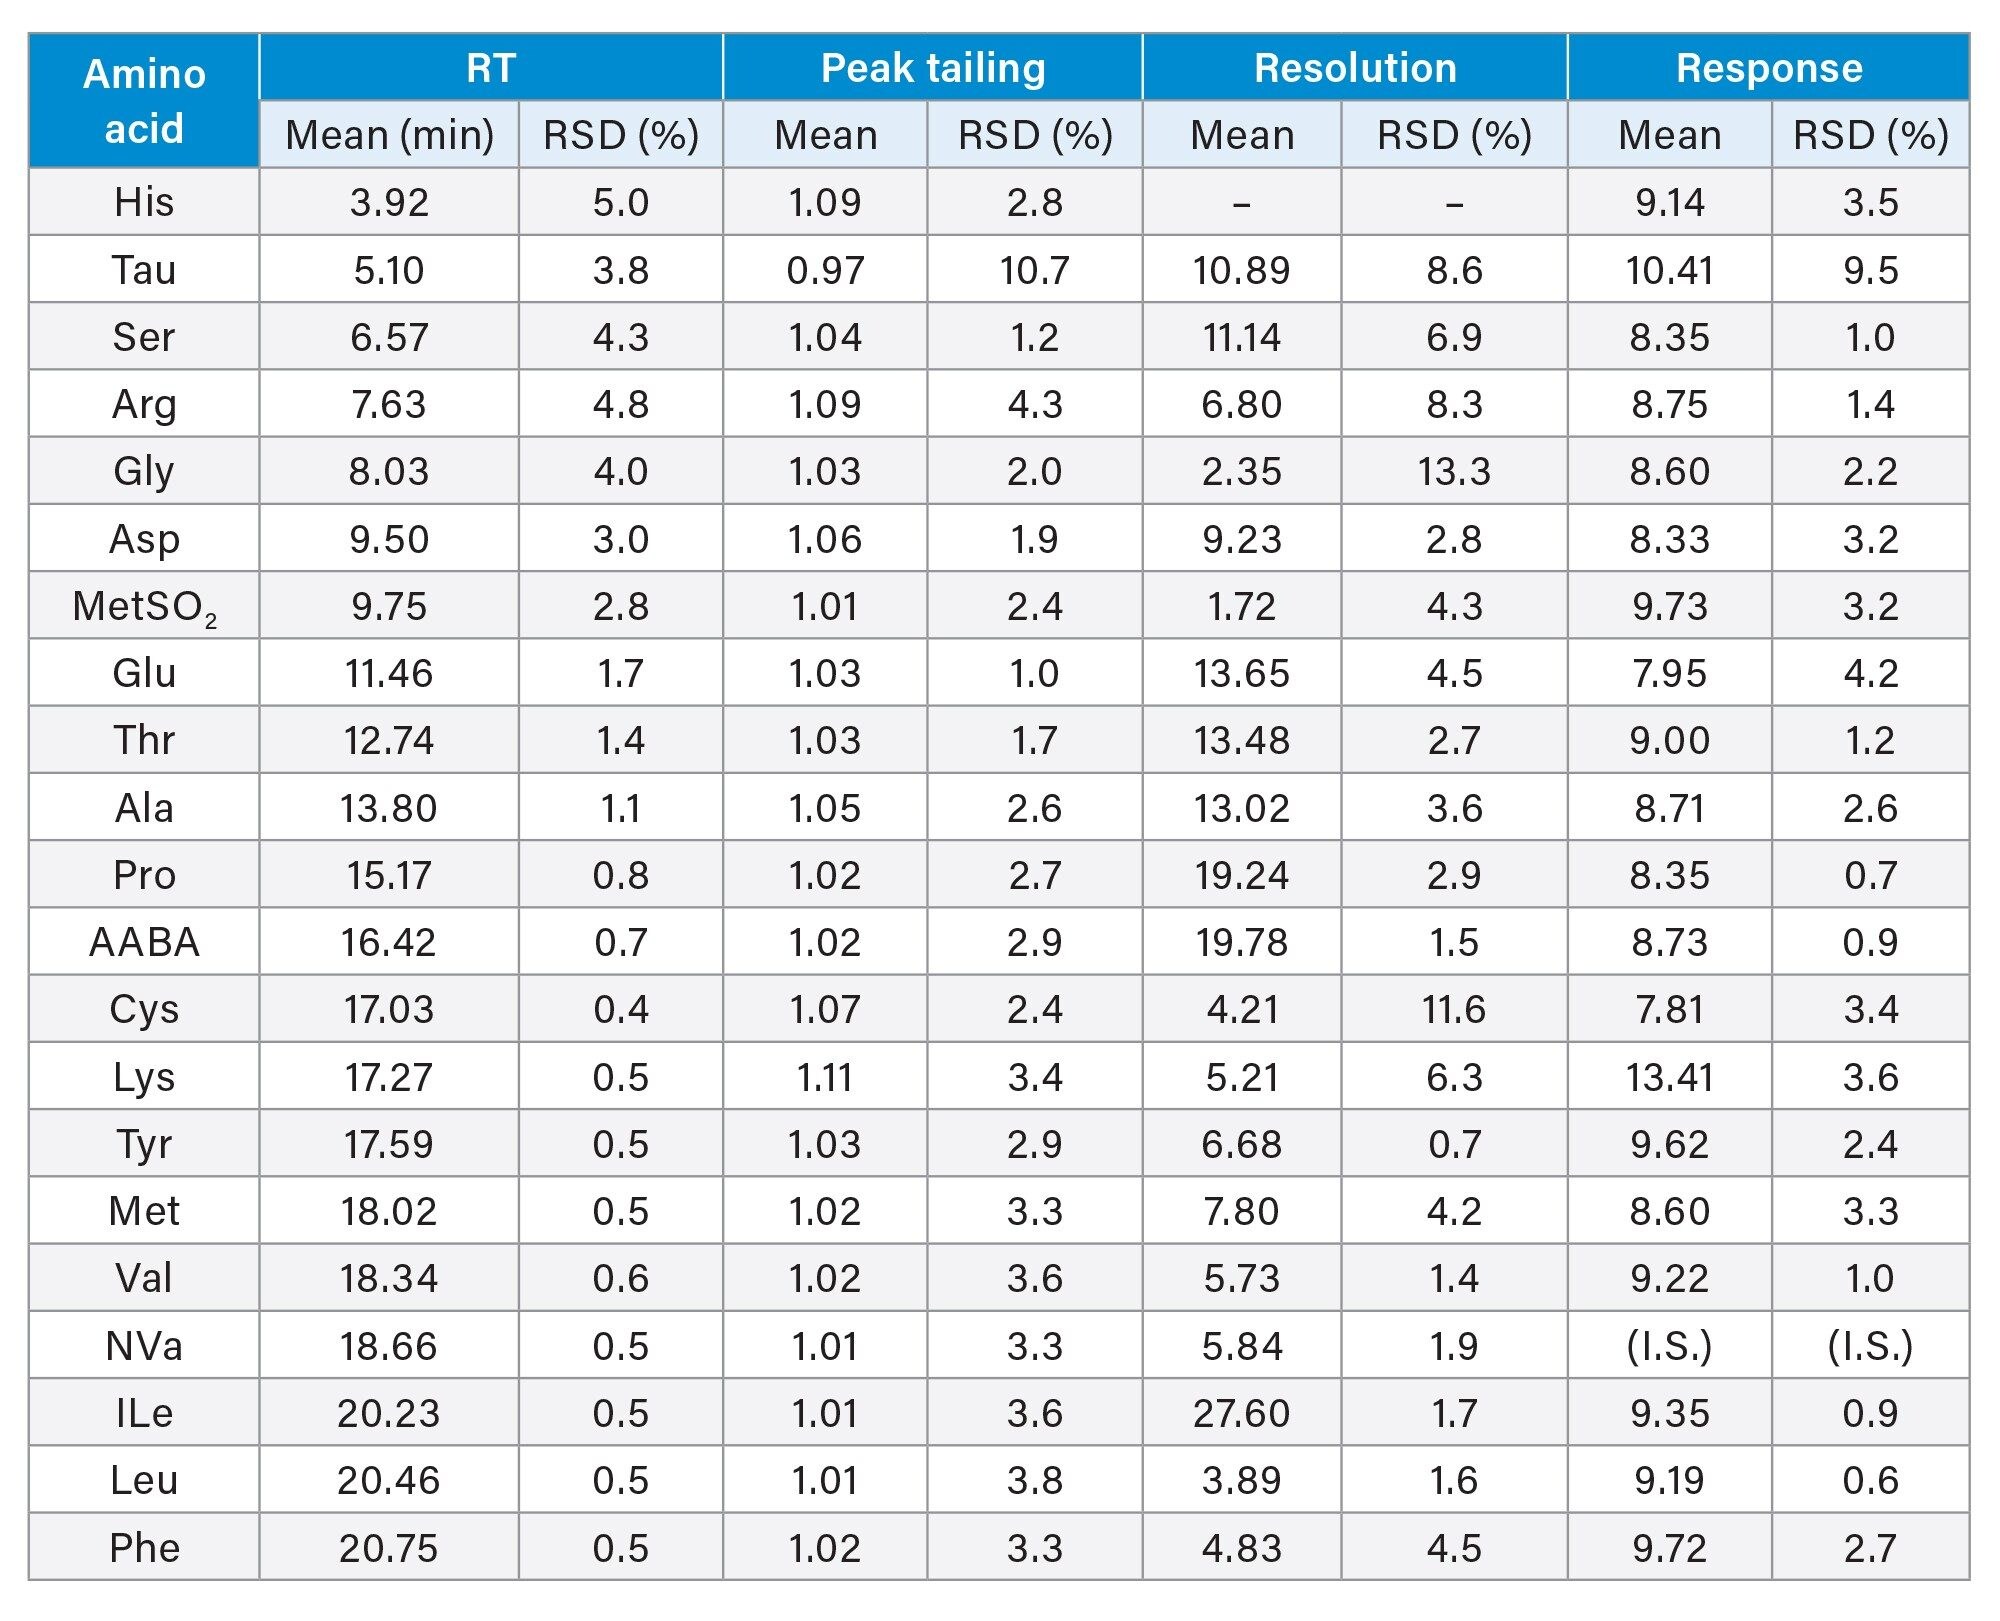 Table 4. Intermediate precision of retention time, peak tailing, resolution and response for the amino acid separation on ACQUITY Premier System with Binary Solvent Manager and Fix Loop Sample Manager.
 Table 5. Amino acids content in dairy products.
Conclusion
The determination of AA in dairy products has been successfully carried out on an ACQUITY Premier System configured with a Binary Solvent Manager and a Fixed Loop Sample Manager using an AccQ∙Tag Ultra C18 Column (1.7 μm, 2.1 mm × 150 mm). The analytical procedure closely followed the AOAC Method 2018.06 with minor adaptations, including an improved mobile phase A preparation procedure for more consistent AA RT, optimized chromatographic conditions (injection mode/parameters and the use of an inline filter) and a modified derivatization recipe for better peak shape. Waters AccQ∙Tag Ultra consumables (Derivatization kit, Standard and Chemistry kit, and columns), which are compliant with the AOAC Method, have been instrumental to the success of this analysis. Separation of AA on the ACQUITY Premier System under the modified AOAC Method conditions demonstrated excellent linearity, sensitivity, and repeatability (including intermediate precision). Excellent peak shape and resolution were achieved for all AA. Analysis of AA in common dairy samples, such as infant formula, bovine milk, goat milk, whey and casein protein powder, demonstrated excellent analytical performance. The ACQUITY Premier System with a Binary Solvent Manager and a Fixed Loop Sample Manager and the AccQ∙Tag Ultra Chemistry Kit offers a reliable solution for the determination of AA in dairy products.
References
- Jaudzems, G.; Fuerer, C. Determination of total amino acids in infant formulas, adult nutritionals, dairy, and cereal matrixes by UHPLC–UV: Interlaboratory Validation Study, Final Action 2018.06. Journal of AOAC International 2022, 105 (6), 1625–1639.
- International Organization for Standardization. (2022). Milk and milk products – Determination of amino acids in infant and adult/paediatric nutritional formulas and dairy products (ISO Standard No. 4214:2022).
- Cereals and Grains Association. (2022). Total Amino Acids by UHPLC-UV (AACC 07-50.01).
- UPLC Amino Acid Analysis Solution System Guide. Waters Corporation. 71500129702 Revision B, 2007.
- Amino Acid Analysis Application Notebook. Waters Corporation. 720006130, 2018.
- For a list of Waters ACQUITY System used in the multi-lab testing, please refer to the supplemental Table 1 in reference 1.
- AccQ∙Tag Ultra Derivatization Kit Care and Use Manual. Waters Corporation. 715001331 Rev. A, 2024.
- Cohen, S. Analysis of Sulfur Containing Amino Acids III. Alkylation of Cysteine. Waters Lab Highlights. LAH0379, 1988.
- ICH. (2005) Q2(R1) Validation of Analytical Procedures: Text and Methodology Guidance for Industry.(Accessed on June 2nd, 2023).
720008632, December 2024