This is an Application Brief and does not contain a detailed Experimental section.
This application brief demonstrates the advantages of coupling MALDI and IMMS for polymer analysis, using copolymers as a model.
Increased confidence and simplified data interpretation.
Polymer analysis by mass spectrometry has been well published using several ionization techniques, typically Electrospray Ionization (ESI) or Matrix Assisted Laser Desorption Ionization (MALDI).1,2 Each technique has its own merits and there are many analytical reasons for the selection of the ionization technique.
ESI commonly generates several series of multiply charged ions causing additional mass spectral complexity. Whereas, MALDI generates singly charged ions and is one of the reasons for its popularity. There is a second advantage when ion mobility mass spectrometry (IMMS) is being performed. Singly charged ions tend to grow in size and shape in a predictable manner. As a consequence we observe a single polymeric ion series forming a roughly straight line in the mobility plot which is well separated from the matrix (which has the shorter drift time). Figure 1 shows both MALDI and ESI data for the same samples. ESI generates multiple series of multiply charged ions that do not grow in this uniform manner; therefore the mobility plots are more complex.
The complexity of a polymer sample greatly increases when copolymers and/or mixtures are present.
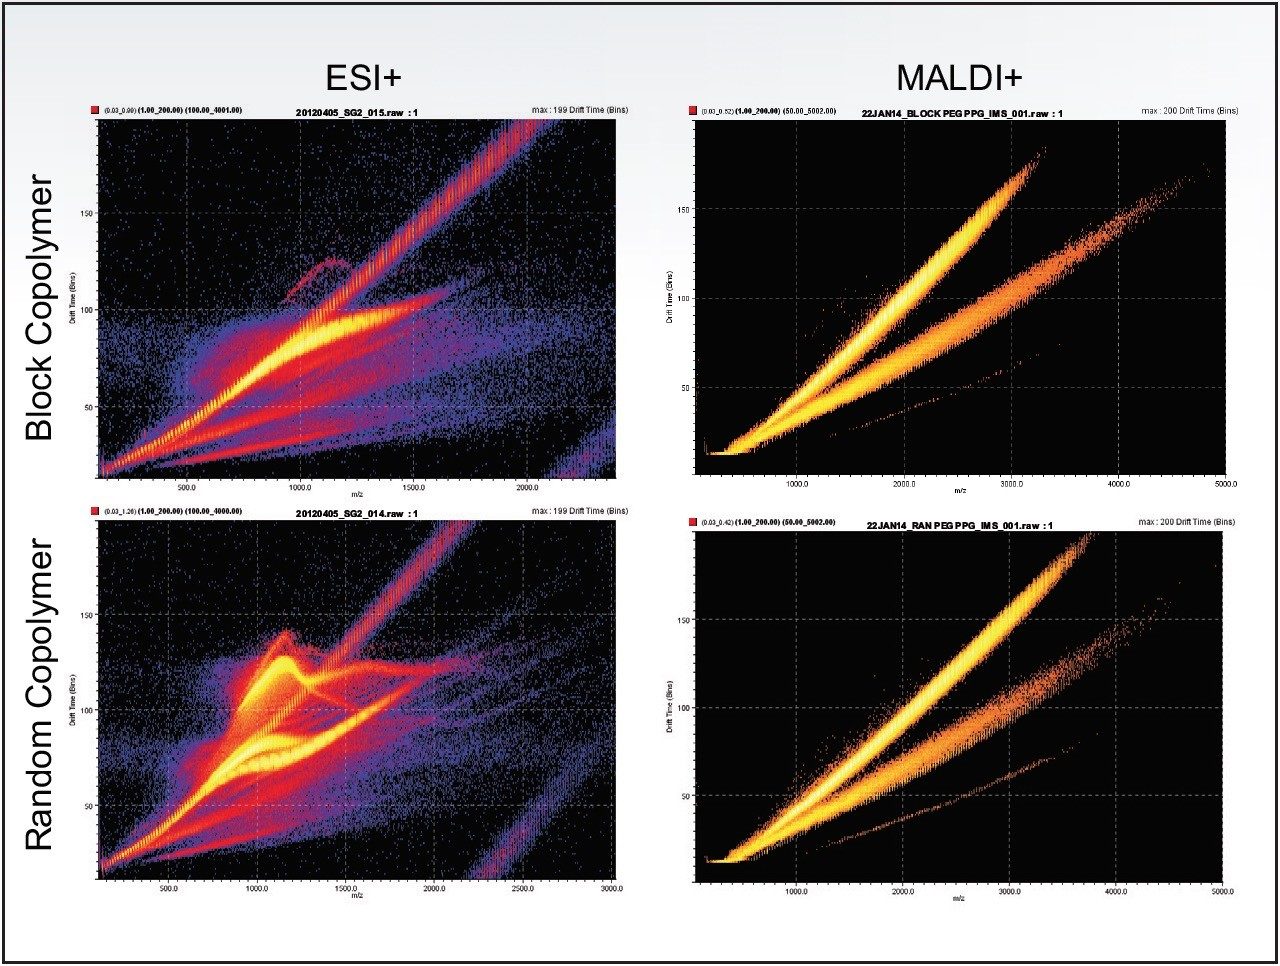
To demonstrate the benefits of using MALDI-IMMS a mixture of a random and a block copolymer, both containing polyethylene glycol (PEG) and polypropylene glycol (PPG) repeat units, was analyzed. The mixture was analyzed on a Waters SYNAPT G2-S High Definition Mass Spectrometry (HDMS) System, allowing the ions to be separated by ion mobility and detected by a time-of-flight mass spectrometer.
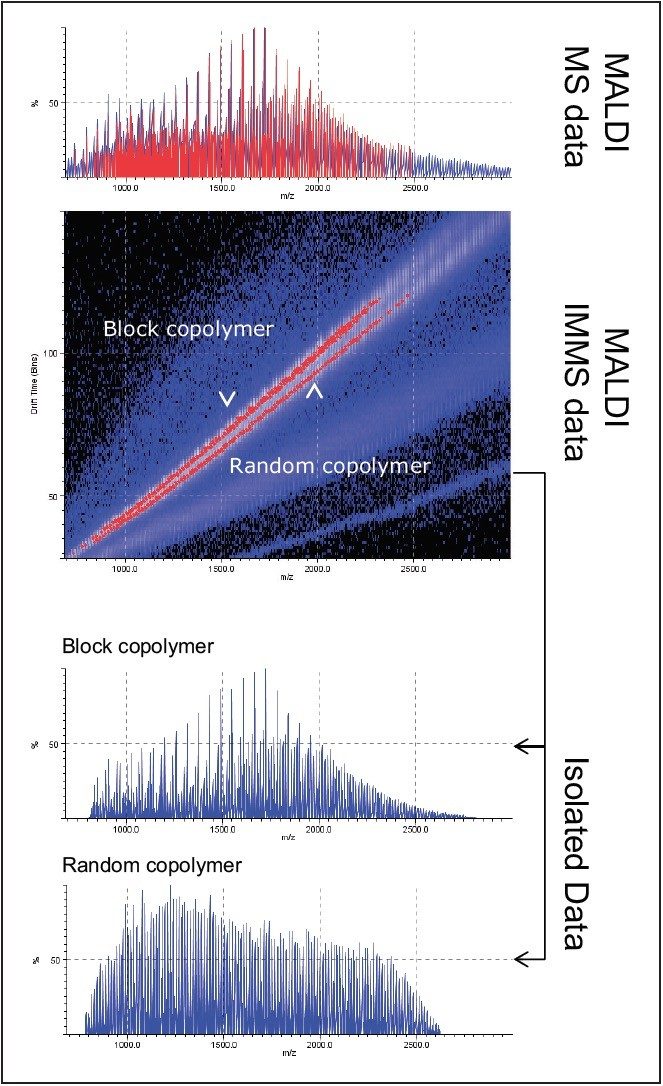
The results of this experiment are shown in Figure 2 and are separated into two parts. First are the full mass spectrum and mobility plot are shown. Here the complexity of the mass spectrum and the degree of separation by ion mobility can be seen. Ions above a chosen threshold have been peak detected and identified by a red line or dot in the spectrum or mobility plot, respectively. Next, the lower two mass spectra are the ion series isolated using DriftScope Software and displayed as a single copolymer rather than a mixture. These isolated areas of the mobility plot and associated mass spectra can be interpreted individually. Separation and confident identification without IMMS would not have been possible because the ion series are complex and overlapping.
A copolymer mixture was analyzed using MALDI-IMMS. The presence of only singly charged ions made it possible to separate the polymers within the mixtures. Aspects of the whole data set can be viewed in isolation using DriftScope software as a result of separation according to their drift times. Therefore data interpretation can be performed on a single polymeric ion series, simplifying data interpretation and increasing confidence in results.
720005123, August 2014