This application note describes comprehensive analysis of impurities using UNIFI Scientific Information System.
Impurity identification of aripiprazole in forced degradation experiments was successfully completed using ultra performance liquid chromatography, high resolution mass spectrometry, and the UNIFI Scientific Information System. The ability to acquire accurate MSE data within one injection gave a complete overview of the samples and allowed aripiprazole and its impurities to be identified. UNIFI enabled the use of customizable workflow steps to allow data analysis to be performed easily and efficiently. In addition, impurities identified could be readily stored and retrieved from the scientific library embedded within UNIFI. The relationships between aripiprazole and its impurities were easily visualized using the data evaluation tools present in UNIFI.
Impurity profiling of the active pharmaceutical ingredient (API) is an essential part of drug development. It is critical to ensure safety and quality of the API – and the resultant drug product – and it enables a more thorough understanding and better control of the synthetic process. By monitoring and characterizing degradation pathways, impurity profiling gives insight into the impact of storage conditions on compound integrity.
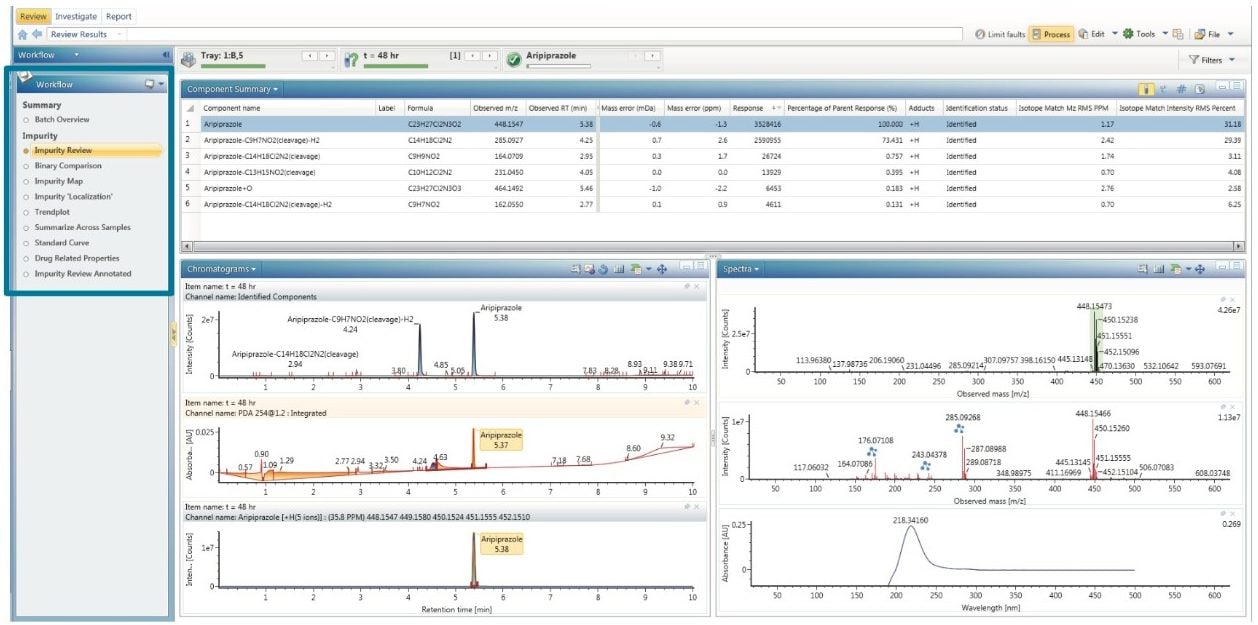
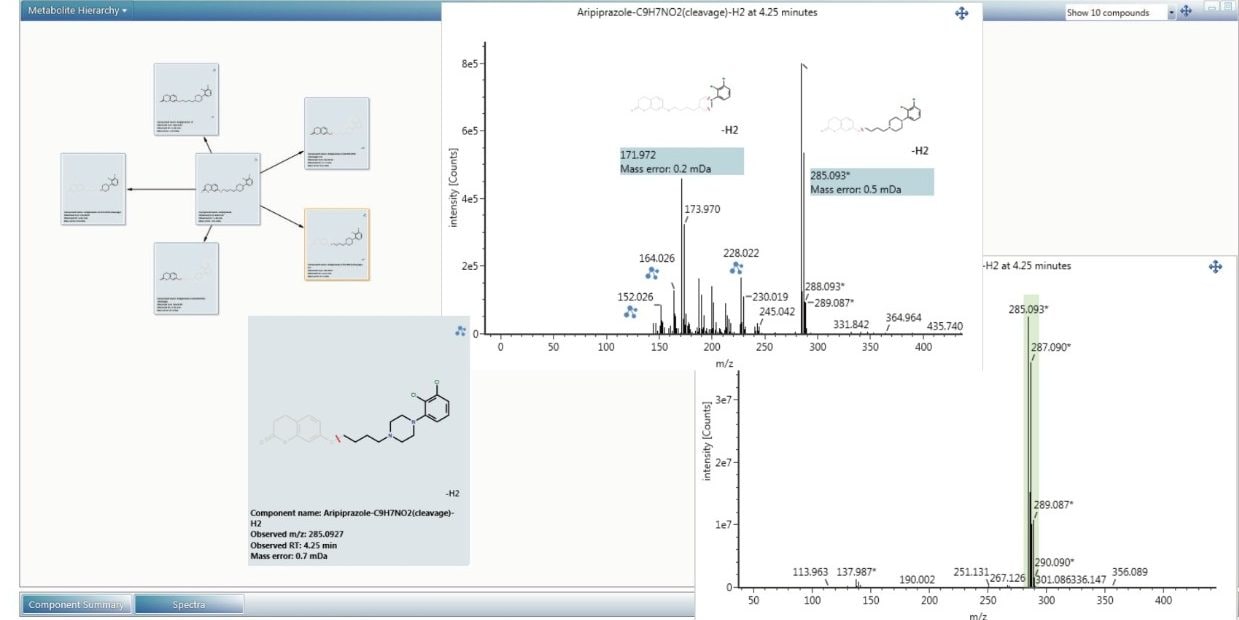
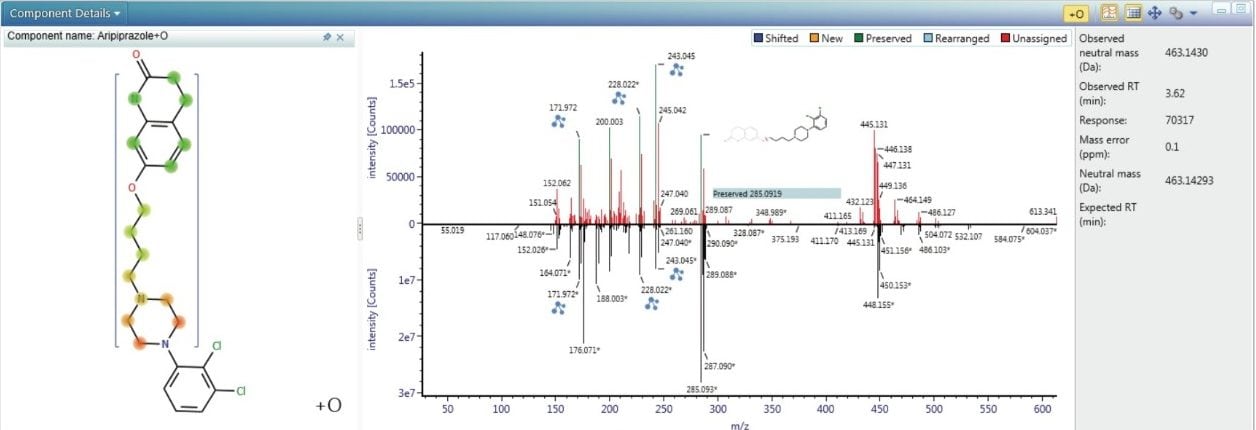
By employing UPLC/UV in combination with high sensitivity mass spectrometry (HSMS) and automated data analysis, characterization of both known and unknown impurities can be performed – and has been effectively utilized in the pharmaceutical industry for several years.1,2 Continued advances in high resolution mass spectrometry (HRMS) techniques allow for even more comprehensive information generation. Recently, the development of more intelligent software tools such as the UNIFI Scientific Information System has proven extremely beneficial to scientists for data evaluation, interrogation, and storage of information in libraries. It also represents a powerful analytical platform for HRMS impurity profiling.
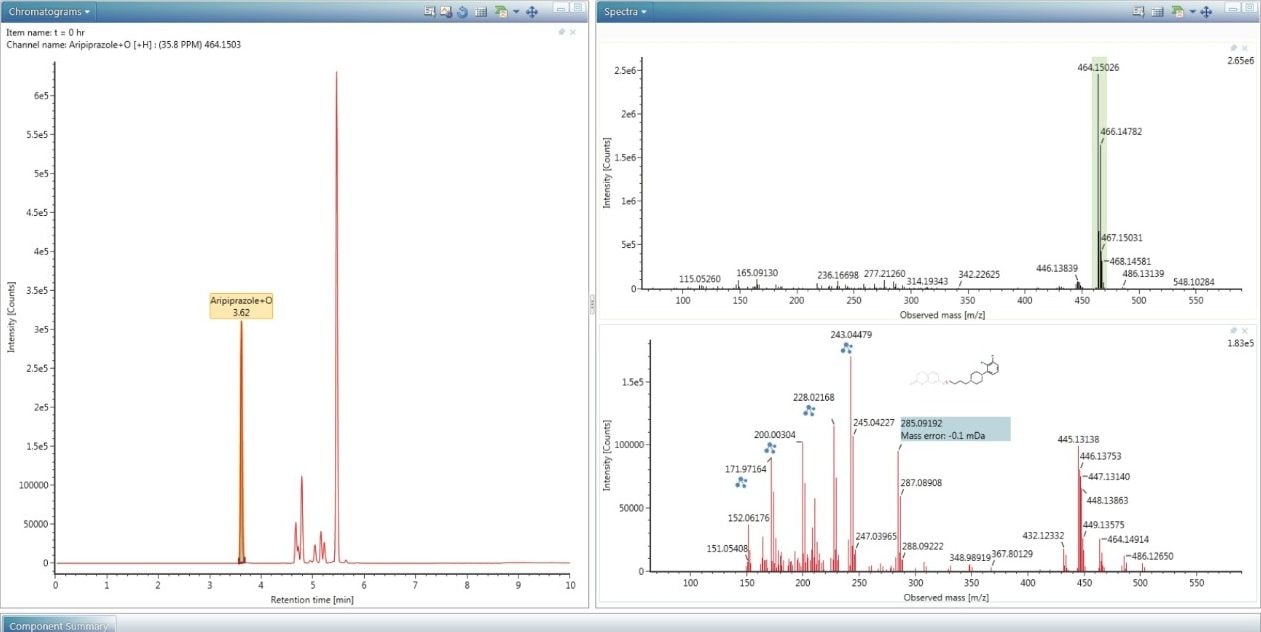
A comprehensive precursor and product ion dataset is acquired by use of the MSE acquisition mode. MSE simultaneously acquires full scan precursor and product ion spectra from a single acquisition without the requirement to preselect precursor ions. This simplifies data acquisition because it does not require advanced knowledge of the analytes.3 Furthermore, it ensures all ionizable impurities can be detected.
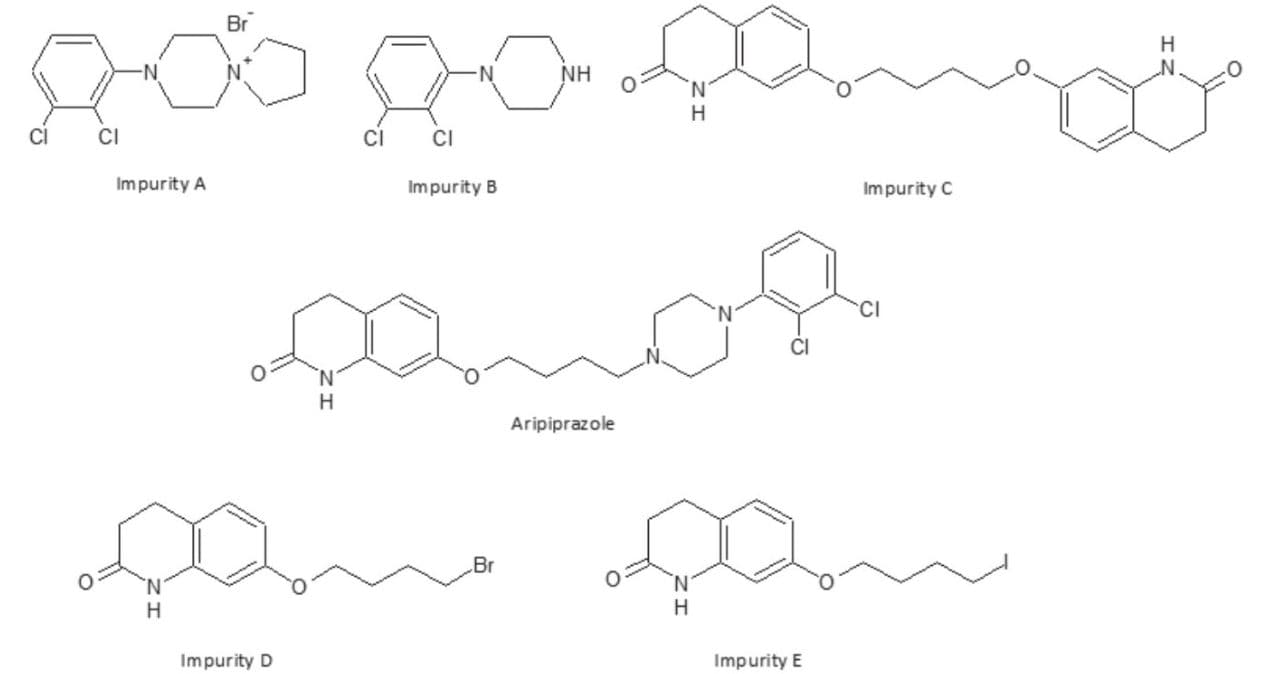
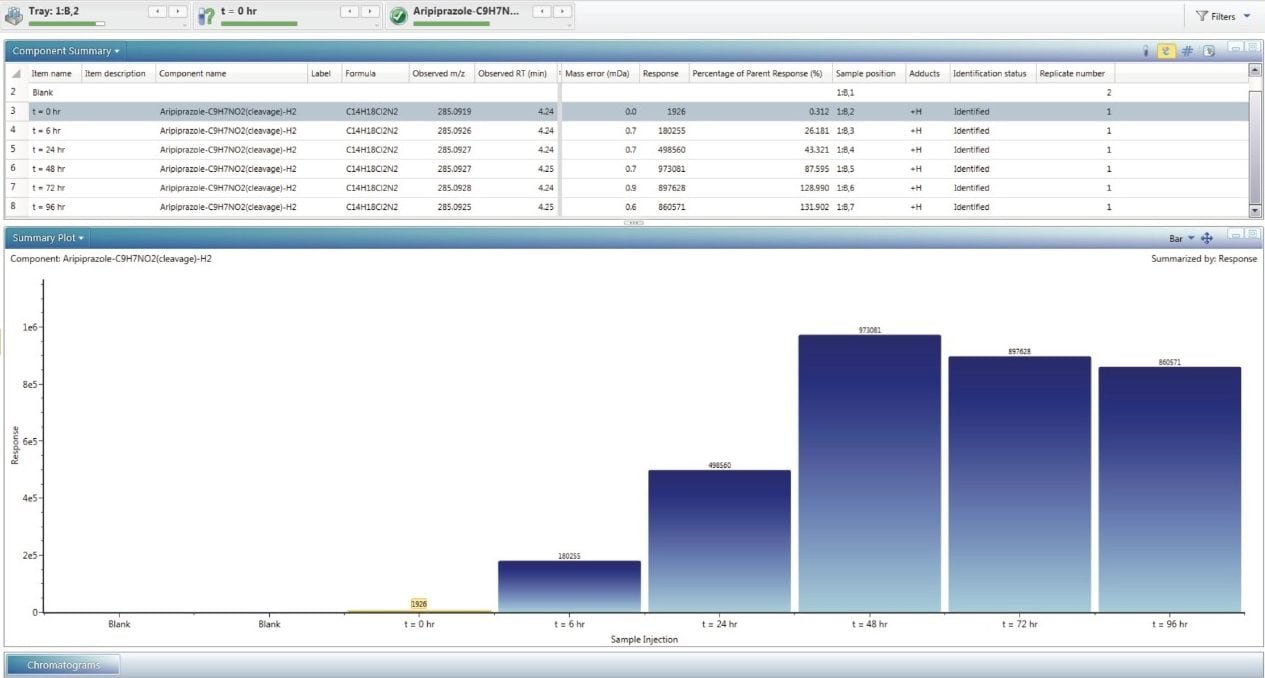
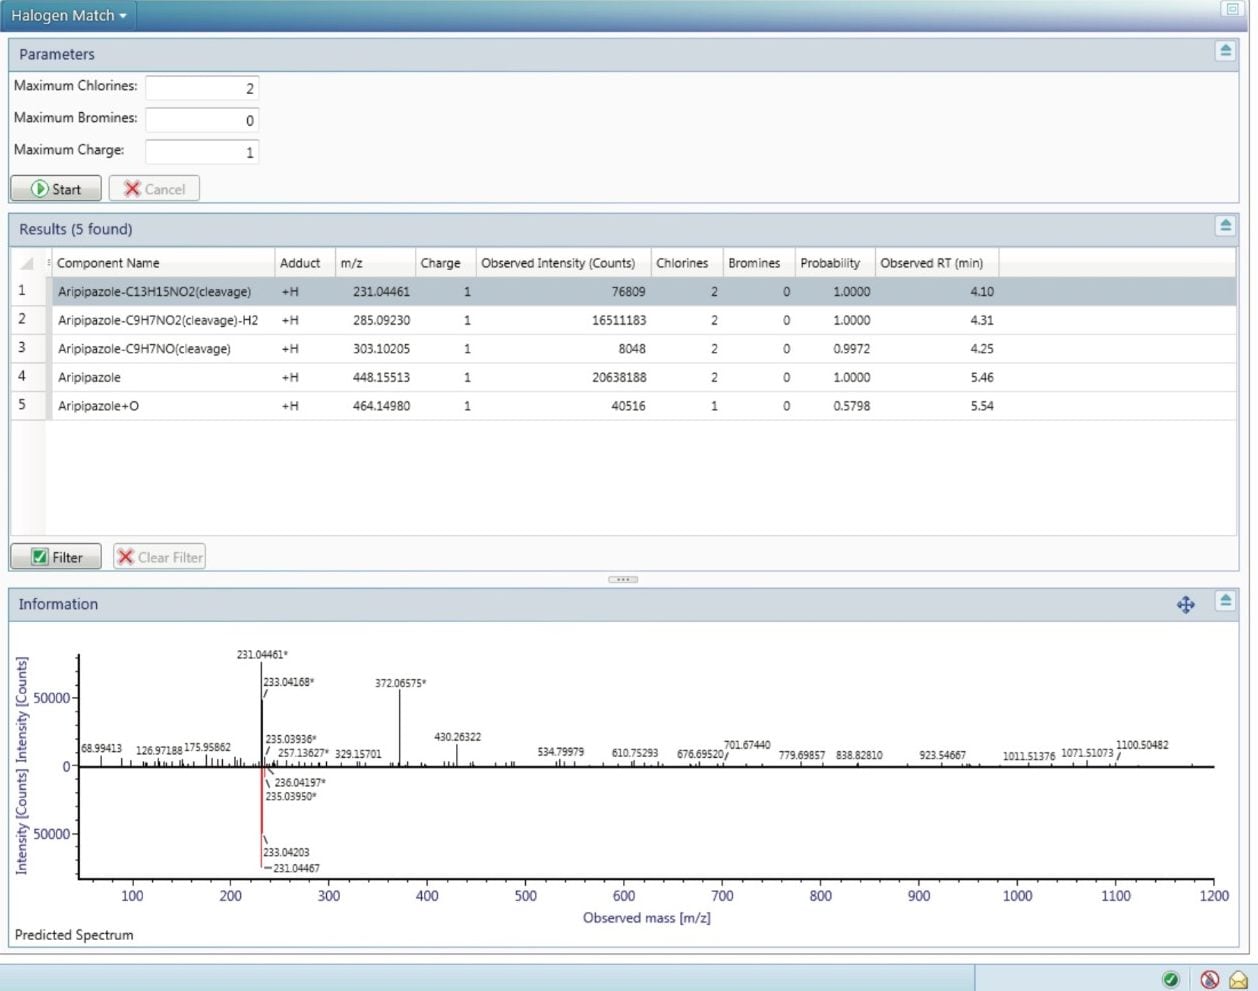
In this application note, aripiprazole – an antipsychotic used primarily in the treatment of schizophrenia and bipolar disorder – was subjected to accelerated stress conditions to generate degradation products.4,5 The resulting impurities were identified and easily visualized using UNIFI. In addition, characterised impurities could be saved to UNIFI’s scientific library and utilized for future screening of samples generated under differing degradation or synthetic conditions.
Base and temperature degradation: The base catalyzed and temperature degradation studies were carried out by adding a small aliquot of 0.1 mM ammonium hydroxide to an aqueous solution of aripiprazole. The sample was then left at 80 °C and aliquots were taken at 0-, 6-, 24-, 48-, 72-, and 96-hour time points. The samples were diluted 1 in 10 with mobile phase prior to injection.
Oxidative degradation: The oxidative degradation was performed by adding 30% H2O2 to a solution of aripiprazole. Samples were diluted 1 in 10 with mobile phase prior to injection.
System: |
ACQUITY UPLC I-Class (FTN) |
Column: |
ACQUITY UPLC BEH C18, 130Å, 1.7 μm, 2.1 mm x 150 mm |
Run time: |
11.0 minutes |
Vials: |
Waters Maximum Recovery |
Column temp.: |
45 °C |
Sample temp.: |
8 °C |
Injection volume: |
0.5 μL |
Flow rate: |
0.4 mL/min |
Mobile phase A: |
Water + 0.1% formic acid |
Mobile phase B: |
Acetonitrile + 0.1% formic acid |
Time (min) |
%A |
%B |
Curve |
---|---|---|---|
0.0 |
95 |
5 |
– |
7.0 |
40 |
60 |
6 |
8.0 |
0 |
100 |
6 |
9.0 |
95 |
5 |
11 |
MS system: |
Xevo G2-XS |
Ionization mode: |
ESI+ ve |
Source temp.: |
120 °C |
Desolvation temp.: |
450 °C |
Desolvation gas: |
800 L/hr |
Reference mass: |
Leucine enkephalin [M+H]+ 556.2766 m/z |
Acquisition range: |
50–1200 m/z |
Scan time: |
0.1 sec |
Capillary voltage: |
1.0 kV |
Cone voltage: |
25 V |
Collision energy: |
Function 1 – 6 eV Function 2 – Ramped 25–45 eV |
Data management: |
UNIFI v 1.8.1 with Accurate Mass Screening and Metabolite Identification Application Solution |
In this study, aripiprazole was used as a model compound to demonstrate impurity identification using UPLC/MSE and UNIFI.6 From the literature,4,5 several known degradation products were added to UNIFI’s scientific library and targeted, along with potential impurities whose structures were predicted by a rule set relevant to oxidative degradation (Figure 1).
UNIFI is comprised of a series of workflow steps that are designed to enable visualization of the entire dataset so that the information required to make a decision can be easily accessed. This approach facilitates consistent, concise, and rapid review of an entire sample injection within an analysis. These steps can be customized and created to suit a particular analysis. An example of a workflow designed for impurity identification data review is shown in Figure 2.
The scientific library within UNIFI is an integral part of the software package and can be used as a repository for storing information as well as structures. Impurity identification within UNFI begins by storing the structure of the API in the scientific library. The possible degradation products of the API can then be selected and searched for during automated processing. The structure information is also used to automatically annotate fragment ion spectra.
In addition, the scientific library contains a set of chemical and biological transformations (oxidations, reductions, dealkylations, etc.) which routinely occur during degradation. There are over a hundred transformations already provided and custom transformations can be added easily.
Impurity identification review shows the component summary, chromatogram, and spectral windows (Figure 2). The component summary shows a list of the detected components that the software has identified as potential impurities. The table shows information such as the formula, m/z, mass accuracy, retention time, isotopic match, and matched fragments. Impurities that have been identified can easily be visualized by scrolling through the component table; as the component list is navigated, all other windows update to show the data relevant to the currently selected component. The chromatogram window is split into three, with the top showing the PDA trace, the middle showing the XIC of all the identified impurities, and the bottom showing the XIC of the selected component. Here the PDA trace is shown, however, it is also possible to report an analog trace through the Estatin module. Because the experiment was performed in MSE mode, two spectra are shown in the spectral window. The top spectrum shows the low energy channel containing precursor ion information and the bottom spectrum shows the high energy MSE channel, containing fragment ion information. Product ion assignment is automatically performed during the analysis, annotated directly on the spectrum, which greatly simplifies interpretation.
The impurity hierarchy map provides a snapshot of the degradation experiment based on the identified impurities (Figure 3). Aripiprazole resides at the center of the map. All identified impurities are connected via arrows. Data relevant to each impurity can also be accessed from here, such as the low and high energy MSE spectra, fragment ion assignments, and the localization of the transformation.
Transformation localization is automatically performed and aids the user in identifying where on the API structure the transformation has likely occurred. The software works by automatically comparing the high energy MSE spectrum of the API (bottom) to the high energy MSE spectrum of the impurity (top), as shown in Figure 4. The differences between them are highlighted and colour coded assignments are made to the spectral peaks where UNIFI has identified relationships. In Figure 4 several preserved fragment ions are observed, indicated by the green color that links the spectral peaks in the impurity spectrum with those of the API spectrum. This data was generated from the degradation of aripiprazole in the presence of peroxide.4 Almost all the fragment ions which contain the unique double Cl fragmentation pattern are preserved. The software utilizes this information to construct a heat map of the molecule shown on the left. The mass shift of the parent ion is due to oxidation, +O, which is precisely and unambiguously measured as +15.9949. The XIC (Figure 5), shows that a number of oxidative degradants were generated under these conditions. The spectra of each of these can be reviewed and structural information can be characterized. Within Figure 5 the low and high energy (MSE) spectra are shown for the impurity, aripiprazole + O, at 3.62 min. The fragment ion at 285.0920 m/z, attributed to C14H19Cl2N2, is generated for the majority of the oxidative degradants (and API) consistent with the conclusion that the main route of degradation occurs on the topmost side of the molecule as displayed in Figure 4.
These forced degradation experiments were performed over several time points. The concentrations of the impurities relative to the API can be observed using the trend plot (Figure 6). Figure 6 shows the decrease of the API followed by the concomitant rise of the major impurity at 285.0920 m/z with the molecular formula determined as C14H18Cl2N2.
Unexpected or novel API-related impurities or potential excipients from formulations can be characterized and interrogated further using the elucidation toolset within UNIFI. It is comprised of a comprehensive suite of structural elucidation tools including integrated ChemSpider (Royal Society of Chemistry) search, isotopic pattern modelling, and elemental composition tools. Shown in Figure 7 is the halogen search option. Aripiprazole contains two chlorine atoms, resulting in a characteristic isotopic pattern. This pattern can be searched for in detected components to highlight those that have not been identified through use of the transformation list. Figure 7 shows the list of components that have an isotopic pattern indicative of up to two chlorine atoms. Discovery tools are also available for searching for compound-related ions using mass defect, common fragment, and neutral losses.
Impurity identification of aripiprazole in forced degradation experiments was successfully completed using ultra performance liquid chromatography, high resolution mass spectrometry, and the UNIFI Scientific Information System. The ability to acquire accurate MSE data within one injection gave a complete overview of the samples and allowed aripiprazole and its impurities to be identified. UNIFI enabled the use of customizable workflow steps to allow data analysis to be performed easily and efficiently. In addition, impurities identified could be readily stored and retrieved from the scientific library embedded within UNIFI. The relationships between aripiprazole and its impurities were easily visualized using the data evaluation tools present in UNIFI.
The Xevo G2-XS is a highly sensitive HRMS platform with high mass accuracy compatibilities. These capabilities enable rapid and confident detection of impurities and confirmation versus a targeted approach through pre-defined library entries.
720005604, February 2016