Metabolomics Workflow using a Xevo™ MRT Mass Spectrometer
Abstract
We demonstrate the acquisition and data processing to identify and pathway profile a typical metabolomic study acquired using a Xevo™ MRT Mass Spectrometer coupled with an ACQUITY™ Premier LC System. The resulting data shows a clear unsupervised PCA separation between the three study groups with exogenous or environmental markers being the most significant differences from the different volunteer lifestyles. The Xevo MRT MS delivers rapid, robust data acquisition for large cohort metabolomic studies, capable of providing a high mass resolution of up to 100,000 full width half maxim (FWHM) and consistent sub-ppm mass accuracy, ensuring the analyst has increased confidence in putative feature identification.
Benefits
- Simple and robust workflow delivering excellent data reproducibility and confident results
- A powerful benchtop mass spectrometer routinely providing high mass resolution for both precursor and product ions, enabling separation of compounds with near identical molecular weights e.g. isoforms
- Delivering a consistent mass accuracy <1 ppm RMS, increasing confidence in putative feature identification
- Ability to acquire data at extremely fast acquisition rates, maintaining mass resolution and mass accuracy benefits. Allowing compatibility with shorter chromatographic methods, increasing sample throughput
- Wide dynamic range providing up to 5-orders of linearity, allowing for a single injection to accurately determine the relative concentration of both low and high abundance compounds within a complex matrix
Introduction
Metabolomics is an area of research which aims to identify key metabolic markers originating from phenotypic differences e.g. disease state, environmental changes, treatment regime etc. This could be to improve the detection of disease, to assess impact of pollutants, or to assist with personalized/tailored medical treatment. The metabolome is very complex, containing thousands of analytes with a bias towards smaller molecular weight compounds. Once potential biomarkers have been highlighted using statistical analysis of the data, the challenge can be to confidently identify the compounds of interest.
Higher mass resolution leads to narrower spectral peaks leading to more accurate mass measurement, allowing for tighter mass tolerances for elemental composition and/or database identification searches, improving the confidence in putative identifications. Many small molecules are also observed share similar molecular weights (isoforms). By increasing the mass resolution of the mass spectrometer data clarity is improved, with a higher mass resolution it is possible to separate two compounds with similar molecular weights. With lower mass resolution these isoforms may have merged to form a single spectral peak, leading to erroneous mass determination and incorrect compound identification.
Using a commercially available urine metabolomics study, we demonstrate the benefits of the Xevo MRT QTof mass spectrometer: delivering routine sub-ppm mass accuracy and high mass resolution. This workflow utilizes the software package MARS (MassAnalytica, Barcelona, Spain) for data processing, statistical analysis and putative identification. A more detailed overview of this software and its functionality can be found in the Waters™ application note: Screening Metabolomics of Human urine using a Waters High Resolution QTof Mass Spectrometer and MARS Data Processing Software.1 The resulting data showed significant changes in exogenous or environmental markers for each of the different volunteer lifestyles.
Experimental
Study Design
Healthy volunteers provided a urine sample, these were subsequently pooled into three master samples as supplied, indicating nicotine intake from cigarettes: non-smoker, passive nicotine intake and current smoker. This is a commercially available metabolomic sample set; NIST® SRM® 3671 Nicotine Metabolites in Human Urine (NIST, USA).
Sample Preparation
A study QC was prepared taking a 200 µL aliquot from each smoker level and combining to create a QC pool.
Waters LCMS QC Reference Standard (LCMS Mix) (p/n: 186006963), was diluted 1:3 in ultrapure water - 500 µL of LCMS Mix diluted with 1500 µL of ultrapure water.
A 10 µL aliquot of each smoker level and of the pooled QC sample was diluted with 170 µL of ultrapure water and spiked with 20 µL of the prepared LCMS Mix and vortexed for 15 seconds to ensure homogeneity.
Five analytical replicates of each sample were injected using an ACQUITY Premier UPLC™ onto the Xevo MRT MS with no further sample preparation, data acquisition was controlled using waters_connect™ Software.
LC Conditions
|
LC system: |
ACQUITY Premier UPLC FTN |
|
Column(s): |
ACQUITY UPLC HSS T3 (2.1 mm x 100 mm, 1.7 µm) |
|
Column temperature: |
45 °C |
|
Injection volume: |
1 µL |
|
Flow rate: |
0.6 mL/min |
|
Mobile phase A: |
Water 0.1% formic acid |
|
Mobile phase B: |
Acetonitrile 0.1% formic acid |
|
Gradient: |
99% A hold 0.3 minutes, 99%-50% A 0.3–7 minutes, 50%–30% A 7–8 minutes, 1% A 8–9 minutes, re-equilibrate initial conditions 9–10 minutes. |
MS Conditions
|
MS system: |
Xevo MRT MS |
|
Ionization polarity: |
Positive ESI |
|
Capillary voltage: |
2 kV |
|
Sampling cone: |
30 V |
|
Source offset: |
80 V |
|
Source temperature: |
120 °C |
|
Desolvation temperature: |
600 °C |
|
Cone Gas flow: |
50 L/Hr |
|
Desolvation flow: |
600 L/Hr |
|
StepWave mode: |
Default Transmission |
|
Analyzer mode: |
Sensitivity |
|
Data format: |
MSE continuum |
|
Acquisition range: |
50–1200 Da |
|
Scanning speed: |
20 Hz |
|
Fragmentation CE: |
20–40 eV |
|
Lockspray flow: |
10 µL/min |
|
Lockspray settings: |
Average 3 scans every 60 seconds |
|
IDC: |
On (Default) |
Data were rapidly processed within MARS software for peak picking, statistical analysis, compound identification and pathway profiling. Compound identification was performed using a HMDB database.
Results and Discussion
A small-scale urine metabolomics study was analyzed on a Xevo MRT coupled to an ACQUITY Premier UPLC. The data were processed within MARS software, and searched against the HMDB library for putative compound identification.2 This rapid and simple reversed-phase (RP) metabolomics methodology generated sharp, well separated chromatographic peaks (Figure 1).
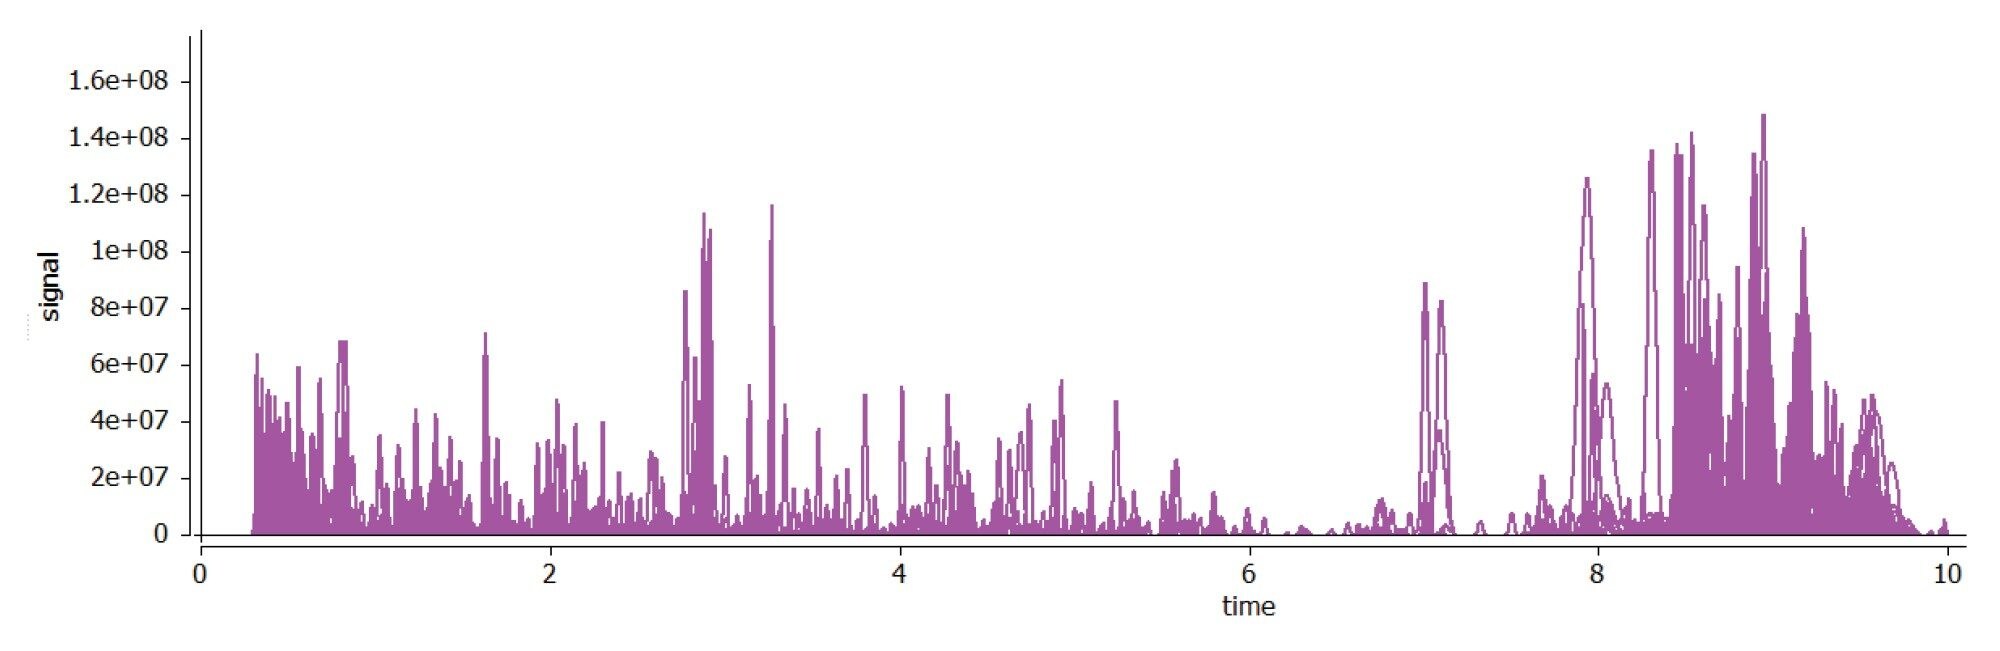 Figure 1. Example injection of a Pooled QC of the NIST urine, visualized within the Mars software platform.
Utilizing an unsupervised principal component assay (PCA) plot it was possible to clearly distinguish between the three cohort nicotine levels and the QC injections clustered centrally (Figure 2). Tight QC grouping indicated a stable, robust analysis with little/no batch effect and distinct well separated sample groupings, indicating that differentiating components are due to true biological variance. Once clear unsupervised separation had been established, a supervised (OPLS-DA) statistical analysis was performed comparing the L1 (non-smoker) urine to the L3 (smoker) urine, from which an S-Plot was generated for easier selection of features of interest.
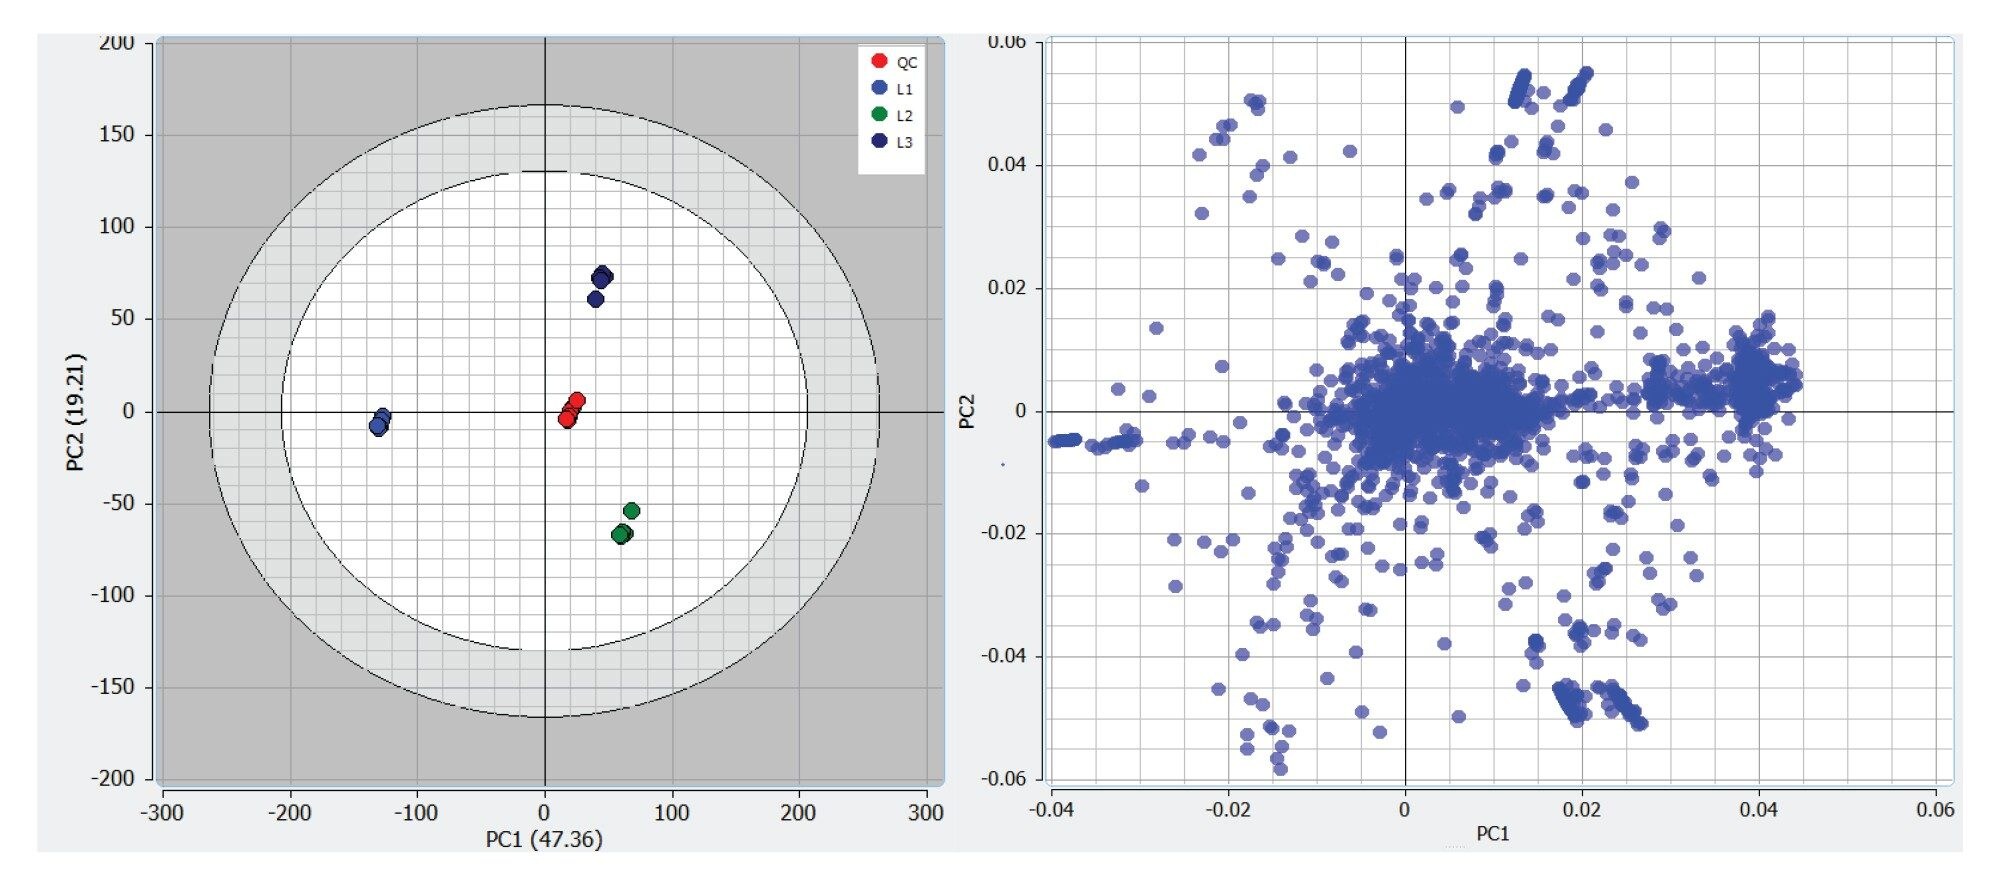 Figure 2. Mars generated unsupervised PCA plot and associated loadings plot for the three nicotine intake levels in human urine.
One of the biggest challenges in omics studies is the confident identification of potential biomarkers, particularly within the field of metabolomics as low molecular weight compounds make mass accuracy a challenge, since many have very similar molecular weights. The Xevo MRT Mass Spectrometer routinely delivers mass accuracy measurements within ±1 ppm for even the smallest of compounds, combined with a mass resolution of up to 100,000 FWHM, providing increased identification confidence and allowing differentiation of analytes with similar molecular weights.
An example can be seen in Figure 3, showing the extracted ion chromatogram (XIC) of an analyte with an m/z of 328.10278, this XIC demonstrates a clean chromatogram with sharp, well defined chromatographic peaks at 1.63 minutes. Putatively identified as Acetaminophen Glucuronide, the precursor analyte was detected with a ~78,000 FWHM mass resolution putatively identified with a 0.09 ppm mass accuracy (theoretical mass: 328.10269). Acetaminophen Glucuronide was and five fragment ions, giving a confidence score of 91.9 and the main fragment ion (Acetaminophen theoretical mass 152.07060) was detected with a mass resolution of ~58,000 FWHM and a -0.46 ppm mass accuracy. This drug metabolite was found in both the passive smoker and smoker donor urine, and not observed in the non-smoker urine.
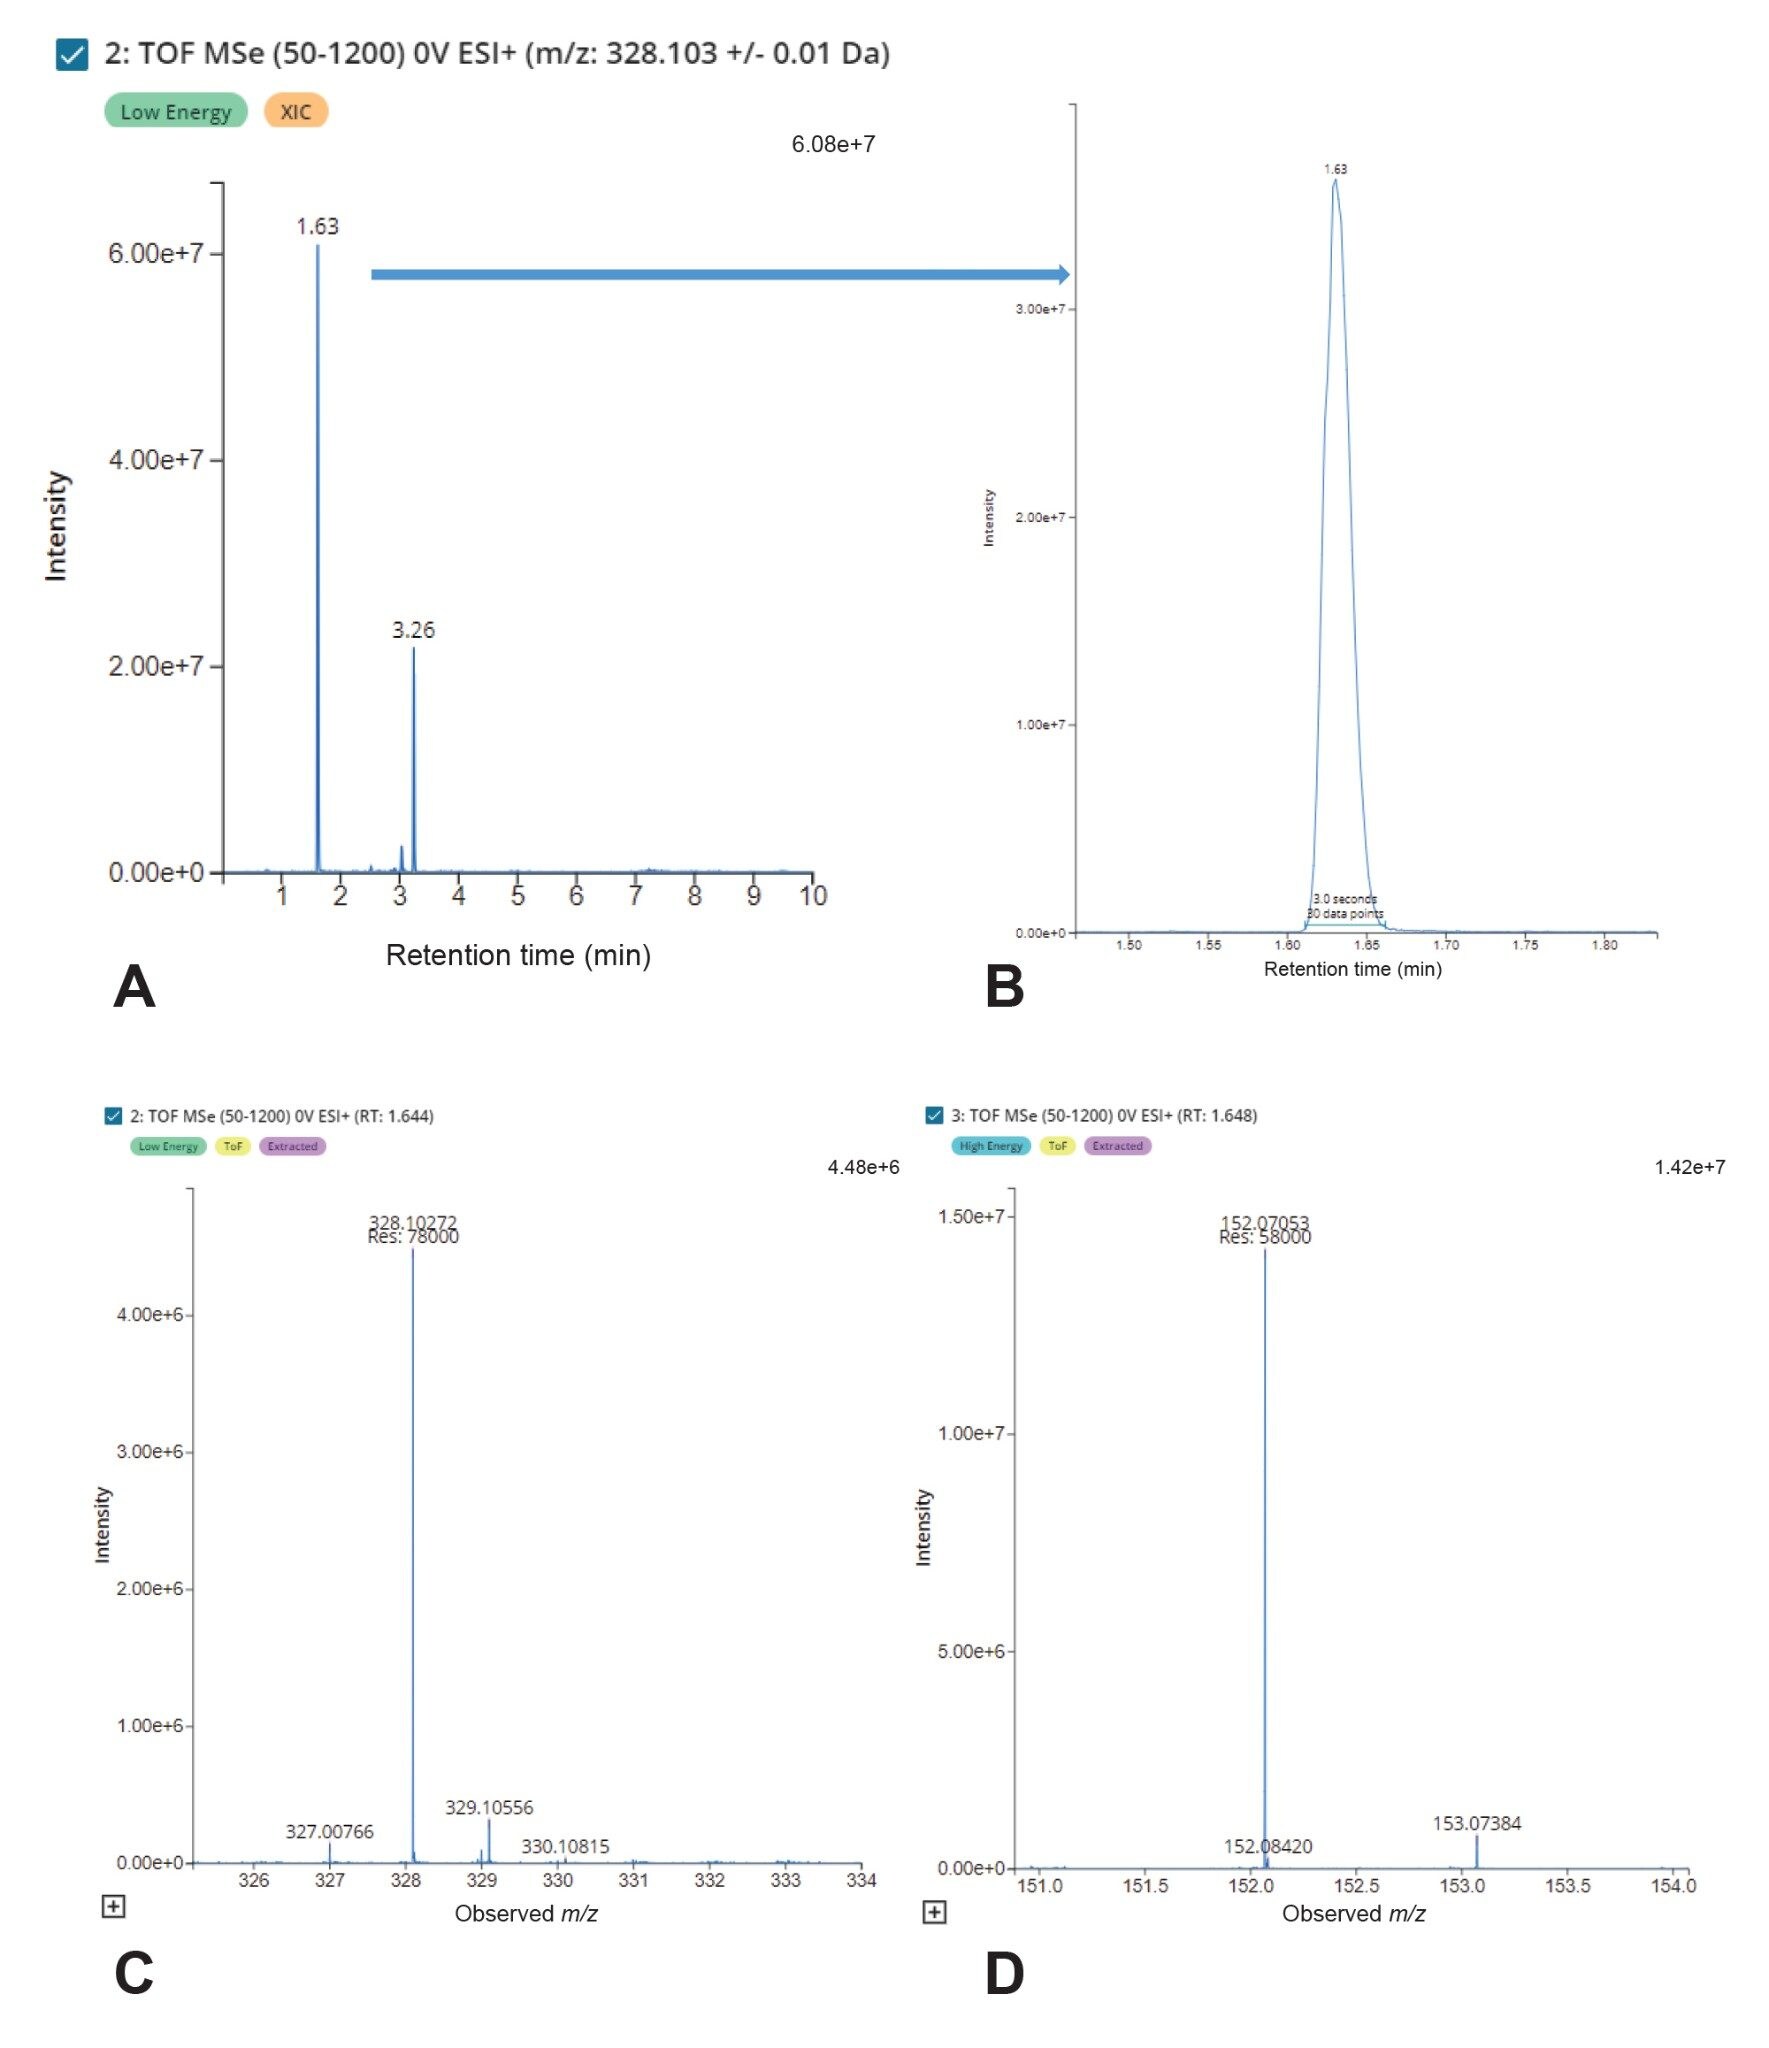 Figure 3. An example XIC and spectrum showing the putative identification of Acetaminophen Glucuronide (A+B), with a precursor mass resolution of ~78,000 FWHM and mass accuracy of 0.09 ppm (C) and a fragment mass resolution of ~58,000 FWHM and a mass accuracy of -0.46 ppm.
With this example dataset >1300 features were putatively identified with a mass error less than 1 ppm when all features were searched against the HMDB library. When features of interest were selected based upon non-smoker vs habitual smoker ~55% of these potential biomarkers were putatively identified with a sub 1ppm mass accuracy. Within the MARS software, potential compound annotations show the proposed compound structure, and the MS/MS spectrum can be viewed with theoretical fragments highlighted in red, the analyte spectra in blue and the precursor m/z highlighted with a green marker.
Some examples of compounds which discriminate between non-smokers and smokers were unsurprisingly found to be Nicotine metabolites: Nicotine-1’-N-oxide, and Hydroxycotinine, Figure 4 shows the match within MARS software, where confidence scores of 80.68 and 83.61 respectively, sub-ppm mass accuracy (0.4 ppm and 0.6 ppm respectively) and matching fragmentation pattern (to theoretical) lend confidence to the putative identification of these biomarkers.
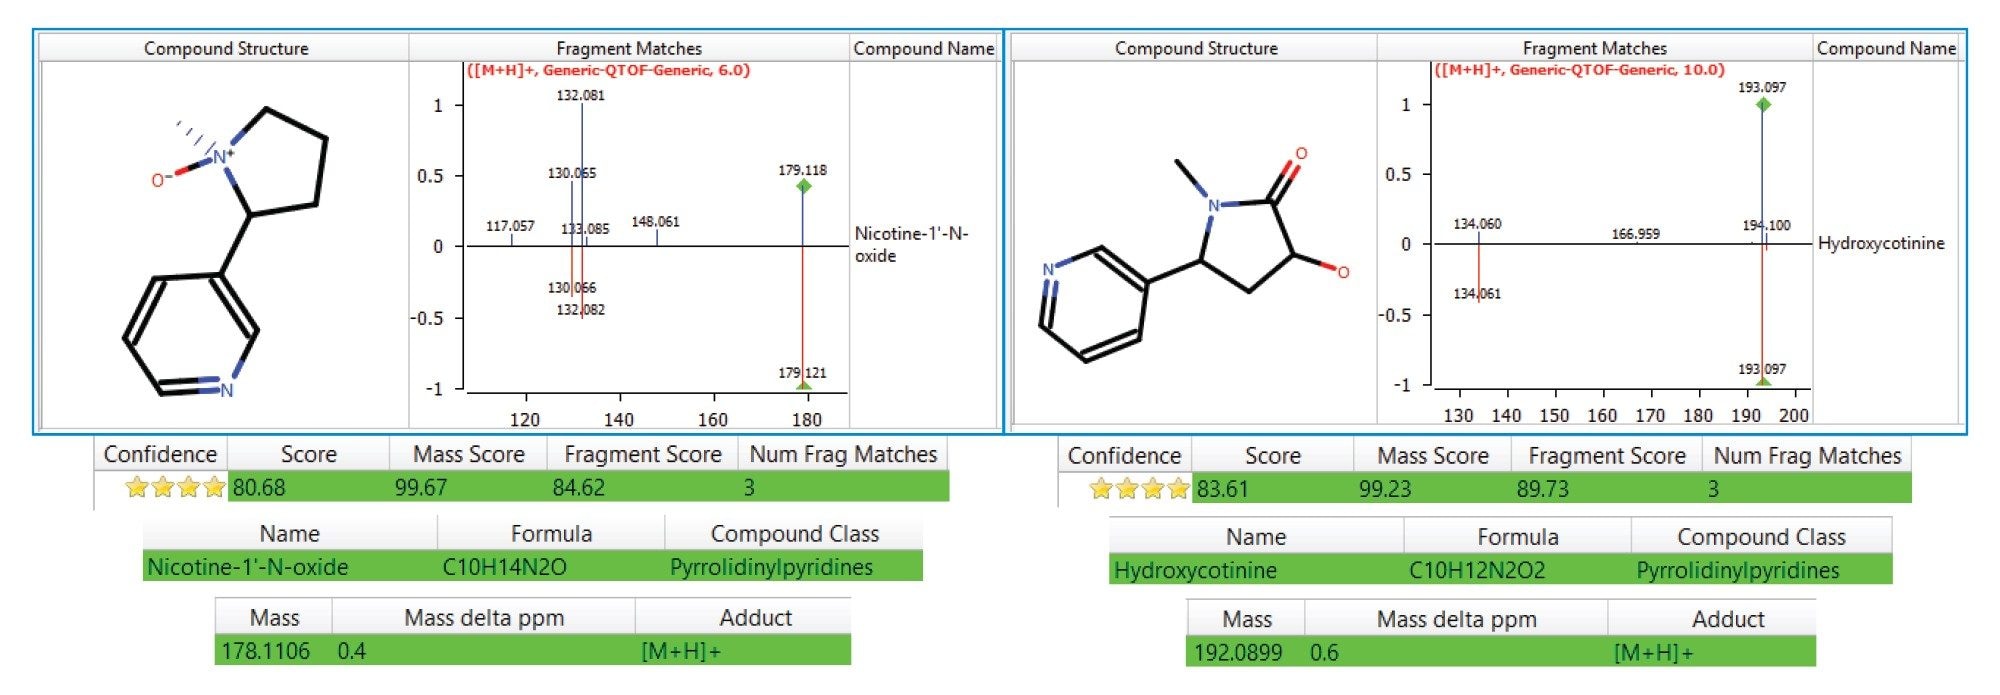 Figure 4. Shows two examples of discriminating features between the groups: putatively identified as Nicotine-1’-N-oxide and Hydroxycotinine.
In this study, it has been discovered that there are a number of recreational and pharmaceutical drugs which are putatively identified as being significant markers between the groups. One pharmaceutical drug identified in the smoker’s urine but not within the non-smoker’s urine is Carbamazepine, both the drug and its metabolite 10-Hydroxycarbamazepine have been identified by PCA separation as being present within the smoker’s urine, as seen in Figure 5. With confidence scores of 63.80 and 83.61 respectively, sub-ppm mass accuracy (0.6 ppm and 0.0 ppm respectively) and matching fragmentation pattern (to theoretical) lend confidence to the putative identification of these biomarkers.
The presence of Carbamazepine suggests one or more of the individuals included within the smoker’s urine pool either suffered from a seizure disorder, or potentially were using Carbamazepine recreationally for its euphoric effects.3 Cocaine and cocaine metabolites are also identified as a strong differentiator between the smoker’s urine and the non-smokers urine therefore recreational drug use cannot be discounted from the smoker donor pool.4
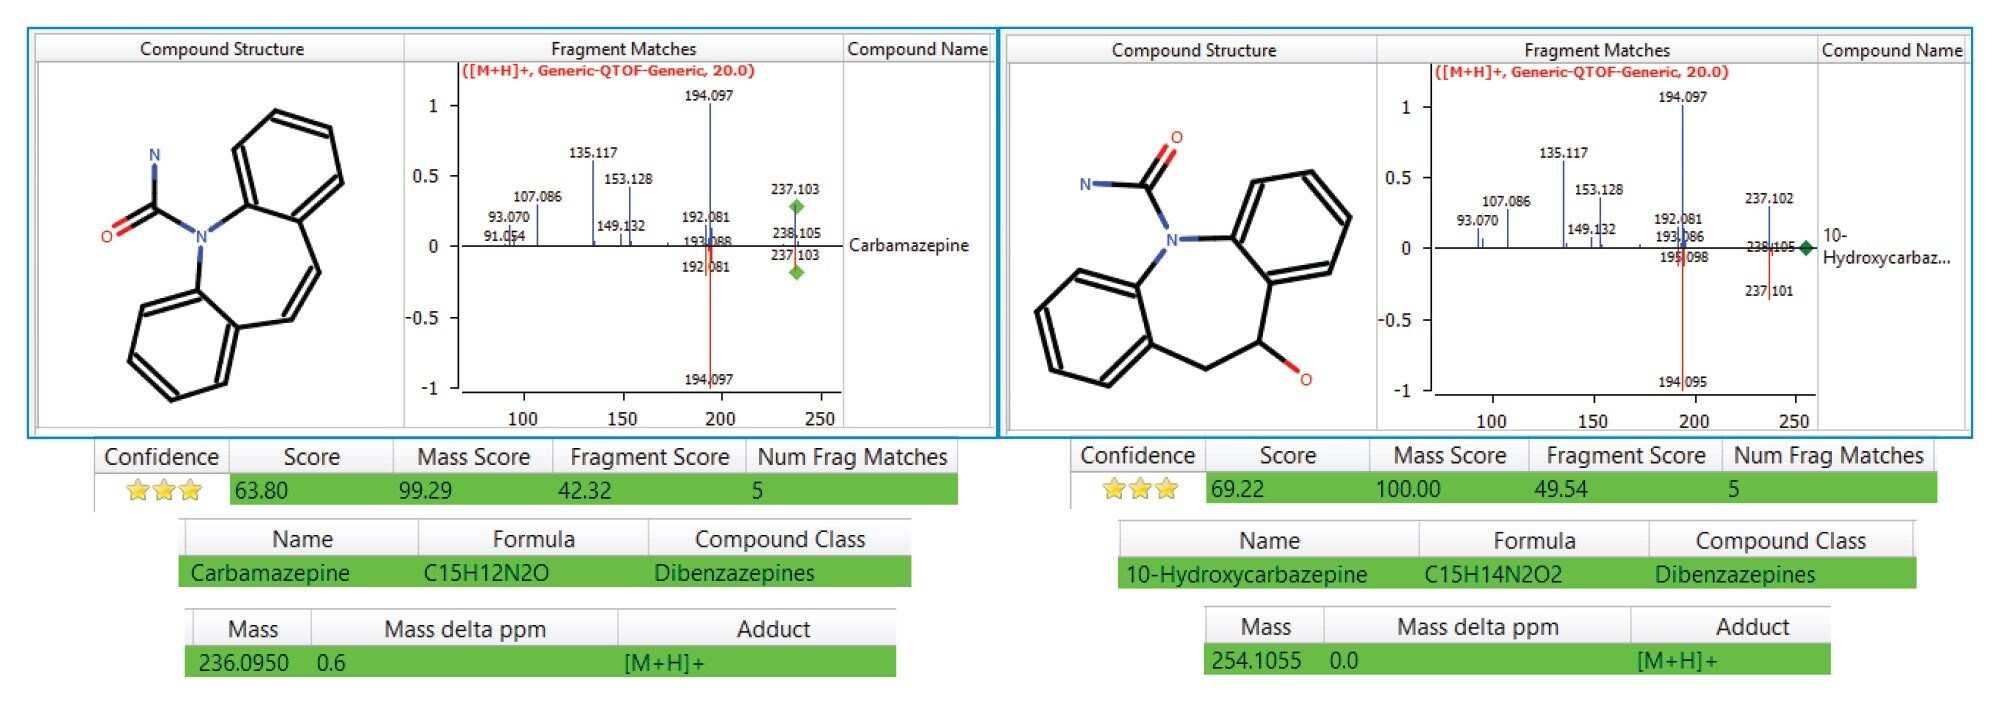 Figure 5. Putative identification of Carbamazepine and one of its metabolites, 10-hydroxycarbaamzepine, a differentiating exogenous compound found in the smoker’s urine only.
There are fewer biomarkers which appear to be up -regulated in the non-smoker’s urine when compared to the smoker’s urine, the donor pool for all three smoker levels is representative of a general population and therefore differences in lifestyle (including recreational drug use) are likely to be the biggest differentiators. One potential biomarker that does however stand out as being “upregulated” within the non-smoker’s urine compared to the smoker’s urine has been putatively identified as Pyridoxine (Vitamin B6), with a confidence score of 89.83, a 0.1 ppm mass accuracy and matching two of two expected fragment ions (Figure 6).
Pyridoxine appears to be significantly excreted by the non‑smoker and not by the smoker donors. This vitamin is found in many foodstuffs and its presence in the non-smoker’s urine could indicate a healthier diet compared to the smoker donors. Its absence in the smoker’s urine is possibly indicative of a vitamin B6 deficiency, which is thought to be potentially caused by vitamin B6 having anti-oxidation benefits and smoking being responsible for significant oxidative stress.5,6
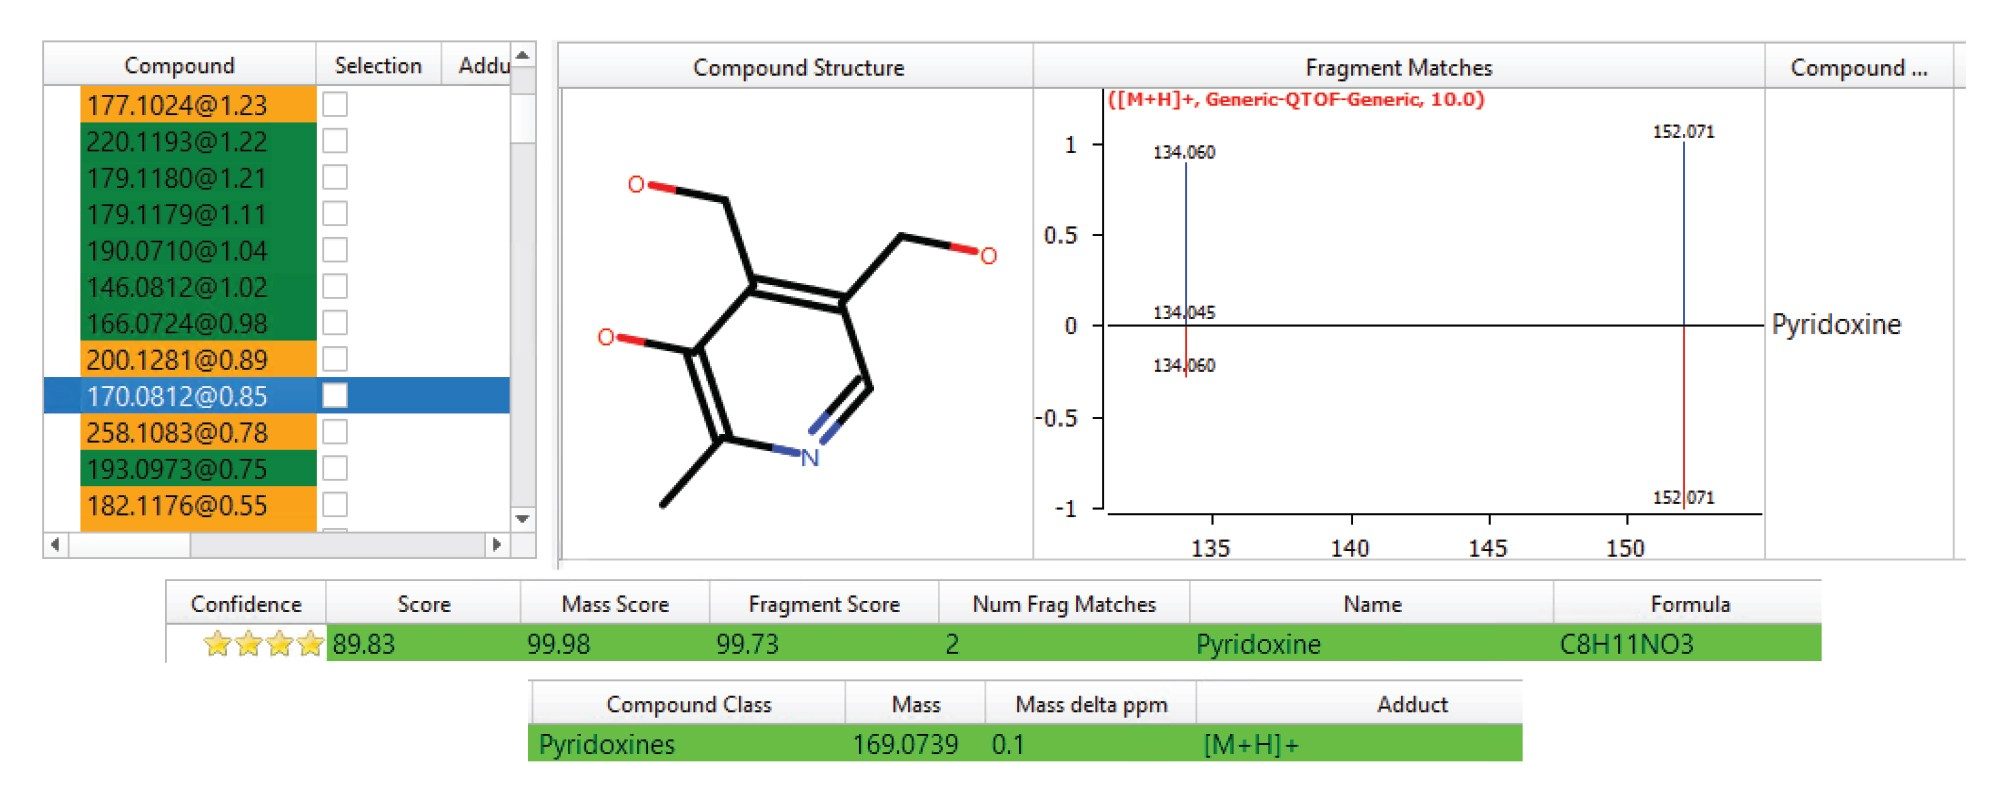 Figure 6. Putative identification of Pyridoxine (Vitamin B6), a differentiating exogenous compound found in the urine of non-smoker and passive smoker donors but not found within the smoker’s urine.
Once potential biomarkers of interest have been found and putatively identified, their relative relationship to one another can be investigated with a trend analysis. Alternatively, a trend analysis can be performed - in addition to statistical analysis - to find potential biomarkers based upon a minimum abundance fold change between two phenotypes. Figure 7 shows some typical trend plots with features described above from this dataset: Nicotine-1’-N-oxide, Hydroxycotinine, Carbamazepine, 10-Hydroxycarbamaepine, Pyridoxine, and Acetaminophen Glucuronide.
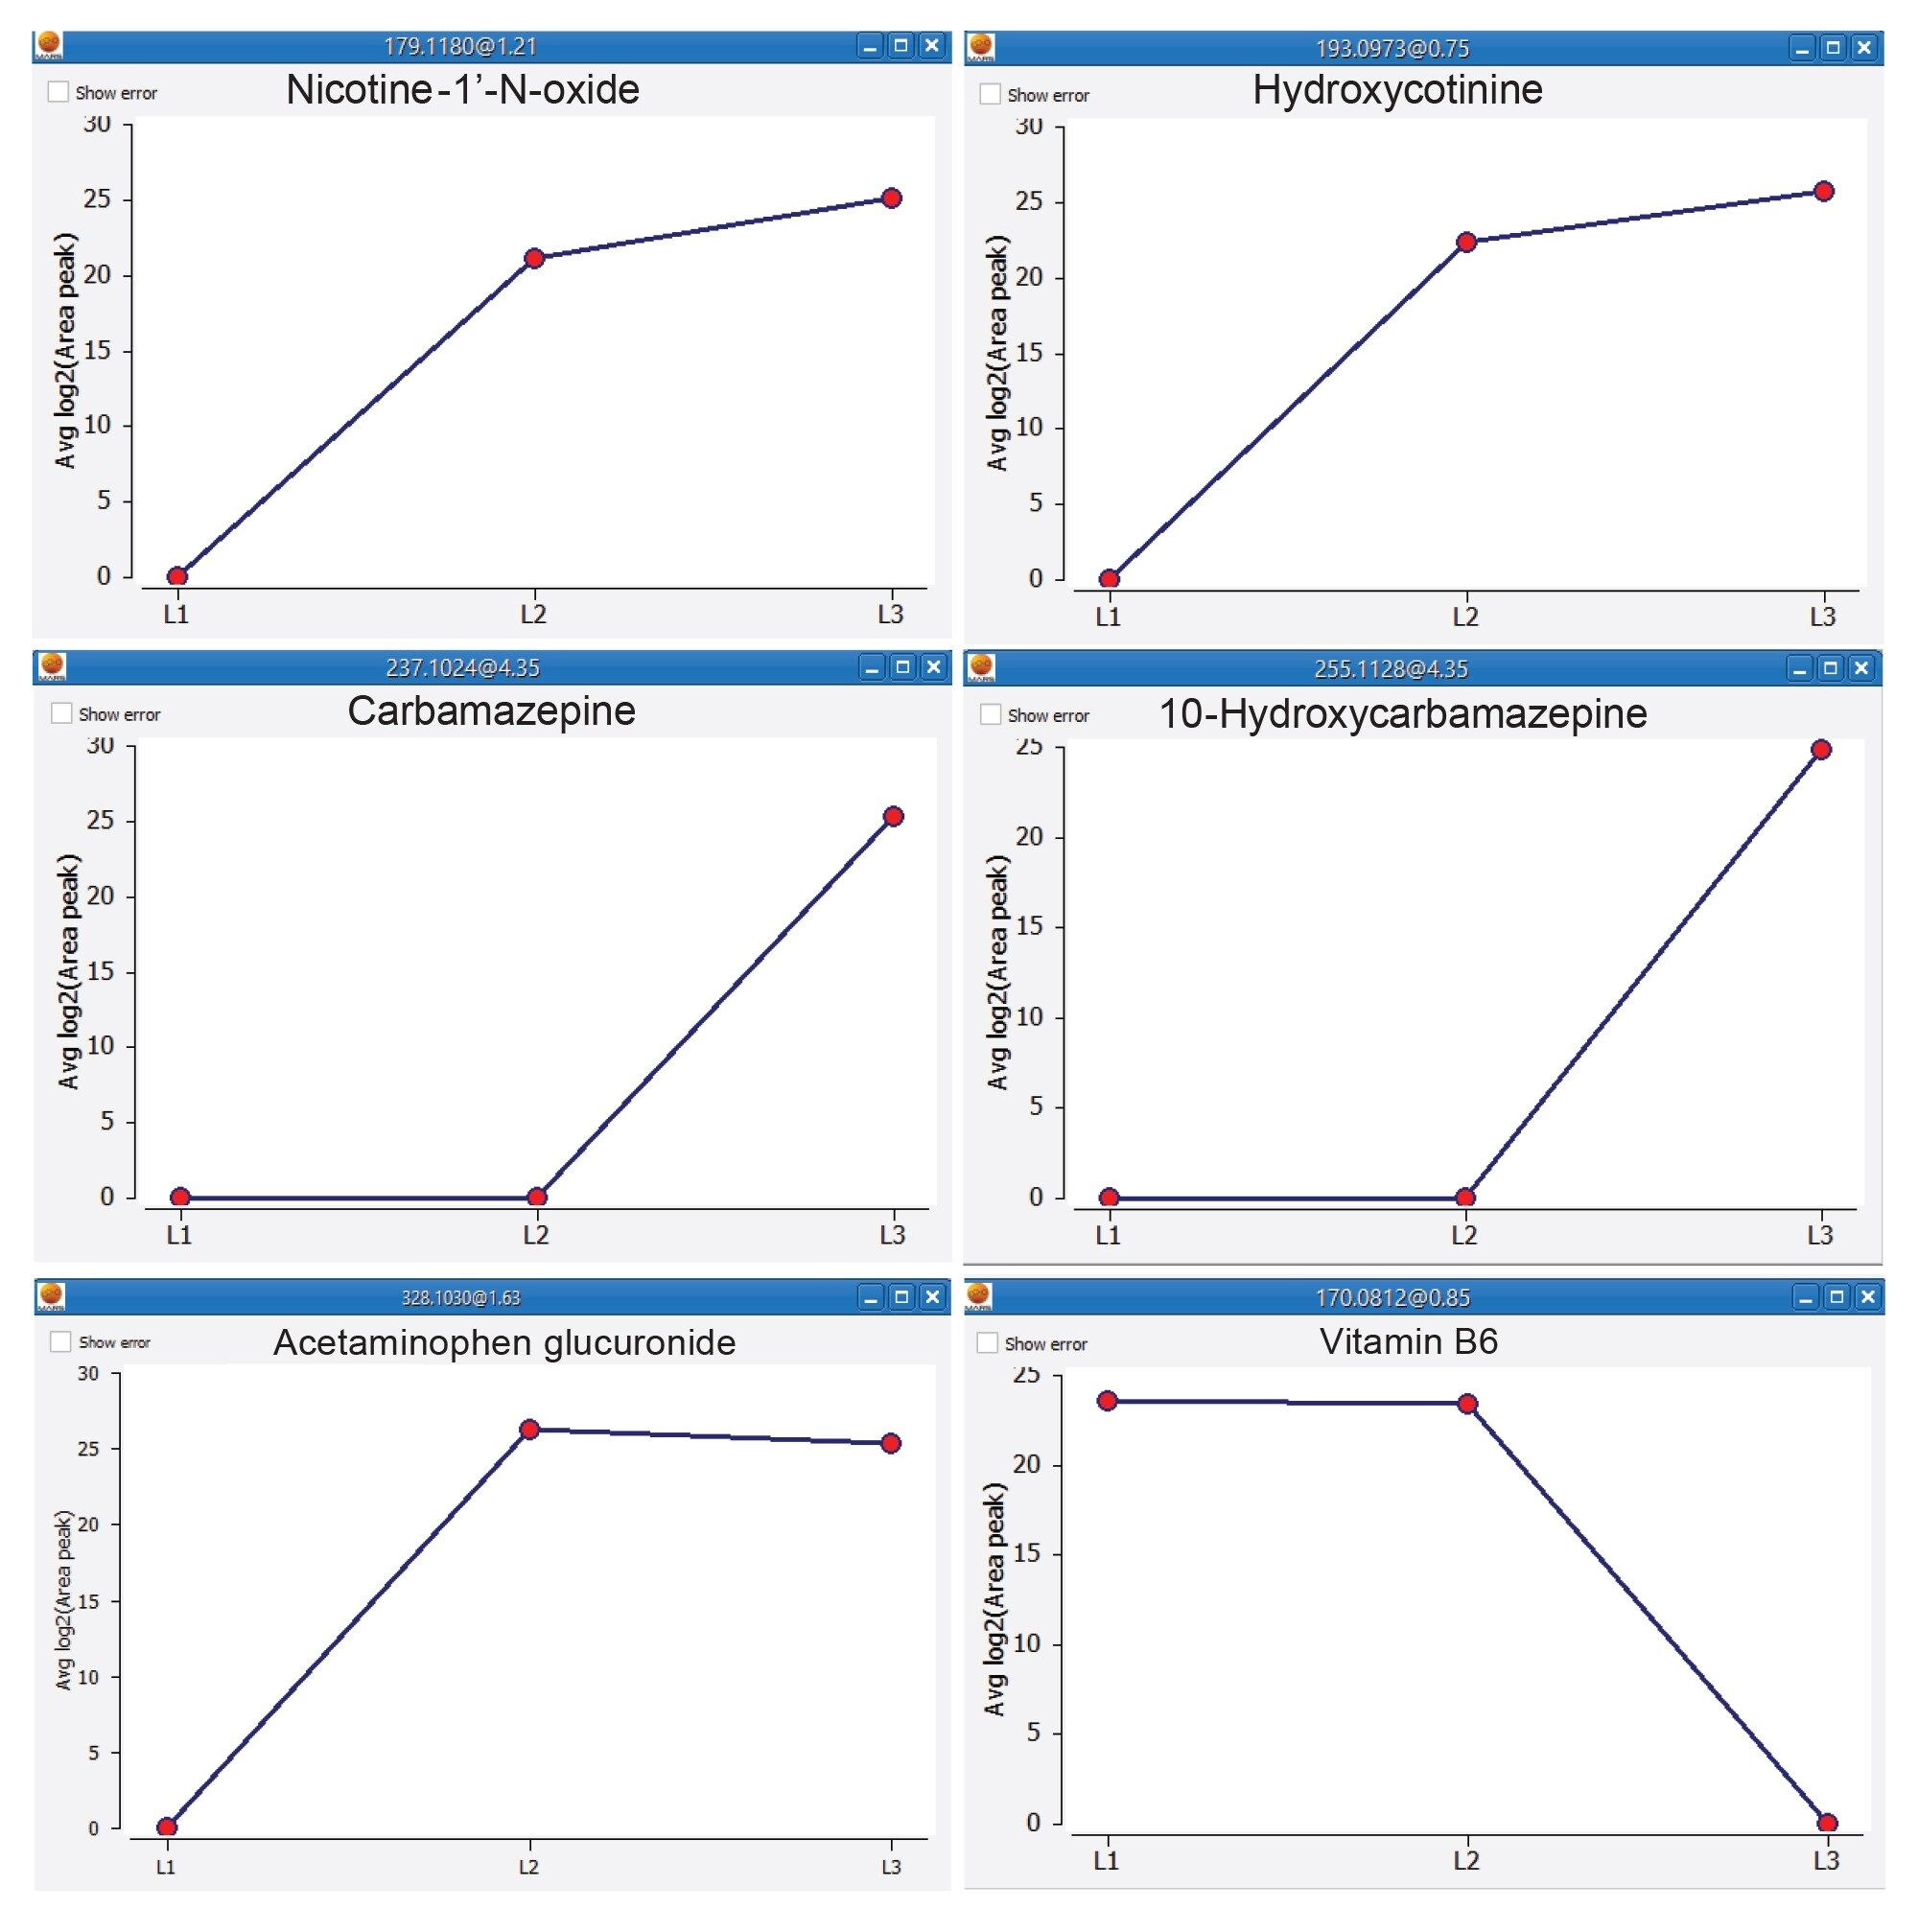 Figure 7. Abundance trend examples for exogenous compounds and their metabolites over the three Nicotine intake levels showing suggested features of interest for separation of the three groups.
It can be noted that the nicotine metabolites are not significantly reduced in the passive smoker’s urine compared to the smoker’s urine, suggesting potentially that the level of nicotine these individuals are exposed to are not substantially different. It can also be seen however that the level of Pyridoxine is comparable between the non-smoker and passive smoker donors, suggesting that the potential vitamin B6 deficiency observed within the smoker’s urine is a result of the direct inhalation of hot smoke and not from particulates or compounds passively inhaled.
Conclusion
We demonstrate that the Xevo MRT Mass Spectrometer coupled with an ACQUITY Premier LC System delivers rapid, robust data acquisition for metabolomic studies. When data is imported into MARS software for data processing this platform provides a powerful tool for acquisition, statistical analysis and putative identification of compounds of interest for metabolomic studies.
This workflow provides the acquisition and data processing needed to confidently identify and pathway profile a typical metabolomic study. The resulting data shows a clear unsupervised PCA separation between the three study groups, putatively identifying several exogenous or environmental markers with a sub 1 ppm mass accuracy and fragmentation patterns, which match closely to theoretical. When these analytes are visualized using a trend plot, significant fold changes indicate differentiation between the three smoker levels. The Xevo MRT MS, delivering a high mass resolution of up to 100,000 FWHM and routine sub-ppm mass accuracy, gives the analyst increased confidence in putative feature identification.
References
- Lisa Reid, Lee A. Gethings, Nyasha Munjoma, Stefano Bonciarelli, Screening Metabolomics of Human Urine using a Waters High Resolution QTof Mass Spectrometer and MARS Data Processing Software, Waters Application Note, 720008397, July 2024.
- Xu W, Chen YL, et al. A Clinical Study of Toxication Caused by Carbamazepine Abuse in Adolescents. Biomed Res Int. Mar, 2018, 22;2018:3201203. doi: 10.1155/2018/3201203. PMID: 29765983; PMCID: PMC5885346.
- Hosseini SH, et al. Abuse Potential of Carbamazepine for Euphorigenic Effects. Drug Res (Stuttg). 2015 Apr;65(4):223–4. doi: 10.1055/s-0034-1370942. Epub 2014 Mar 25. PMID: 24668573.
- Adam King, Isabel Riba, Martin Palmer, Emma Marsden-Edwards, High Resolution Mass Spectrometry Metabolic Profiling of Human Urine Using the SELECT SERIES™ MRT, Waters Application Note, 720008296, April 2024.
- Vermaak WJ, et al. Vitamin B-6 Nutrition Status and Cigarette Smoking. Am J Clin Nutr. 1990 Jun;51(6):1058–61. doi: 10.1093/ajcn/51.6.1058. PMID: 2349919.
- Skeie E, et al. Circulating B-vitamins and Smoking Habits are Associated with Serum Polyunsaturated Fatty acids in Patients with Suspected Coronary Heart Disease: A Cross-sectional Study. PLoS One. 2015 Jun 3;10(6):e0129049. doi: 10.1371/journal.pone.0129049. PMID: 26039046; PMCID: PMC4454679.
720008552, October 2024